DEOS: a new object-oriented simulation environment. A validation study. A. Anglani, P. Caricato, A. Grieco, F. Nucci, M. Pacella Dipartimento di Ingegneria dell’Innovazione - Università degli Studi di Lecce Via per Arnesano, Lecce, 73100 Italy, e-mail:
[email protected]
Abstract Simulation is a widely used technique for modelling manufacturing and other types of complex systems. Software packages, including both general-purpose and specialised environments designed to simulate manufacturing systems, have increased the popularity of simulation. ObjectOriented approach offers significant potential over existing common process-oriented simulation software. In this paper, a new object-oriented discrete event simulation environment, DEOS, is presented and examined. The paper proves the reliability and credibility of the software tool by means of a comparison to a diffused and accredited simulation package such as ARENA. A simple job shop system has been adopted as test case, and both DEOS and ARENA models have been realised. A statistical validation method based on seven performance measures compared using the analysis of variance ANOVA has been adopted.
1. Introduction Due to the rapid advance in computer technology, simulation has emerged as a significant tool for modelling manufacturing and other types of systems in modern industries. Various software packages, including both general-purpose simulation and specialised packages designed to simulate manufacturing systems, have been developed. Essentially, they consist of a collection of functions and procedures accessed trough highlevel constructs. The use of high-level constructs allows a more natural modelling phase of a system than the one obtained with traditional generalpurpose programming languages. The validity of these languages is proved by various applications available in literature [1,2]. Nevertheless, these packages commonly referred as process-oriented, have their drawbacks. Since their abstractions are suitable to represent only independent entity flows among processes, they lack flexibility and are inadequate to model a co-ordinated behaviour among different components. In general, it is broadly established that traditional process-oriented programming methodologies are not convenient to cope with flexible, maintainable and complex software. Object Oriented (O-O) programming has proved to be a powerful technique with respect to modelling and design of complex systems and it offers
significant potentials over other popular simulation language in several respects [3]. The O-O approach has advantages connected with handling complexity, reusability, extendibility, modularity, and data abstraction, which enables it to manage software requirements more effectively than traditional programming approaches. Promoting reuse of software blocks and shortening the software development time-cycle are particularly significant features of the O-O technique. An object-oriented approach is particularly promising for the development of simulation software. Although commercial and academic O-O simulation systems have recently emerged, such as SIMPLE++ (by AESOP [4]) and MODSIM (by CACI [5]), a new environment named DEOS (Discrete Event Object Simulator) is proposed in this work. The aim of the presented environment is to provide a research environment for O-O design, analysis, and management of complex systems. The features of the proposed environment are basically different from the mentioned commercial tools. Since DEOS consists in a pure message-passing environment it allows an easy modelling of the coordinated behaviour among different components. Moreover, DEOS combines interactive simulation model design, object manipulation, simulation and output analysis to provide an intuitive modelling capability. The aim of the new environment is to allow the user to easily design simulation model by means of two main features. • The first concerns software maintenance: visual code is simpler and easier to interpret. • The second is relative to software modifications: a new layout simulation requires only inserting additional objects into the system and specifying the new relationships among them. Simulators on the market do not support a simple and direct message passing modelling. For example in SIMAN [6], a SCAN block, that checks conditions, and a SIGNAL block, that can activate the WAIT block are provided. This simulator, however, does not use any message passing among objects but global variables that can be directly accessed in any simulation flow. In this paradigm, models (i.e. sequence of SIMAN blocks) can become so interdependent that a small change has a massive ripple effect. Moreover, MODSIM, one of
the object-oriented simulation languages available on the market, since all parts of message-passing architecture should be designed and implemented by the user, the construction of its models can be somewhat overloaded. This paper is organised as follows. In section 2 the main DEOS features are presented. Section 3 reports the DEOS simulation framework. In section 4, a case study is illustrated while, in section 5, the statistical validation is conducted. Concluding remarks are provided in section 6.
2. DEOS features DEOS is a new discrete–event simulation tool intended for the simulation of systems with complicated logic (in particular manufacturing systems). DEOS provides a window-based objectoriented design tool implemented using Borland C++ Builder. Its features are quickly available trough a tool bar containing seven items: “Classes”, “Connector”, “Start Simulation”, “Stop Simulation”, “View Report”, “View Objector Inspector” and “View Chart Graph”. DEOS contains many utilities to easily conduct a simulation study. These capabilities include: • Model design: the simulator layout is realised using the “Classes”, “Connector” and “View Object Inspector” menus. • Execution: performed using the “Start Simulation” and “Stop Simulation” items. • Output analysis: performed using the “View Report” and the “View Chart Graph” items. In DEOS, the definition of a simulation model includes two steps. The first step is to define the
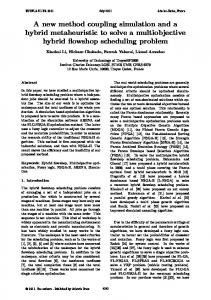
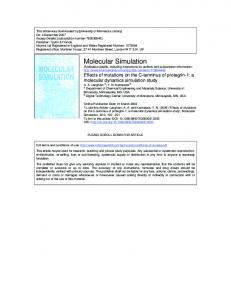
scheme, which implies the definition of all the objects involved in the simulation (including servers, queues et.) and the relationships among them. The second step consists in defining the experiment through the definition of the individual characteristics of each type of object. The logical separation between scheme and experiment increases the reusability of the scheme and the coverage of modelling capability (this means that the system can be used to build very complex simulation models). However, in DEOS, the above mentioned division does not exist from the user-interface point of view, whereas ARENA presents a separation between model and experiment blocks. To build the model the user takes the necessary components and places them on the form. It is possible to set the properties of DEOS objects and to describe their behaviour just by double-clicking on each of them. This feature allows a more rapid systems design, and facilitates detailed and complicated modelling without a large amount of different blocks to be compiled. DEOS environment is intended for GUI (Graphical User Interface) design. It allows the user to easily design and change the simulation model through menus and dialog box (see Fig. 1). To build the model the user just selects necessary objects from “Classes” menu and places them on the form. In the developed release, the “Classes” menu contains five major elements: “Creator”, “Destroyer”, “Queue”, “Incrementator” (i.e. server), and “Branch”. Once a scheme is built up, the characteristics of each element can be defined. By using the “View Object Inspector” functionality, the user can set
Fig. 1 - The DEOS Design Window
directly its properties. Relationships among objects can be established using the “Connector” function. Using other components, the user can easily implement the input of parameters and the output of simulation results in any possible way. Such combination creates a very flexible and productive framework for developing powerful simulation applications. From the programming point of view, it is very important to notice that DEOS is library-based; this implies that customisation and further upgrade can be simply achieved by reusing and extending the already existing code. The main advantage consists in the possibility to improve the potentiality of any block by overloading the correspondent object methods in the given class code. In this way simulation model designers can add additional block features by using the same block interface. For example, additional management policies can be added to a queue block without placing other ARENA modules in the model definition code. This greatly improves the usability and maintainability of the designed model. Finally, in the summary report, the machine process time, the maximum queued, the count of each entity type and other statistical information collected can be seen. The interpretation of the coefficient of mean, standard deviation, total entry number, can help formulating conclusions about the modelled system. For each object, all performance measures can be exported in ASCII format file for further study.
3. The simulation system The simulation system is designed by means of object-oriented approach. The main idea of DEOS modelling is that a simulation model formalisation may be realised as an oriented graph with the nodes, corresponding to some processing objects (such as creators, queues, machines etc.). The arcs of the graph correspond to connections among objects. These connections establish relations among different objects in terms of entity flows. During the simulation process, entities (i.e. objects) are passed from one block to another. By using components methods, properties and events, it is possible to control the behaviour of the model and obtain the necessary statistical results. The main simulation algorithm deals with states and events of blocks. Transactions are generated, moved and terminated during different operations with blocks. The main cycle of the simulation algorithm scans the system calendar (the timeline). Items of the list are ordered by time. Each item of the timeline stores the address of the transaction and the block. Each scanning of the timeline means getting the first item, changing the model time, and executing all possible transaction passes. When transaction goes from one block to another, (i.e. an
entity passes from on object to another), the simulation manager executes the programmed delays. In this way based event-oriented framework the user can describe the behaviour of the model.
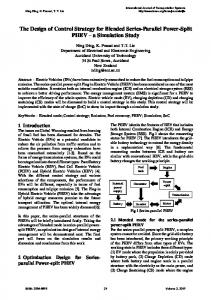
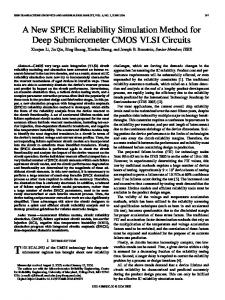
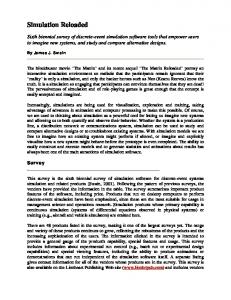
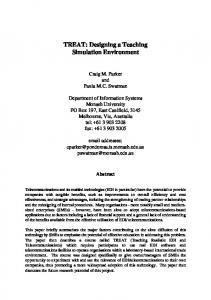
4. The case study As an example, a typical job shop system has been selected. It reproduces a job shop system consisting of 3 machines, 3 queue-buffers and 2 part types (see Fig. 2). In intervals of normal distribution two “Creator” objects introduce entities of two part types into the model: type one (two) for the entities produced by Creator1 (Creator2). These entities come into a queue buffer - Queue1 - then into a machine for processing - MachineA. Once a normally distributed processing time has been performed, the entities go to “Branch” which routes them into two different queue-machine systems depending on the part type (Queue2-MachineB for type 1 and Queue3-MachineC for type 2). A normally distributed length time models the service time, then the entities go to the “Destroyer” block and are terminated. Queues capacity is infinite and the maximum number of elements introduced into the model is set to 500 for both part types. Seven performance output measures of the DEOS simulation model have been compared using the ANOVA analysis of variance over 15 replications to the analogous measures obtained from the same model developed using ARENA (see Fig.3 and Fig. 4). Both applications have been executed on a PC equipped with CPU Pentium III-500Mhz, 128 Mb RAM. The processing time for “Machine” and the inter-arrival of the “Creator” objects are shown in Table 1. Object MachineA MachineB MachineC Creator1 Creator2
Distribution Normal(6,1) Normal(13,2) Normal(12,1.5) Normal(10,1) Normal(8,1)
Table 1 - Processing and inter-arrival times Negative values inferred from the normal distribution for interval and delay, are automatically set to zero. The following list reports the seven performancemeasures that have been compared. • Average number of elements in queue, applied to Queue1, Queue2, Queue3; • Average saturation level, applied to MachineA, MachineB, MachineC; • Simulation Time
• •
Fig. 2 - DEOS Model for the case study
Fig. 3 - ARENA Experiment for the case study
Fig. 4 - ARENA Model for the case study
6. Conclusions 5. Statistical validation The primary purpose of the experimental design consists in performing a statistical validation of the DEOS developed model. Validation is defined as the activity to determine whether a simulation model is an accurate reproduction of the real system under study or not [7,8]. In the realised experiment, the real system is represented by the ARENA model. The well-known ANOVA one-way test has been adopted over seven-performance output [9]. Analysis of variance extends the two-sample t-test for testing the equality of two population means to a more general null hypothesis of comparing the equality of two or more means, versus them not all being equal (at confidence level α). Since we are studying a set of multiple responses, a statistical complication arises: the probability of rejecting a null-hypothesis increases as the number of responses increases (say R), even if the simulation model is correct. This property follows from the definition of the Type I or α error of a statistical test. A simple solution is based on the Bonferroni’s inequality. Traditionally the Fo value is compared with Fα(m,n), which denotes the critical value taken from the table for the F statistic with m numerator degree of freedom and n denominator degree of freedom, Type I error probability fixed at α. Using Bonferroni’s inequality, the analysts merely replaces α by α/R. A one-way analysis of variance is adopted with a global confidence level αfam = 0.05. Using the Bonferroni’s inequality, the α level for each of the seven tests (α is equal in each test) is set to 0.05/7 = 0.007. The critical value for each of the statistical tests is F0.007(1,28)=8.4713. The ANOVA test results are reported in Table 2 (see Appendix). The ANOVA test assumes independent distributed simulation responses and normal residual with homogeneity of variance. Since F for each test is less than the critical value F0.007(1,28) it is possible to conclude there is no statistical evidence showing that the performance measures obtained from DEOS model are different from the analogues performance measures inferred from ARENA. Therefore, experimental results show that there is not statistical evidence to reject the null hypothesis that DEOS provides the same simulation results provided by ARENA. Finally, it appears that DEOS environment outperforms a traditional process-oriented language in terms of software maintainability, reusability and flexibility, providing, at the same time, accurate simulation results as those ones obtainable with a traditional and proved package as ARENA.
In this paper, a new object oriented simulation environment is briefly described and applied to a job shop case study. The new object oriented environment has been presented at the user level. Moreover, the validity of the proposed environment has been proved by means of a simple case study. In particular, two simulation models have been developed. The former using SIMAN-ARENA language, the latter using DEOS. Experimental results prove the credibility of the proposed environment. The main advantages of the presented environment are: 1. flexibility due to the precise modelling rules as well as to the object-oriented and data-driven implementation; 2. suitability for modelling processes of storing and distributing, due to model components with specific data structures; 3. carefully elaborated user interface. An open field for the future system development is animation. User interface will be upgraded by process animation in order to see the model execution. Further efforts should be done in order to allow the user to construct a detailed graphical representation of the system to be modelled. A dynamic view of model execution can provide valuable insights into model behaviour that are not easily obtained by examining statistical results.
Acknowledgement This work has been partially funded by Ministero dell'Università e della Ricerca Scientifica e Tecnologica MURST, the National Research Council of Italy CNR.
References [1] V. Hlupic, R.J. Paul, Guidelines for Selection of Manufacturing Simulation Software, IIE Transaction, vol. 31 (1999), 21-29. [2] R. D. Macredie and R. J. Paul, Simulation modelling in manufacturing system design: an overview, International Journal of Manufacturing System Design, vol. 2, n. 3, (1995), 233-247. [3] G. Booch, Object-Oriented Analysis and Design with Application (Benjamin / Cummings 1994). [4] Aesop GmbH, SIMPLE++ reference manual, (Aesop GmbH Stuttgart). [5] CACI Products, MODSIM, The Language for Object-Oriented Programming Reference Manual, (CACI Products 1992). [6] C.D. Pegden, R.E. Shannon, R.P. Sadowski, Introduction to Simulation Using SIMAN, (McGraw-Hill, 1995).
[7] J.P.C. Kleijnen, Statistical Validation of Simulation Models, European Journal of Operational Research, vol. 87, (1995), 21-34. [8] J.P.C. Kleijnen, Verification and Validation of Simulation models, European Journal of Operational Research, vol. 82, (1995), 145162.
[9] D.C. Montgomery, Introduction to Statistical Quality Control, (3rd ed. New York: Wiley, 1996).
Appendix Analysis of Variance for Queue1 Source DF SS MS Environm 1 25.64 25.64 Error 28 242.94 8.68 Total 29 268.58 Analysis of Variance for Queue2 Source DF SS MS Environm 1 0.080 0.080 Error 28 3.516 0.126 Total 29 3.596 Analysis of Variance for Queue3 Source DF SS MS Environm 1 0.05 0.05 Error 28 161.20 5.76 Total 29 161.25 Analysis of Variance for MachineA Source DF SS MS Environm 1 0.039 0.039 Error 28 6.874 0.245 Total 29 6.913 Analysis of Variance for MachineB Source DF SS MS Environm 1 0.585 0.585 Error 28 14.204 0.507 Total 29 14.790 Analysis of Variance for MachineC Source DF SS MS Environm 1 0.032 0.032 Error 28 16.878 0.603 Total 29 16.910 Analysis of Variance for SimTime Source DF SS MS Environm 1 21 21 Error 28 43542 1555 Total 29 43564
F 2.96
P 0.097
F 0.64
P 0.430
F 0.01
P 0.925
F 0.16
P 0.693
F 1.15
P 0.292
F 0.05
P 0.819
F 0.01
P 0.907
Table 2 - ANOVA tables for each test obtained with MINITAB.