Proceedings of the 2007 11th International Conference on Computer Supported Cooperative Work in Design
Design a Neural Network for Features Selection in Non-intrusive Monitoring of Industrial Electrical Loads Hong-Tzer Yang 1, Hsueh-Hsien Chang 1,2, Ching-Lung Lin3 1 Dept. of Electrical Engineering, Chung Yuan Christian University, Taoyuan, Taiwan.
[email protected] 2 Dept. of Electronic Engineering, Jin Wen University of Science and Technology, Taipei, Taiwan.
[email protected] 3 Dept. of Electrical Engineering, Ming Hsin University of Science and Technology, Hsinchu, Taiwan.
[email protected] Abstract
1. Introduction
This paper proposes to compare the performance of neural network classifiers between back propagation (BP) and learning vector quantization (LVQ) for pattern analyses of features selection in a non-intrusive load monitoring (NILM) system. Load recognition for identifying loads being connected and disconnected is applied to a NILM by using a neural network, especially for industrial electrical loads, even though some loads are activated at the nearly same time. In order to accurately decompose the aggregate load into its components, a feature-based model for describing the signatures of individual appliances and load combinations is used. The model will suggest the certain signatures which can be detected for all loads in order to indicate the activities of the separate components. To verify the performance of the model for the features selection, the data sets of the electrical loads and the load recognition techniques apply an electromagnetic transient program (EMTP) and a neural network, respectively. The effectiveness and computation equipment of load recognition are analyzed and compared by using the back propagation classifier and the learning vector quantization classifier. To obtain a maximum recognition accuracy rate, the calculation of the turn-on transient energy signature employs a window of samples, ∆t, to adaptively segment a transient representative of a class of loads. Experiments performed with a variety of model data sets which reveal the back propagation classifier is superior to the learning quantization classifier in the effectiveness and computation equipment of load recognition.
In this study, a NILM can be programmed to recognize more appliances. This should increase its ability to recognize appliances by using the optimal signatures model or the features of the appliance. To develop non-intrusive load monitoring, a number of load recognition techniques were investigated [1-5]. Some appliances, especially in industrial plants, have both transient and steady state features with quite different indications and meaning at different points in time. For example, there may be a number of large motors in operation, and some appliances may have variable power, such as water pumps in a steel mill. As a result, for a variety of loads, this equipment does not provide sufficient data to identify which equipment is starting or in operation if the data provides only either steady state or transient load recognitions. To overcome the above problems in this paper, we change the features selection in the NILM to a modelbased approach. Under an industrial environment, it is usually convenient to use EMTP for a variety of load prototypes or templates at normal load operation. To reach a maximum recognition accuracy rate, the calculation of the turn-on transient energy signature employs a window of samples, ∆t, to adaptively segment a transient representative of a class of loads. The experiments performed with a variety of model data sets revealed two results. One result is where the turn-on transient energy signature (UT) is superior to the steady-state energy signature (US) in addition to the current/voltage (I/V), real/reactive power (P/Q), current/voltage harmonic distortion (IHD/VHD), and total current/voltage harmonic distortion (ITHD/VTHD), and the other is where the back propagation classifier is superior to the learning quantization classifier in the effectiveness and computation equipment of load recognition.
Keywords: Features Selection, Load Recognition, Neural Network, Non-Intrusive Load Monitoring.
1-4244-0963-2/07/$25.00 ©2007 IEEE.
1022
2. Power signature problems and turn-on transient energy algorithm 2.1. Problems of power signatures for features selection In general, an appliance may have many load representations. A load may show many physical components. For example, a dryer has two kinds of load, a motor and a heater. A refrigerator has only one kind of load, a compressor, but it has different physical components for defrosting and freezing. Industrial appliances have not only certain unique characteristics but also enable them which are distinguished from each other. These unique characteristics or signatures can be observed by the measured waveforms of the voltage and current supply to the appliance, or from the processed reproductions of these signals, such as the delivered power or harmonics [2]. In accordance with the switch continuity principle, steady-state signatures are additive when two signatures happen at the same time. Sometimes it is difficult to identify each load when the load consumption occurs simultaneously and is added to another load. Contrary to steady-state properties, transient properties are not additive [1]. Most steadystate NILM systems process data in batch format using a day or a few days, so they cannot make real-time identifications for load operation. Load detection on the basis of changes in steady-state power makes commercial or industrial NILMs susceptible to confusion if two loads start up at nearly the same time.
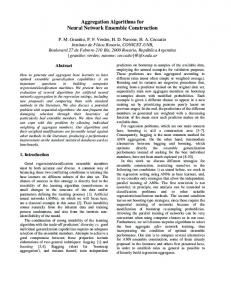
respectively. During a training phase, the transient energy calculation employs a window of samples where the length of time is ∆t to segment a transient representative of a class of loads. This segmentation process delineates a set of transient energy that represents a particular transient shape in each of the input spectral envelopes. To reach the maximum recognition accuracy rate ( γ ) during the test phase, ∆t will be adaptively changed based on factor δ. The adaptive algorithm of ∆t by factor δ is as shown in figure 1. The search for a precise time pattern of instantaneous power makes a complete transient identification, as per Eq. (4). ∧
∵ dWTransient = v ⋅ dq dq = i ⋅ dt and ∴ dWTransient = v ⋅ i ⋅ dt then
t s + ∆t
ts
(2) (3)
v ⋅ i ⋅ dt
(4)
dWTransient (t ) = v (t ) × i (t ) (5) dt
PIns tan tan eous (t ) = ∧
v, i,Δt, γ
initial
Turn-on Transient Event Detector for ts
W
ts + ∆t
∫ v ⋅ i ⋅ dt
=
Transient
ts
Energy Measurement
2.2. Turn-on transient energy algorithms The transient behavior of a typical electrical load is strongly influenced by the physical task that the load performs [4]. Transients in consumer appliances come in different shapes, corresponding to the generating mechanism [1]. Estimates of the spectral envelopes of the current waveform observed at the utility service entry of a building have proven to be remarkably useful for transient event detection in the NILM. Load classes that perform physically different tasks are therefore distinguishable based on their transient behavior [5]. Since the spectral envelopes of instantaneous power are closely linked to telltale physical quantities, they serve as reliable metrics for identifying loads. Analysis of these transient can provide the deciding information to determine which of the two is actually present in the load. Generally speaking the transient behavior of many important loads is sufficiently distinct to serve as a reliable indicator of load type. The long characteristic switching on transient, the less substantial switching on transient, the short but very high amplitude switching on transient and the long two-step switching on transient are the principal measured values used for pump-operated appliances, motor-driven appliances, electronically-fed appliances, and fluorescent lighting,
WTransient = ∫
(1)
∆t = ∆t + δ
δ < ∆t
Neural Network Algorithms
No ∧
γ >γ Yes ∧
γ ⇐ γ
Figure 1. The adaptive algorithm of t by factor at the maximum recognition accuracy of the turn-on transient energy.
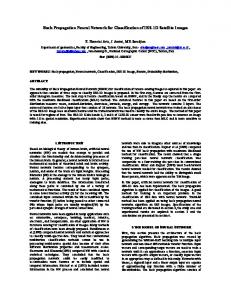
3. Event detection Figure 2 shows the measured envelope of instantaneous power in one phase during the turn-on transient of a bank of loads connected to the A.C. source via a six-pulse power electronic converter. It completes its transient, followed by the turn-on transient of a three phase 140 horsepower induction motor. In this paper, we propose to utilize a wavelet transform analysis to detect and localize various types
1023
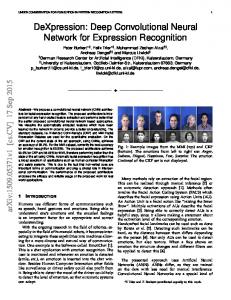
of turn-on transient events measured by NILM. The main underlying idea of this approach is to decompose a given turn-on transient signal into other signals, representing a smoothed version and a detailed version of the original signal containing the shape edges, transitions, and jumps [6,7]. We also investigate the uniqueness of the wavelet transform coefficients (WTCs) since they represent the occurrence of the turnon event. Figure 3 shows the event detection using the Daub2 wavelet transform at scale 1 of the envelope of instantaneous power signal for figure 2. From figure 3, we see the detailed version of sharp turn-on transient events that occur in the vicinity of 0.05 and 0.15 seconds, respectively. The WTCs at scale 1 show the occurrence of the sharp events of a turn-on transient. This is because at scale 1, the analyzing wavelet is most localized.
Figure 2. The envelope of overlapping instantaneous power in one phase during the turn-on transients of a bank of loads connected to the A.C. source via a six-pulse power electronic converter, followed by a three-phase 140 horsepower induction motor.
Figure 3. The event detection uses the Daub2 wavelet transform at scale 1 of the detailed version of overlapping turn-on transient for the signal of figure 2.
4. Turn-on transient energy repeatability Most loads observed in the field have repeatable transient profiles, or at least sections of the transient profile that are repeatable [3]. The load survey indicates non-linearity in the constitutive relationships of the elements that comprise a load model, or in the state equation that describe a load, or both, tend to create interesting and repeatable observable turn-on transient profiles suitable for identifying specific load classes [4]. Because of the variability of transients (which often
depend on the exact point in the voltage cycle at which the switch opens or closes), it is a very important that data sets have good repeatability of transient energy signatures. Pre-training has proven to be a reasonable approach for very repeatable loads that show up in large quantities, such as in commercial and industrial loads. It is evident that turn-on transient profiles have repeatability for measured current waveforms in one phase at voltage phase 0 and 90 degrees for the turn-on transient of a three-phase 300 horsepower induction motor, as shown in figures 4 and 5 respectively. It is clear that the load’s turn-on actions are more complex as their values change over time. A closer investigation of the turn-on of loads is thus required before they can be used as a distinguished feature of a load. These data can be used to answer an important question about the statistical validity of power measurements made via non-intrusive monitoring.
Figure 4. The current waveform in one phase at voltage phase 0 degrees for the turn-on transient of a three phase 300 horsepower induction motor.
Figure 5. The current waveform in one phase at voltage phase 90 degrees for the turn-on transient of a three phase 300 horsepower induction motor. To develop a turn-on transient energy signature, it is useful to know if the turn-on transient energy content is repeatable or not. The average value of the sample data is as in Eq. (6). The standard deviations of the turn-on transient energy are computed for all loads monitored in isolation, as in Eq. (7). An experiment is used to explain that the statistical validity of the turn-on transient energy has repeatability with the coefficient of variation at the next section, as in Eq. (8). The experimental results of the coefficient of variation during periods of nearly steady energy are about 0.4%. This remarkably small number is less than 1% of the total.
x =
1024
1 n
n
∑ xi i =1
(6)
5. Experimental results and discussions
panel. It can be programmed to simulate a variety of possible end-use scenarios. To build a training library, either every site of interest or a representative sampling of the sites should be monitored. The sample rate is around 15 kHz. The appropriate coefficients corresponding to the current and voltage in each harmonic are extracted from the results.
5.1. Environment
5.2. Turn-on transient energy repeatability
s =
1 n − 1
(7)
n
2 ∑ (x i − x ) i=1
(8)
s C .V . = x
Host PC
Substation
22.8kV/ 480V 3MVA, 6% Dyn Non-intrusive Load Monitoring System
3φ Voltage Measurements 3φ Current Measurements
Electronically Switched Circuit Breaker Panel
480V Bus
PC
1
2
3 4
3φ95hp,4poles squirrel-cage I/M
3φ300hp 2poles,S/M
3φ 140hp,4poles squirrel-cage I/M
3φ 6 pulses Rectifer Rload =4Ω
3φ95hp,4poles squirrel-cage I/M Line Frequency Variable-Voltage Drives
Figure 6. The electrical scheme of the industrial plant for the application of NILM
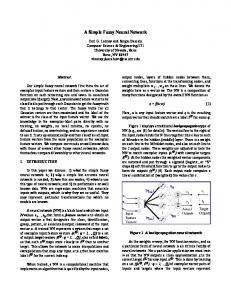
In this paper, the NILM system has been used to monitor the voltage and current waveforms in a threephase electrical service entry that powers a collection of loads representative of important load classes in an industrial building. The neural network algorithm in the NILM system is used to identify a collection of five actual loads of the transient and steady-state signatures in operation at the 480-volt common bus. These loads include a 95 horsepower induction motor, a 140 horsepower induction motor, a 300 horsepower synchronous motor, a 95 horsepower induction motor driven by line frequency variable-voltage drives, and a bank of loads supplied by a six-pulse thyristor rectifier for A.C. power. The test stand used in the experiment is schematically illustrated in figure 6. The prototype monitors the “service entry” to an electronically switched circuit breaker panel, which provides the electrical hookup to the loads. A three phase 480-volt electrical service powers the loads, which was chosen as being representative of important load classes in industrial buildings. A dedicated computer controls the operation of each load connected to the circuit breaker
To prove that the turn-on transient energy has repeatability, an NILM system has five important loads to constitute an industrial plant, as shown in figure 6. The turn-on transient energy for each load can be computed from the measured voltage and current waveform at the service entry, as in Eq. (4). Utility voltage routinely contains both gradual changes and step changes due to factors such as load-dependent voltage drops in transmission lines and tap-changing transformers. Therefore the turn-on transient energy is sampled when the angle of utility voltage is switched in the system from 0 to 350 degrees in intervals of 10 degrees, i.e. the number of samples is 36 for each load. The standard deviations of turn-on transient energy are computed for all loads monitored in isolation, as in Eq. (7). This is used to explain that the statistical validity of the turn-on transient energy has repeatability with the coefficient of variation (C.V.), as in Eq. (8). The results of the coefficient of variation during periods of nearly steady energy for each load are as shown in Table 1. The results indicate about 0.4%. This remarkable small number is less than 1% of the total. This proves that the turn-on transient energy has repeatability. The turn-on transient energy can be used to be one of the power signatures for recognizing the loads in a NILM system. Table 1. The coefficient of variation during periods of nearly steady energy for each load in a NILM system Loads
Load 1 Load 2 Load 3 Load 4 Load 5
C.V. (%) 0.36648 0.02245 0.16077 0.47399 0.10885
5.3. Load recognition in individual operations By changing the combination of a circuit breaker from No.1 to No.5 in individual operations, the data for individual loads status can be obtained. The total number of combinations is 5. Each data set includes a voltage variation from –10% to +10% in intervals of 1%. The total number of data sets is 55 (=5*11). To confirm the inference ability of the neural network, the data are separated into learning data and the testing data. The number of the learning data and the testing data are 27 and 28, respectively. It should be noted that the learning data and the test data were picked randomly from the entire data.
1025
The back propagation classifier, as a learning rule, is one of the most popular and widely used algorithms, and is applied to this network. From table 2, the recognition accuracies of the loads recognition in individual operation are almost all 100%, regardless of the variety of features. Table 2. The results of recognition accuracy and the number of hidden neurons for the prototype when challenged individually with a variety of features used by the back propagation classifier Features
PQ
Recognition 100 Accuracy In Training (%) Recognition Accuracy In 96.43 Test (%) The 7 Number of Hidden Neurons
PQVTHDITHD
PQ VTHDITHDUS
PQ VTHDITHDUT
100
100
100
100
100
100
9
10
10
Table 3. The results of the recognition accuracy and the number of hidden neurons for the prototype when challenged individually with a variety of features used by the learning vector quantization classifier Features
PQ
Recognition Accuracy In 81.48 Training (%) Recognition Accuracy In 78.51 Test (%) The Number of 1000 Hidden Neurons
PQVTHDITHD
PQ VTHDITHDUS
PQ VTHDITHDUT
100
100
100
100
100
100
total number of data sets is 341 (=31*11). To confirm the inference ability of the neural network, the data are separated into learning data and testing data. The number of learning data and testing data are 171 and 170, respectively. It should be also noted that the learning data and the test data were picked randomly from the entire data. A back propagation classifier is applied to this network. Table 4 shows that the training recognition accuracies of the load recognition in multiple operations are 100% for those features with R.M.S. of voltage and current, the odd-order harmonic distortion of voltage/current up to the 25th order, and steady-state energy or turn-on transient energy for one of the features. For these same features, the test recognition accuracies of load recognition in multiple operations are also higher than for the other features. In particular, the test recognition accuracy of the load recognition is up to 95.6% for those features that have turn-on transient energy for one of the features. Table 4. The results of recognition accuracy and the number of hidden neurons for the prototype when challenged simultaneously with a variety of features used by the back propagation classifier Features
800
25
The learning vector quantization classifier, as a learning rule, also one of the most popular and widely used algorithms, is applied to this network. Table 3 shows that the recognition accuracies of the loads recognition in individual operations are also almost 100%, except when the features are real power and reactive power (PQ).
PQ PQ PQ PQVI VTHD VTHD VTHD VHDaIHDb ITHD ITHD ITHD VTHDITHD US UT US
Recognition Accuracy in 5.26 11.7 47.4 59.1 Training (%) Recognition Accuracy in 4.7 11.8 46.5 56.5 Test (%) The Number 7 9 10 10 of Hidden Neurons
a
250
PQ
b
PQVI VHDaIHDb VTHDITHD UT
100
100
67.64
95.6
30
30
The odd-order harmonic distortion of voltage up to the 25th order. The odd-order harmonic distortion of current up to the 25th order.
The learning vector quantization classifier is also applied to this network. Table 5 shows that the training recognition accuracies of the loads recognition in multiple operations are 42.1% for the feature with R.M.S. of voltage and current, the odd-order harmonic distortion of voltage/current up to the 25th order, and the turn-on transient energy for one of the features. For these same features, the test recognition accuracies of the loads recognition in multiple operations are 42.94%, which is higher than the other features.
5.4. Load recognition in multiple operations By changing the combination of circuit breaker No.1 to No.5 in multiple operations, the data for the multiple loads status can be obtained. The total number of combinations is 31. Each data set includes a voltage variation from –10% to +10% in intervals of 1%. The
1026
Table 5. The results of recognition accuracy and the number of hidden neurons for the prototype when challenged simultaneously with a variety of features used by the learning vector quantization classifier Features
PQ PQ PQ PQ PQVI VTHD VTHD VTHD VHDaIHDb ITHD ITHD ITHD VTHDITHD US UT US
Recognition Accuracy in 2.34 20.5 29.2 34.5 Training (%) Recognition Accuracy in 2.94 22.4 26.5 35.3 Test (%) The Number 15000 15000 15000 15000 of Hidden Neurons a b
PQVI VHDaIHDb VTHDITHD UT
41.52
42.10
40.58
42.94
15000
15000
The odd-order harmonic distortion of voltage up to the 25th order. The odd-order harmonic distortion of current up to the 25th order.
5.5. Discussions There are different representations of load patterns for the individual operation and multiple operations. In the individual operation, a class shows that the representation is only one load. But, in the multiple operations, a class may show that the representation can be one or many more loads. That is to say, a class may be a combination of loads above two. It is evident that based on this reason the multiple operations are more difficult and more complicated than an individual operation when it comes to classification, regardless if the classifier is a back propagation classifier or a learning vector quantization classifier. To overcome this difficulty in the recognition accuracy within the multiple operations, it is not sufficient for these features to be measured only from steady-state. That is, it is difficult in steady-state power to identify each load when the load consumption is simultaneously the sum of other load consumptions. In contrast with steadystate properties, transient properties can play a complementary role. It is necessary to combine the transient and steady-state approaches, using additional signatures of objects such as the harmonic distortion or total harmonic distortion, and even turn-on transient energy for event recognition. For the individual operation, the back propagation classifier requires less computation equipment, or a smaller number of hidden neurons than the learning vector quantization classifier. For the computation equipment within the multiple operations can not be compared between the back propagation classifier and the learning vector quantization classifier due to the fact that the program has no convergence until the number of maximum iterations is used by the learning vector quantization classifier.
6. Conclusions The EMTP simulation proved to be invaluable for testing the experimental pattern recognition samples, and led to the speedy development and implementation of a successful prototype. The NILM system employs an adaptive algorithm of turn-on transient energy for start-up analysis in order to accurately analyze the startup transient. The turn-on transient energy and the harmonic distortions of orders which are also quite important signatures in the industrial loads (because these loads are not only resistance components) provide a tremendously improved recognition capacity. The recognition accuracy can be relatively high, up to 95.6%, especially in multiple operations with a back propagation classifier.
References [1] G. W. Hart, "Nonintrusive appliance load monitoring," in Proc. 1992 IEEE Conf., vol. 80, pp. 1870-1891. [2] J. G. Roos, I. E. Lane, E. C. Botha, and G. P. Hanche, "Using Neural networks for non-intrusive monitoring of industrial electrical loads," in Proc. 1994 IEEE Instrumentation and Measurement Technology Conf., pp. 1115-1118. [3] Christopher Laughman, Kwangdul Lee, Robert Cox, Steven Shaw, Steven B. Leeb, Les Norford, and Peter Armstrong, "Power Signature Analysis," IEEE Power & Energy Magazine, pp. 56-63, March/April 2003. [4] Norford, L. K. and Steven B. Leeb, "Non-intrusive electrical load monitoring in commercial buildings based on steady-state and transient load-detection algorithm," Energy and Buildings, 24, pp. 51-64, 1996. [5] Steven B. Leeb, “A conjoint pattern recognition approach to nonintrusive load monitoring,” Ph. D. dissertation, Department of Electrical Engineering and Computer Science, M.I.T., February, 1993. [6] Surya Santoso, Edward J. Powers, W. Mack Grady, Peter Hofmann, "Power quality assessment via wavelet transform analysis," IEEE Trans. Power Delivery, vol. 11, No. 2, pp. 924-930, April 1996. [7] David C. Robertson, Octavia I. Camps, Jeffrey S. Mayer, William B. Gish, "Wavelets and electromagnetic power system transients," IEEE Trans. Power Delivery, vol. 11, No. 2, pp. 1050-1057, April 1996.
1027