School of Engineering, SSSUTMS Sehore (M.P.) ... CERTIFICATE ... Electrical Engineering, (SoE), SSSUTMS, Sehore (M.P.), is a record of bonafide work done ... I also acknowledge my parents, family and friends for the moral support they ...... For low and medium power applications, square wave and quasi square wave ...
“Transformerless Grid Connected PV System With
Reduced THD” A
Dissertation submitted in partial fulfillment of the requirement for the award of degree of
Master of Technology (Electrical Power System) Submitted To
Sri Satya Sai University of Technology and Medical Sciences, Sehore Submitted by Mistry Abdul Matin (1401182028)
Guided By Prabodh Khampariya Associate Professor Dept. of Electrical Engineering
Approved By Alka Thakur Head of Department Dept. of Electrical Engineering
Department of Electrical Engineering School of Engineering, SSSUTMS Sehore (M.P.) (Approved by All India Council of Technical Education (AICTE)
Sri Satya Sai University of Technology and Medical Sciences, Sehore (Approved by All India Council of Technical Education (AICTE)
CANDIDATE’S DECLARATION
“I Mistry Abdul Matin hereby declare that work presented in this thesis entitled “Transformerless Grid Connected PV System With Reduced THD” submitted to Department of Electrical Engineering, (SoE),SSSUTMS, Sehore (M.P.), towards the fulfillment of M.Tech. IV semester with specialization in Electrical Power System for the exam MARCH 2017 conducted by Sri Satya Sai University of Technology and Medical Sciences, Sehore, (M.P.) is an original & authentic record of work and it has neither been submitted by other nor published anywhere. I further declare that if the statement cited above found false, I will be liable to be disqualified, at any stage.
Student’s Signature Mistry Abdul Matin
Place: Sehore Date: 28/03/2017
1401182028
2
Sri Satya Sai University of Technology and Medical Sciences, Sehore (Approved by All India Council of Technical Education (AICTE)
CANDIDATE’S DECLARATION FOR PLAGIARISM
“I hereby declared that the work, which is being presented in the dissertation, entitled “Transformerless Grid Connected PV System With Reduced THD” partial fulfillment of the requirements for the award of degree of Master of Technology in Electrical Power System submitted in the Department of Electrical Engineering, (SoE),SSSUTMS, Sehore (M.P.), is an authentic record of my own work carried under the guidance of Associate Professor Prabodh Khampariya. I have not submitted the matter embodied in this report for award of any other degree. I also declare that’ “A check for Plagiarism has been carried out on the thesis/project report/dissertation and is found within the acceptable limit and report of which is enclosed herewith.”
Mistry Abdul Matin 1401182028
Director/Registrar Sign. With Seal
3
Sri Satya Sai University of Technology and Medical Sciences, Sehore (Approved by All India Council of Technical Education (AICTE)
CERTIFICATE This is to certify that the project entitled “Transformerless Grid Connected PV System With Reduced THD” submitted by Mistry Abdul Matin towards the fulfillment of M.Tech. IV Sem. with specialization in Electrical Power System submitted in the Department of Electrical Engineering, (SoE), SSSUTMS, Sehore (M.P.), is a record of bonafide work done by him/her under my supervision.
Candidate Name- Mistry Abdul Matin Enrollment No - 1401182028
Guided & approved by : Prabodh Khampariya Associate Professor Electrical Engineering SSSUTMS, Sehore
Prof. Mukesh Tiwari Dean Academics SSSUTMS, Sehore
4
Dr. G.R. Selokar Registrar SSSUTMS,Sehore
Sri Satya Sai University of Technology and Medical Sciences, Sehore (Approved by All India Council of Technical Education (AICTE)
Approval Letter The dissertation work submitted by Mistry Abdul Matin on the Transformerless Grid Connected PV System With Reduced THD is approved for the award of degree of Master of Technology in Electrical Power System submitted in the Department of Electrical Engineering, (SoE),SSSUTMS, Sehore (M.P.).
Internal Name :
External Name :
Date :
Date :
5
ACKNOWLEDGEMENT
I would like to thank my guide Prabodh Khampariya, Associate Professor, Department of Electrical Engineering and Ms. Alka Thakur, Associate Professor and Head of Department Electrical Engineering, SSSUTMS, Sehore (M.P.) for the guidance, supports and ideas they gave during the work.
I also extend my deepest gratitude to Dr. G. R. Selokar, Registrar, SSSUTMS, Sehore for providing all the necessary facilities and true encouraging environment to bring out the best of my endeavors. I am also thankful to Prof. Mukesh Tiwari, Dean Academics, SSSUTMS, Sehore,for the cooperation and support extended to complete this work. I also like to express my gratitude to Mr.Sanjay Rathore, the entire faculty and lab staff/technicians and my friends of SSSUTMS, Sehore (M.P.) for continuous support and help to complete this thesis. I also acknowledge my parents, family and friends for the moral support they extended to me in completion of this thesis work.
Mistry Abdul Matin 1401182028
7
ABSTRACT In this paper, a single-phase, single-stage current source inverter-based photovoltaic system for grid connection is proposed. The maximum power point is maintained with a Perturb & Observe Method, which is simple as view of operation. To connect PV system with grid a transformer is mandatory. To eliminate transformer to make system light and simple a high values inductor is mandatory. To improve the power quality, system efficiency and reduce size of inductor a double-tuned parallel resonant filter is proposed. These also eliminate the second and fourth order harmonics at the inverter dc side. A modified carrierbased pulse width modulation technique for the current source inverter is proposed to magnetize the dc-link inductor by shorting one of the bridge converter legs after every active switching cycle. In this thesis we used PV array of given rating. The output of PV array is connected to Current Source Inverter.CSI consist of Insulated Gate Bipolar Transistor (IGBT) for conversion. The whole system is simulating under two categories. One is simulate with Inductor(Ldc) of high value and second is Low Value of Inductor(Ldc) with Double Tuned Resonant Filter. The proposed system is simulate in MATLAB/SIMULINK 2.22.23 (2016a) software. This software is well known simulation software for the analysis of electrical and electronics circuits. Also we can simulate for Mechanical Systems which is very useful for others. Keywords: Photovoltaic(PV), Maximum Power Point Tracking(MPPT),Double Tuned Resonant Filter, Current Source Inverter(CSI),Total Harmonic Distortion(THD)
8
LIST OF FIGURE Fig. 1 Photovoltaic Cell Structure.............................................................................................15 Fig. 2 P-V Characteristics of PV Cell.......................................................................................16 Fig. 3 Changes in Maximum Power Point................................................................................20 Fig. 4 Two Stage Topology (Type 1)........................................................................................22 Fig. 5 Two Stage Topology (Type 2)........................................................................................23 Fig. 6 Two Stage Topology (Type 3)........................................................................................23 Fig. 7 Single Stage System.......................................................................................................24 Fig. 8 Single Phase Voltage Source Inverter............................................................................26 Fig. 9 Three Phase Voltage Source Inverter.............................................................................27 Fig. 10 Single Phase Current Source Inverter...........................................................................28 Fig. 11 Three Phase Current Source Inverter............................................................................28 Fig. 12 Duty Cycle....................................................................................................................29 Fig. 13 Different strategy of Duty Cycle..................................................................................30 Fig. 14 Pulse Width Modulation...............................................................................................30 Fig. 15 Sinusoidal Pulse Width Modulation (SPWM)..............................................................32 Fig. 16 IGBT Construction.......................................................................................................33 Fig. 17 Equivalent Circuit of IGBT..........................................................................................35 Fig. 18 IGBT Symbol................................................................................................................35 Fig. 19 Ideal Sinusoidal Waveform..........................................................................................36 Fig. 20 Linear Load...................................................................................................................37 Fig. 21 Non Linear Load...........................................................................................................38 Fig. 22 Main Diagram...............................................................................................................39 Fig. 23 Double Tuned Resonant Filter......................................................................................41 Fig. 24 Carrier Based Pulse Width Modulation........................................................................44 Fig. 25 Main Diagram Without use of Double Tuned Resonant Filter.....................................46 Fig. 26 Irradiance......................................................................................................................47 Fig. 27 Grid Current..................................................................................................................47 Fig. 28 Grid Voltage.................................................................................................................48
9
Fig. 29 CSI Output Current.......................................................................................................48 Fig. 30 PV Power......................................................................................................................49 Fig. 31 PV Current....................................................................................................................49 Fig. 32 Grid Active Reactive Power.........................................................................................50 Fig. 33 Main Diagram With use of Double Tuned Resonant Filter..........................................51 Fig. 34 Irradiance......................................................................................................................52 Fig. 35 Grid Current..................................................................................................................52 Fig. 36 Grid Voltage.................................................................................................................53 Fig. 37 CSI Output Current.......................................................................................................53 Fig. 38 PV Power......................................................................................................................54 Fig. 39 PV Current....................................................................................................................54 Fig. 40 Grid Active Reactive Power.........................................................................................55
10
LIST OF TABLES Table 1. Change of state in P & O Method...............................................................................21 Table 2 System Parameters.......................................................................................................45 Table 3 Result Values 1............................................................................................................56 Table 4 Result Values 2............................................................................................................56
11
INDEX 1. Abstract.................................................................................................................................08 2. List of Figure.........................................................................................................................09 3. List of Table..........................................................................................................................11 4. Introduction...........................................................................................................................13 5. Literature Survey...................................................................................................................22 6. Theory...................................................................................................................................25 7. Proposed Methodology.........................................................................................................39 8. Simulation Results................................................................................................................45 9. Conclusion............................................................................................................................57 10. References...........................................................................................................................58 11. List of Publication...............................................................................................................63
12
1. INTRODUCTION 1.1 Necessity of Renewable Energy In India, 300 million i.e. quarter of the country’s population do not have access of electricity. About 70 % energy generation is from fossil fuels. Due to economic expansion, India is going to be second largest in global energy demand by 2035. India is planning to generating 100GW of solar energy by 2022.India achieved a 14.2 % increase in solar power generation from 2013-2015. The energy from the sun is supplied in the form of radiation. The energy is generated in the sun’s core. It is the process of fusion of hydrogen atoms into helium. Now due to the larger distance of sun from the earth only a small portion of sun’s radiation reaches earth’s surface. Hence it is around 1369 watts per square meter [W/m2] which is to be reached at earth's surface. This is known as the solar constant. Now to calculate the total solar radiation intercepted by earth’s surface is finding by multiplying solar constant with the cross section area of the earth. In order to calculate the solar radiation received, on average per square meter of earth’s surface we divide the above multiplied result by the surface area of the earth. Thus the average solar radiation(S) per square meter of earth’s surface is given by [E], R = S*3.14*r2 = 1369 4*3.14*r2
4
= 342 W/m2 (approx.) Where S = solar constant in W/m2 R = Radius of earth
13
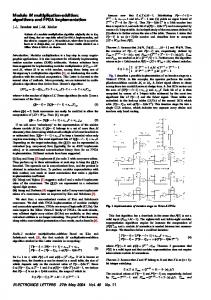
1.2 Photovoltaic Cell 1.2.1 Introduction Based on semiconductor technology, the basic principle of solar cells is given as, that electricity will flow between two semiconductors when they are put into contact with each other and exposed to light (photons). This phenomenon, known as the photovoltaic effect Photovoltaic (PV) technology converts one form of energy (sunlight) into another form of energy (electricity) using no moving parts, consuming no conventional fossil fuels, creating no pollution, and lasting for decades. The use of a widely available and reasonably reliable fuel source, the SUN. PV cell are basically semiconductor diode. The term photovoltaic derived from photovoltaic effect. This semiconductor diode makes p-n junction which is exposed to light. When illuminated by sunlight it generates electric power. PV cell are made up of various semiconductor materials. Such as micro-crystalline, mono-crystalline silicon, poly-crystalline silicon, amorphous silicon, cadmium telluride and copper indium gallium selenide/sulfide. But mono-crystalline silicon and poly-crystalline silicon are mainly used for commercial use. Photoelectric effect can be defined as a phenomenon in which an electron gets ejected from the conduction band as a consequence of the absorption of sunlight of a certain wavelength by the matter(metallic or non-metallic solids, liquids or gases).So, in a photovoltaic cell, whenever sunlight strikes on the surface, some portion of the solar energy is absorbed in the semiconductor material. If absorbed energy is greater than the band gap energy of the semiconductor, the electron from valence band jumps towards the conduction band. By this, pairs of hole-electrons are created in the illuminated region of the semiconductor. The electrons thus created in the conduction band are now free to move. Hence these free electrons are forced to move in a particular direction by the action of electric field present in the PV cells. These flowing electrons result as a current and can be drawn for proper use by connecting a metal plate on top and bottom of PV cell. This current and the voltage (created because of its built-in electric fields) produces required power. Figure 1 shows the internal photovoltaic cell structure.
14
Fig. 1 Photovoltaic Cell Structure
1.2.2 Characteristics of a PV cell In a PV characteristic there are basically three important points i.e. open circuit voltage (Vo), short circuit current (Isc) and maximum power point (IMPP,VMPP). The maximum power that can be extracted from a PV cell are at the maximum power points. Usually manufacturers provide these parameters in their datasheets for a particular PV cell and module also. These parameters use for specific design. By using these parameters we can build a simple model but for more information is required for designing an accurate model. Figure 2 shows the P-V characteristics of PV cell. The Photovoltaic Characteristics is very important parameter. Its indicates performance of photovoltaic Module. The parameters includes Irradiance, Open Circuit Voltage(Ioc), Short Circuit Current(Isc), Maximum Voltage(VMPP), Maximum Current(IMPP), Power, Maximum System Voltage, Tolerance etc. These all are electrical parameters and
15
consider under Standard Test Condition(STC). Standard Test Conditions (STC) considered as irradiance of 1000W/m2, spectrum AM 1.5 and cell temperature of 25°C. There is also Mechanical Parameters including Weight, Cell arrangement, Junction Box(size), Back side Cover Front Cover(Glass) size, Encapsulate Material (Ethylene vinyl acetate- EVA) size etc.
Fig. 2 P-V Characteristics of PV Cell 1.2.3 Photovoltaic Effect The effect due to which light energy is converted to electric energy in certain semiconductor materials is known as photovoltaic effect. This directly converts light energy to electricity without any intermediate process. For understanding the photovoltaic effect let us assume a block of silicon crystal. The upper portion of this block is doped with donor
16
impurities and lower portion is doped with accept or impurities. In result the concentration of free electrons is quite high in n – type region compared to p-type region and concentration of hole is quite high in p-type region compared to n-type region of the block. There will be a high concentration gradient of charge carriers across the junction line of the block. Free electrons from n-type region try to spread over p-type region and holes in p-type region try to spread over n-type region in the crystal. This is because charge carriers by nature always tend to diffuse from high concentration region to low concentration region. Each free electron of ntype region while comes to the p-type region due to diffusion, it leaves a positive donor ion behind it in the n-type region. This is because each of the free electrons in n-type region is contributed by one neutral donor atom. Similarly when a hole is diffused from p-type region to n-type region, it leaves a negative accept or ion behind it in p-type region. Since each hole is contributed by one acceptor atom in p-type region. Both of these ions i.e. donor ions and acceptor ions are immobile and fixed at their position in crystal structure. It is needless to say that those free electrons of n-type region which are nearest to the p-type region first diffuse in the p-type region consequently create a layer of positive immobile donor ions in the n-type region adjacent to the junction. Similarly those free holes of p-type region which are nearest to the n-type region first diffuse in the n-type region consequently create a layer of negative immobile acceptor ions in the p-type region adjacent to the junction. These positive and negative ions concentration layer creates an electric field across the junction which is directed from positive to negative that in from n-type side to ptype side. Now due to presence of this electric field charge carriers in the crystal experience a force to drift according to the direction of this electric field. As we know the positive charge always drift in the direction of electric field hence the positively charged holes (if any) in ntype region now drift to the p-side of the junction. On the other hand, negatively charged electrons in p-type region (if any) drift to nregion as negative charge always drift opposite to the direction of electric field. Across a p-n junction diffusion and drift of charge carriers continues. Diffusion of charge carriers creates and increases the thickness of the potential barrier across the junction and drift of the charge carriers reduces the thickness of the barrier. In normal thermal equilibrium condition and in absence of any external force, the diffusion of charge carrier is equal and opposite of drift of charge carriers hence the thickness of potential barrier remains fixed. Now the n-type surface
17
of the silicon crystal block is exposed to the sunlight. Some of the photons are absorbed by the silicon block. Some of the absorbed photon will have energy greater than the energy gap between valence and conduction band of valence electrons of the silicon atoms. Hence, some of the valence electrons in the covalent bond will be excited and jump out from the bond leaving behind a hole in the bond. In this way electron-hole pairs are generated in the crystal due to incident light. The holes of these light generated electron-hole pairs in the n-type side have enough probability of recombination with enormous electrons (majority carriers). Hence, solar cell is so designed, that the light- generated electrons or holes will not get enough chances to recombine with majority carriers. The semiconductor (silicon) is so doped that the p-n junction forms in very close vicinity of exposed surface of the cell. If an electron hole pair is created within one minority carrier diffusion length, of the junction, the electrons of electron-hole pair will drift toward ntype region and hole of the pair will swept to p region due to in influence of electric field of the junction and hence on the average, it will contribute to current flow in an external circuit.
1.3 Maximum Power Point Tracking The solar panel has a characteristic named p-v characteristic where a global maximum is present. This means that for a different operating point of the solar panel, a different output power is obtained. To achieve the maximum power the solar panel must be operate at the voltage where the global maximum of the p-v characteristic is present. Therefore, only for one specific operating point, the maximum power output is choosing from the solar panel. This point in the p-v characteristic is called the Maximum Power Point (MPP). This MPP changes when the irradiation and temperature changes or when the solar panel is partially shaded in rainy or cloudy season.
1.3.1 MPPT Methods
I. Perturb & Observe method II. Incremental Conductance method III. Fractional Open-Circuit Voltage method IV. Fractional Short-Circuit Current method
18
V. Fuzzy Logic Control method VI. Neural Network method VII. Ripple correlation control (RCC) method VIII. Current Sweep method IX. DC-Link Capacitor Droop Control method X. Load Current or Load Voltage Maximization method XI. dP/dV or dP/dI Feedback Control method
I. Perturb & Observe Method The P&O is the most popular for its low cost, easy to implement, simple structure, and few measured parameters, which are required. It only measures the voltage (V) and current (I) of the PV array. PV system controller changes PV array output with a smaller step in each control cycle. The step size is generally fixed, while mode can be increased or decreased. Both PV array output voltage and output current can be the control object; this process is called “perturbation.” It depends on the fact that the derivative of power with respect to voltage is zero at MPP point. This method fails under rapidly changed atmospheric conditions and has a slow response speed oscillation around the MPP.
In P&O method, the MPPT algorithm is based on the calculation of the PV output power and the power change by sampling both the PV current and voltage. The tracker operates by periodically incrementing or decrementing the solar array voltage. If a given perturbation leads to an increase (decrease) in the output power of the PV, then the subsequent perturbation is generated in the same (opposite) direction. So, the duty cycle of the dc chopper is changed and the process is repeated until the maximum power point has been reached. Actually, the system oscillates about the MPP. Reducing the perturbation step size can minimize the oscillation. However, small step size slows down the MPPT. To solve this problem, a variable perturbation size that gets smaller towards the MPP. However, the P&O method can fail under rapidly changing atmospheric conditions. Several research activities have been carried out to improve the traditional Hill-climbing and P&O methods. Reference proposes a three-point weight comparison P&O method that compares the actual power point to the two preceding points before a decision is made about the perturbation sign. Reference
19
proposes a two stage algorithm that offers faster tracking in the first stage and finer tracking in the second stage.
Fig. 3 Changes in Maximum Power Point
The Figure shows that there is a rapidly changing condition in Maximum Power Point. Starting from an operating point A, if atmospheric conditions stay approximately constant, a perturbation in the PV voltage V will bring the operating point to B and hence the perturbation will be reversed due to a decrease in power. However, if the irradiance increases and shifts the power curve from P1 to P2 within one sampling period, the operating point will be move from A to C and new curve achieved. This represents an increase in power and the perturbation is kept the same. Consequently, the operating point diverges from A to C in above figure and will keep diverging if the irradiance steadily increases. Perturb and observe (PO) is a well known MPPT algorithm because of its balance between performance and simplicity. In its simplest form, the perturb and observe algorithm tracks the
20
MPP by perturbing the input in a given direction and observing if the output power goes up or down. If the power increases, the perturbation direction is unchanged, and if the power decreases, the direction is reversed.
PERTURBATION
CHANGE IN POWER
NEXT PERTURBATION
Positive
Positive
Positive
Positive
Negative
Negative
Negative
Positive
Negative
Negative
Negative
Positive
Table 1. Change of state in P & O Method
From above table we can understand the perturbation. Firstly the perturbation is going towards in positive direction till the MPP. Whenever the change in power is negative, the perturbation in negative direction. Now perturbation is in negative direction, continue till the change in power in negative direction. Then again next perturbation is in Positive direction. Whole process can be easily understand by figure 3.Figure 3 shows the changes in Maximum power point in accordance with irradiance.
21
2. LITERATURE SURVEY A Grid connected PV system generally connect to a grid via two modes, Double Stage and Single Stage. Around 75% of the PV systems installed in the world are grid connected.
2.1 Double Stage System
In Double Stage system, there is a two conversion stages. In this Two Conversion stage, there is also two topologies behind it. one is DC booster to boosting the DC voltage and achieve Maximum DC Voltage. Other Stage for DC to AC conversion by Voltage Source Inverter(VSI).This topology can be seen in Figure 4.
Fig.4 Two Stage Topology(Type 1)
In Other Topology the PV output directly given to Voltage Source Inverter and then given to step-up transformer. This topology can be seen in Figure 5.These methodology eliminate the use of DC-DC Booster. PV Panel output directly given to Voltage Source Inverter, which convert it into Alternating Current(AC).For Required High Voltage, Step-up Transformer is placed.
22
Fig. 5 Two Stage Topology(Type 2)
This System suffer from Losses of transformer and also makes system costly. Fig. 6 shows another configuration and way to use double stage system.
Fig. 6 Two Stage Topology(Type 3)
23
2.2Single Stage System
Fig. 7 Single Stage System Typically, the first stage combines of a boost or buck-boost type dc–dc converter topology and inverter configuration. Because two-stage configurations are time tested (reliable) and work well, but have drawbacks such as bulky system used, lower efficiency, lower reliability, higher cost and larger size. The question is whether it is possible to reduce the number of power processing stages in such systems or using an array with sufficiently large PV voltage. High Value Photovoltaic suffers from hotspot. Another Solution is to use Voltage Source Inverter. But Voltage Source Inverter (VSI).But VSI increases use of Bulky transformer. Further it needs Electrolytic capacitor. So to eliminate these all parameters we focused on single stage transformerless grid connected PV system. Figure 7 shows basic arrangement of single stage system. Hence due to limitation of Voltage Source Inverter(VSI), the researchers are focused on Current Source Inverter(CSI). CSI has some advantages over Voltage Source Inverter. 1. In CSI, the DC input current is achieved as continuous which is for increase reliability of system 2. CSI uses Series inductor instead of shunt electrolytic capacitor, which reduces losses. 3. CSI can be work with low PV Module. This eliminates use of step-up transformer and DC booster
24
3. THEORY 3.1 Inverter 3.1.1 Introduction Inverter word derived from to invert. In general Inverter perform a function to Convert Direct Current(DC) to Alternating Current(AC).It change a dc input voltage to a similar ac output with respect to its desired magnitude and frequency. We can achieve variable ac voltage by varying the input dc voltage and maintaining the gain of inverter to be constant. For an ideal inverter the output ac voltage must be a sinusoidal. But this is not possible practically. The waveforms of practical inverters are nonsinusoidal and contain harmonics. For low and medium power applications, square wave and quasi square wave voltages may be used. But for high power applications, low distorted sinusoidal waveforms are needed. For eliminate this harmonic content of output voltage and to obtain low distorted sinusoidal waveforms we used different switching techniques.
3.1.2 Inverter Types The inverters are broadly classified on the basis semiconductor connection (A)Single Phase Inverters (B) Three Phase Inverters Further inverters are classified on basis of mode of operation (I)Voltage source inverter (VSI) (II)Current source inverter (CSI) I. Voltage Source Inverter (VSI) The inverter in which the input voltage remains constant is termed Voltage Source Inverter. Fig.8 and 9 show the schematic diagrams of a single-phase and a three-phase voltage source inverter respectively. These topologies require only a single dc source and for medium output power applications the preferred devices are n-channel IGBTs. EDC and VS is the input dc supply and a large dc link capacitor (CDC) is put across the supply terminals. Capacitors
25
and switches are connected to dc bus using short leads to minimize the stray inductance between the capacitor and the inverter switches. Needless to say that physical layout of positive and negative bus lines is also important to limit stray inductances. S1, S2, S3 etc. are fast and controllable switches. D1, D2, D3 etc. are fast recovery diodes connected in antiparallel with the switches. ‘A’, ‘B’ and ‘C’ are output terminals of the inverter that get connected to the ac load. A three-phase inverter has three load-phase terminals whereas a single-phase inverter has only one pair of load terminals.
Fig. 8 Single Phase Voltage Source Inverter
26
Fig. 9 Three Phase Voltage Source Inverter
There is some limitation to use voltage source inverter. It has low voltage boosting capability as compare to Current source inverter. This may create problem while interfacing to the grid.VSI limits for only stand alone system for low voltage & medium voltage system.VSI uses shunt electrolytic capacitor which is critical point of failure. Current is not to be constant or continuous because of voltage is made to be constant in voltage source inverter.
II. Current Source Inverter (CSI) The inverter in which the input current remains constant is termed as Current Source Inverter. In other words the input behaves as current source. The output current is maintained constant irrespective of load on the inverter and output voltage is forced to change. Figure 10 and 11 shows the single phase and three phased Current Source Inverter configuration respectively.
27
Fig. 10 Single Phase Current Source Inverter
Fig. 11 Three Phase Current Source Inverter
Generally nowadays Insulated Gate Bipolar Transistor (IGBT) is used for Inverter. Due to reach devices conduct for 120.Also at any instant only two thyristors are conduct at a time. 28
3.2 Pulse Width Modulation Pulse Width Modulation is basically defined by the process of modifying the width of pulses in pulse train which is direct proportional to small control signal. In which to achieve wider resulting pulse we increase the value of control voltage. Pulse Width Modulation (PWM) is a method for changing how long a square wave stays “ON”. In this method, sine wave reference signal and triangular carrier signal is used. 3.2.1 Duty Cycle
In general terms, the Duty Cycle is state as the ON time of modulated signal. In other words it is measure of high state in modulated signal. It is generally measured in percentage. Figure shows the ON OFF configuration and duty cycle. Figure 12 shows the TON and TOFF of cycle. In which TON time is termed as duty cycle. Duty Cycle can be determined by,
The duty cycle is generally presented as 50, 75 and 25%.These are presented in figure 13.
Fig. 12 Duty Cycle 29
Fig. 13 Different strategy of Duty Cycle
3.2.2 Basic Principle of PWM
Fig. 14 Pulse Width Modulation
30
Figure 14 shows the basic principle of pulse width modulation. Here one comparator is used. Two input signal is applied. One is Modulating signal, which is sine wave. Second is carrier signal, which is triangular wave, In results the pulse width modulated signal is achieved.
3.2.3 Sinusoidal Pulse Width Modulation (SPWM) Sinusoidal Pulse Width Modulation (SPWM) technique has been used for controlling the inverter as it can be directly controlled the inverter output voltage and output frequency according to the sine functions. Sinusoidal pulse width modulation (SPWM) is widely used in power electronics to digitize the power so that a sequence of voltage pulses can be generated by the on and off of the power switches. The PWM inverter has been the main choice in power electronic for decades, because of its circuit simplicity and rugged control scheme. Sinusoidal Pulse Width Modulation switching technique is commonly used in industrial applications or solar electric vehicle applications.
SPWM techniques are characterized by constant amplitude pulses with different duty cycles for each period. The width of these pulses are modulated to obtain inverter output voltage control and to reduce its harmonic content. Sinusoidal pulse width modulation is the mostly used method in motor control and inverter application. In SPWM technique three sine waves and a high frequency triangular carrier wave are used to generate PWM signal. Generally, three sinusoidal waves are used for three phase inverter. The sinusoidal waves are called reference signal and they have 1200 phase difference with each other. The frequency of these sinusoidal waves is chosen based on the required inverter output frequency (50/60 Hz). The carrier triangular wave is usually a high frequency (in several KHz) wave. The switching signal is generated by comparing the sinusoidal waves with the triangular wave. The comparator gives out a pulse when sine voltage is greater than the triangular voltage and this pulse is used to trigger the respective inverter switches. In order to avoid undefined switching states and undefined AC output line voltages in the VSI, the switches of any leg in the inverter cannot be switched off simultaneously. The phase outputs are mutually phase shifted by 1200 angles. The ratio between the triangular wave & sine wave must be an integer N, the
31
number of voltage pulses per half-cycle, such that, 2N= fc/fs. Conventional SPWM signal generation technique for three phase voltage source inverter is shown in Figure 15.
Fig. 15 Sinusoidal Pulse Width Modulation (SPWM)
32
3.3 Insulated Gate Bipolar Transistor(IGBT)
Fig. 16 IGBT Construction The insulated gate bipolar transistor (IGBT), which was introduced in early 1980s, is becoming a well known device because of its extreme characteristics. IGBT is a threeterminal power semiconductor device used to control the electrical energy. Many new applications would not be economically feasible without IGBTs. In other words some instruments can't develop without use of IGBT. Before development of IGBT, power bipolar junction transistors (BJT) and power metal oxide field effect transistors (MOSFET) were widely used in low to medium power and high-frequency applications, where the speed of gate turn-off thyristors was not better for use. Power BJTs have good on-state characteristics but have long switching times especially at turn-off. They are current-controlled devices with small current gain because of high-level injection effects and wide base width required to prevent reach-through breakdown for high blocking voltage capability. Therefore, they require complex base drive circuits to provide the base current during on-state, which
33
increases the power loss in the control electrode. On the other hand power MOSFETs are voltage-controlled devices, which require very small current during switching period and hence have simple gate drive requirements. Power MOSFETs are majority carrier devices, which exhibit very high switching speeds. But the unipolar nature of the power MOSFETs causes inferior conduction characteristics as the voltage rating is increased above 200V. Therefore their on state resistance increases with increasing breakdown voltage. Furthermore, as the voltage rating increases the inherent body diode shows inferior reverse recovery characteristics, which leads to higher switching losses. In order to improve the power device performance, it is advantageous to have the low on-state resistance of power BJTs with an insulated gate input like that of a power MOSFET. The Darlington configurations of the two devices have superior characteristics as compared to the two discrete devices. This hybrid device could be gated like a power MOSFET with low on-state resistance because the majority of the output current is handled by the BJT. Because of the low current gain of BJT, a MOSFET of equal size is required as a driver. A more powerful approach to obtain the maximum benefits of the MOS gate control and bipolar current conduction is to integrate the physics of MOSFET and BJT within the same semiconductor region. This concept gave rise to the commercially available IGBTs with superior on-state characteristics, good switching speed and excellent safe operating area. Compared to power MOSFETs the absence of the integral body diode can be considered as an advantage or disadvantage depending on the switching speed and current requirements. An external fast recovery diode or a diode in the same package significantly reduced if all issues of device performance and reliability are taken into consideration at the design stage. As high stress conditions are quite frequent in circuit applications, it is extremely cost efficient and pertinent to model the IGBT performance under these conditions. However, development of the model can follow only after the physics of device operation under stress conditions imposed by the circuit is properly understood. Physically based process and device simulations are a quick and cheap way of optimizing the IGBT. The emergence of mixed mode circuit simulators in which semiconductor carrier dynamics is optimized within the constraints of circuit level switching is a key design tool for this task. Figure 16 shows the construction detail of IGBT. Figure 17 and 18 shows thee equivalent circuit and symbol of IGBT.
34
Fig. 17 Equivalent Circuit of IGBT
Fig. 18 IGBT Symbol
35
3.4 Total Harmonic Distortion (THD) Harmonic distortion is the change in the waveform of the supply voltage from the ideal sinusoidal waveform. It is caused by the interaction of distorting loads with the impedance of the supply network. Its major adverse effects are the heating of induction motors, transformers and capacitors and the many other types of loads. Also it causes overloading of neutrals. Figure 19 Ideal sinusoidal waveform of alternating current supply.
Fig. 19 Ideal Sinusoidal Waveform 3.4.1 Linear Load A “linear” load connected to an electric power system is defined as a load which draws current from the supply which is proportional to the applied voltage (for example, resistive, incandescent lamps etc). An example of a voltage and current waveforms of a linear load is shown in Figure 20. In Linear Load, the voltage and current waveforms are sinusoidal and in phase.
36
Fig. 20 Linear Load
3.4.2 Non Linear Load A load is considered “non-linear” if its impedance changes with the applied voltage. Due to this changing impedance, the current drawn by the non-linear load is also non-linear i.e. non-sinusoidal in nature, even when it is connected to a sinusoidal voltage source (for example computers, variable frequency drives, discharge lighting etc). An example of a voltage and current waveforms of a non-linear load is shown in Figure 21. In Non-Linear loads, the voltage and current waveforms are not sinusoidal and not in phase. These non sinusoidal currents contain harmonic currents that interact with the impedance of the power distribution system to create voltage distortion that can affect both the distribution system equipment and the loads connected to it.
37
Fig. 21 Non Linear Load
Total Harmonics Distortion (THD) The amount of distortion in the voltage or current waveform is quantified by means of an index called the total harmonic distortion (THD). According to IEEE 519-1992, it is defined as a ratio of the root-mean-square of the harmonic content to the root-mean-square value of the fundamental quantity and expressed as a percent of the fundamental. Total harmonic distortion, or THD, is the summation of all harmonic components of the voltage or current waveform compared against the fundamental component of the voltage Or current wave:
The formula above shows the calculation for THD on a voltage signal. The end result is a percentage comparing the harmonic components to the fundamental component of a signal. The higher the percentage, the more distortion that is present on the mains signal.
38
4. PROPOSED METHODOLOGY In previous section, to connect PV system to grid some topologies are presented. But due to their limitation like bulky transformer and high value inductor and disadvantages of double stage system we introduced the following system. Here, We simulate the system in two sections. In first section we interface the PV system with the grid with use of high value inductance of 300 mH. The system can be simplified by figure 22. In second section we interface the PV system with grid with use of double tuned resonant filter and low value inductance. Simulation results are tabulated and compared. 10 series connected 50 W rated PV module are used in this system. Other system parameters are as per the table 2.
Fig. 22 Main Diagram
39
4.1Double Tuned Resonant Filter
4.1.1 Introduction
In a single-phase Current Source Inverter (CSI),the output is not pure sinusoidal. It is Pulsating. It generates even harmonics in the dc-link current. These even harmonics has two major effect. One is on the ac side as low-order odd harmonics in the current and voltage. Second these even harmonics affect Maximum Power Point Tracker (MPPT) on PV side. This may be reduce Photovoltaic (PV) life. In order to reduce the effect of these dc-side harmonics on the ac side and on the PV. There is a two solution proposed. One is to use the large value inductance must used. These large value inductance is capable reduce the dc-link current ripple produced by these harmonics. Here we used the inductor of value 300mH.But practically this large value inductance is not possible. Because it added cost, size, weight & may be losses also. Another major effect is that is slow the MPPT output response. To overcome this, the second solution may be useful. Second To reduce the value of large inductor, a double tuned parallel resonant filter is introduced. This Double Tuned Resonant Filter, generally placed in series with the inductor of low value. This filter is capable of smoothing the dc-link current by using small inductor. Even though the impact of the second-order harmonic is significant in the dc-link current, the fourth-order harmonic can also affect the dc-link current, especially when the Current Source Inverter(CSI) operates at high modulation indices. The basic of Double Tuned Resonant Filter is shown in figure 23.
40
Fig. 23 Double Tuned Resonant Filter Filter has been widely used in filtering harmonics in power system due to its simple structure, low cost, high reliability, and so on. Usually, there are multiple frequency harmonics in a power system, so a group of parallel single tuned filters are needed to filter harmonics. This filtering method covers a large area and has a high cost. There is a two method for use this filter. One is use two parallel single tuned filters and second is double tuned filters. Doubletuned filter and two parallel single tuned filters have the same function that both of them can filter two different frequency harmonics. However, double-tuned filter has a lower cost than the two parallel single tuned filters.
4.1.2 Design of Double Tuned Resonant Filter In this section, the design parameters of filter has been discussed. Firstly to eliminate the desired harmonics, the impedance of C1 and the total impedance of L1, L2 , and C2
41
should have equal values of opposite sign. For simplification, assume component resistances are small, and thus negligible for calculation purpose.
Now, Zc1 + Zt = 0
(1)
Capacitances are given by,
Here,C1 and C2 are the resonant filter capacitances, L1 and L2 are the resonant filter inductances, ZC1 is C1 impedance, Zt is the total impedance of L1, L2 , and C2 respectively. ω is the angular frequency of the second or fourth-orders harmonics.(whatever we consider).By solving Equation (2) and (3),we can obtain the value of capacitances. The filter is capable of eliminating both the second and fourth order harmonics.
Now, to obtain the value of inductances L1 and L2,we can get values as L2 ≤ 1.778L1
(4)
4.2Carrier Based Pulse Width Modulation (CPWM) Due to some limitation of Sinusoidal Pulse Width Modulation, the Modified Carrier Based Pulse Width Modulation is introduced. In Sinusoidal Pulse Width Modulation the pulses nearer the peak of sine wave do not change significantly with the variation of modulation index. Second thing that the carrier 42
signal is applied to whole cycle. Its increases no. of switching devices and also increases switching losses. To overcome above situation Carrier based Pulse Width Modulation is presented. Its provides continuous path for the dc side current. There is one switch either in top or bottom must be ON during every switching period. This can be also achieved in Sinusoidal Pulse Width Modulation (SPWM). In SPWM, due to overlap time. It allows continuous path for dc side current. Overlap time is occurring when power devices change it states. This overlap time is not sufficient for energizing dc link inductor. This may be result in increasing Total Harmonic Distortion (THD). So the Carrier Based sinusoidal Pulse Width Modulation (CBPWM) is presented. Here two carriers and one reference is used. In this carrier wave is applied during the first and last 60º intervals per half cycle. i.e. 0º to 60º and 120º to 180º.This is similarly done for negative half cycle. The carrier signal and reference signal of Carrier based Pulse width modulation is illustrate in figure 24.
43
Fig. 24 Carrier Based Pulse Width Modulation
44
5. SIMULATION RESULTS Simulation is done in two modes. One is With use of Double Tuned Resonant Filter and Second is Without use of Double Tuned Resonant Filter.
5.1 System Parameters PV Open Circuit Voltage
80 V
PV Short Circuit Current
8A
PV Array Rated Power
500 W
LDC (With Filter)
5 mH
LDC (Without Filter)
300 mH
Carrier Frequency
3.5 KHz
L1
10 mH
L2
5 mH
C1
250 µF
C2
125 µF
AC Side Inductor L1
50 mH
AC Side Inductor L2
50 mH
AC Side Capacitor
250 µF
Table 2 System Parameters 45
5.2 Without use of Double Tuned Resonant Filter I. Main Diagram
Fig. 25 Main Diagram without use of Double Tuned Resonant Filter Above figure shows the simulation with high value inductor of 300 mH used.
46
II. Irradiance
Fig. 26 Irradiance
III. Grid Current
Fig. 27 Grid Current
47
IV. Grid Voltage
Fig. 28 Grid Voltage V. Current Source Inverter Current
Fig. 29 CSI Output Current
48
VI. PV Power
Fig. 30 PV Power VII. PV Current
Fig. 31 PV Current
49
VIII. Grid Active Reactive Power
Fig. 32 Grid Active Reactive Power
50
5.3 With use of Double Tuned Resonant Filter
I. Main Diagram
Fig. 33 Main Diagram with use of Double Tuned Resonant Filter Above figure shows the simulation with the use of double tuned resonant filter
51
II. Irradiance
Fig. 34 Irradiance III. Grid Current
Fig. 35 Grid Current
52
IV. Grid Voltage
Fig. 36 Grid Voltage V. Current Source Inverter Current
Fig. 37 CSI Output Current
53
VI. PV Power
Fig. 38 PV Power VII. PV Current
Fig. 39 PV Current
54
VIII. Grid Active Reactive Power
Fig. 40 Grid Active Reactive Power
55
5.3 Result Values I. With Filter
Parameter
RMS
Irradiance
1000
Inverter Current
35.71
Grid Voltage
107.1
Grid Current
33.52
Active Power
676.6
Reactive Power
104.7
THD
1.73
PDC
488.6 Table 3 Result Values 1
II. Without Filter Parameter
RMS
Irradiance
1000
Inverter Current
22.83
Grid Voltage
84.85
Grid Current
25.54
Active Power
622.9
Reactive Power
50.35
THD
1.86
PDC
488.5
Table 4 Result Values 2 56
6. CONCLUSION This thesis present a grid connected PV system without use of transformer. The required power for grid is achieved and can be send to grid without use of transformer. The MPPT successfully locks desired voltage at Maximum Power Point. The system uses current source inverter which is further drive by carrier based pulse width modulation. The High value inductor ca be reduced by double tuned resonant filter. Resonant filter also eliminated harmonics. The Total Harmonic Distortion with Inductor is 1.86 and with Double tuned resonant filter 1.73. Other Parameters near about same with both configuration i.e. with use of resonant filter and without use of resonant filter. All results are simulated in MATLAB/SIMULINK.
57
7. REFERENCES 1.PV cell basic A Thesis titled “Modeling of Photovoltaic array” in Department of Electrical Engineering In National Institute of Technology, Rourkela 2.A Necessity of Hybrid AC/DC Micro grids in Indian Electricity Sector, Dr. Mrs G A Vaidya, Prof. Mrs Kalyani M Kurundkar, Electrical India Magazine Volume 56 No 1 January 2016 3. A Thesis Title “Maximum Power Point Tracking Algorithm and Software Development” Delft University of Technology Faculty of EEMCS June 27, 2012, Stefan Moring, Anton Pols, Dr. J. Popovic 4.A Literature titled “Moving Toward A Cleaner Future” by Dinesh Dhut, Electrical India Magazine Volume 55 No 11 November 2015 5.electrical4u.com 6. A review study of photovoltaic array maximum power tracking algorithms by Hala J. El‑Khozondar , Rifa J. El‑Khozondar, Khaled Matter and Teuvo Suntio in Renewables : Wind, Water & Solar in springer open journal 7.A Paper titled "A new Maximum Power Point Tracking for Photovoltaic Systems" presented in International Journal of Electrical & Electronics Engineering by Mohamed Azab date 3:11 2009 8. Maximum Power Point Tracking for Photovoltaic Optimization Using Ripple-Based Extremum Seeking Control Steven in IEEE Transactions on Power Electronics, , Vol. 25, No. 10, OCTOBER 2010 by Steven L. Brunton1, Clarence W. Rowley, Sanjeev R. Kulkarni, and Charles Clarkson page no. 2531 to 2540 9. Review Article on Analysis of a Three Phase Grid-Connected PV Power System using a Modified Dual-Stage Inverter by Denizar Cruz Martins ISRN Renewable Energy Volume 2013,Article ID 406312,18 pages http://dx.doi.org/10.1155/2013/406312, Hindawi Publishing Corporation 10. Single Phase single stage transformer less Grid connected PV system by G.M.Kulkarni, Prof.S.S.Khule Matoshri College of Engineering & Research Centre in Spvryan’s International Journal of Engineering Sciences & Technology (SEST) ISSN : 2394-0905
58
11. Bader N. Alajmi, Khaled H. Ahmed, Grain Philip Adam, and Barry W. Williams,” Single-Phase Single-Stage Transformer less Grid-Connected PV System”, IEEE Transactions On Power Electronics, Vol. 28, No. 6, June 2013 12. M. G. Villalva, J. R. Gazoli, and E. R. Filho, “Comprehensive approach to modeling and simulation of photovoltaic arrays,” IEEE Transaction on Power Electronics, vol. 24, no. 5, pp. 1198–1208, May 2009. 13. S. Dasgupta, S. K. Sahoo, S. K. Panda, and G. A. J. Amaratunga, “Single phase invertercontrol techniques for interfacing renewable energy sources with microgrid—Part II: Seriesconnected inverter topology to mitigate voltage-related problems along with active power flow control,” IEEE Transaction on Power Electronics, vol. 26, no. 3, pp. 732–746, Mar. 2011. 14. B. N. Alajmi, K. H. Ahmed, S. J. Finney, and B. W. Williams, “Fuzzy logic control approach of a modified hill-climbing method for maximum power point in microgrid standalone photovoltaic system,” IEEE Transaction on Power Electronics, vol. 26, no. 4, pp. 1022–1030, Apr. 2011. 15. Y. Bo, L.Wuhua, Z. Yi, and H. Xiangning, “Design and analysis of a grid connected photovoltaic power system,” IEEE Transaction on Power Electronics, vol. 25, no. 4, pp. 992– 1000, Apr. 2010. 16. W. Tsai-Fu, C. Chih-Hao, L. Li-Chiun, and K. Chia-Ling, “Power loss comparison of single- and two-stage grid-connected photovoltaic systems,” IEEE Transaction on Energy Conversion, vol. 26, no. 2, pp. 707–715, Jun.2011. 17. S. B. Kjaer, J. K. Pedersen, and F. Blaabjerg, “A review of single-phase grid-connected inverters for photovoltaic modules,” IEEE Trans. Ind. Appl., vol. 41, no. 5, pp. 1292–1306, Sep.–Oct. 2005. 18. G. Petrone, G. Spagnuolo, and M. Vitelli, “A multivariable perturb and observe maximum power point tracking technique applied to a single-stage photovoltaic inverter,” IEEE Trans. Ind. Electron., vol. 58, no. 1, pp. 76–84, Jan. 2011. 19. E. Villanueva, P. Correa, J. Rodriguez, and M. Pacas, “Control of a single phase cascaded H-bridge multilevel inverter for grid-connected photovoltaic systems,” IEEE Trans. Ind. Electron., vol. 56, no. 11, pp. 4399–4406, Nov. 2009.
59
20. C. Cecati, F. Ciancetta, and P. Siano, “A multilevel inverter for photovoltaic systems with fuzzy logic control,” IEEE Trans. Ind. Electron., vol. 57,no. 12, pp. 4115–4125, Dec. 2010. 21. S. Busquets-Monge, J. Rocabert, P. Rodriguez, S. Alepuz, and J. Bordonau, “Multilevel diode-clamped converter for photovoltaic generators with independent voltage control of each solar array,” IEEE Trans. Ind. Electron., vol. 55, no. 7, pp. 2713–2723, Jul. 2008. 22. N. A. Rahim, K. Chaniago, and J. Selvaraj, “Single-phase seven-level grid connected inverter for photovoltaic system,” IEEE Trans. Ind. Electron., vol. 58, no. 6, pp. 2435–2443, Jun. 2011. 23. B. Sahan, S. V. Ara´ujo, C. N¨oding, and P. Zacharias, “Comparative evaluation of threephase current source inverters for grid interfacing of distributed and renewable energy systems,” IEEE Trans. Power Electron., vol. 26, no. 8, pp. 2304–2318, Aug. 2011. 24. B. Sahan, A.N. Vergara, N. Henze,A. Engler and P. Zacharias, “A single stage PV module integrated power converter based on a low power current source inverter”, IEEE Transaction on Industrial electronics, vol.55 no.7,pp 2602-2609,Jul-2008. 25. P. P. Dash and M.Kazerani, “Dynamic modeling and performance analysis of a gridconnected current-source inverter-based photovoltaic system, ”IEEE Trans. Sustainable Energy, vol. 2, no. 4, pp. 443–450, Oct. 2011. 26. S. Jain and V. Agarwal, “A single-stage grid connected inverter topology for solar PV systems with maximum power point tracking,” IEEE Trans. Power Electron., vol. 22, no. 5, pp. 1928–1940, Sep. 2007. 27. A. Darwish, A. K. Abdelsalam, A. M. Massoud, and S. Ahmed, “Single phase grid connected curent source inverter: Mitigation of oscillating power effect on the grid current,” in Proc. IET Conf. Renewable Power Generation, Sep. 2011, pp. 1–7. 28. R. T. H. Li, H. S.-H. Chung, and T. K. M. Chan, “An active modulation technique for single-phase grid-connected CSI,” IEEE Trans. Power Electron., vol. 22, no. 4, pp. 1373– 1382, Jul. 2007. 29. Katsuya Hirachi and Yasuharu Tomokuni, “A novel control strategy on single-phase PWM current source inverter incorporating pulse area modulation,” Proceedings of Power Conversion Conf., vol. 1, pp. 289–294, Aug. 1997. 30. S. Nonaka, “A suitable single-phase PWM current source inverter for utility connected residential PV system,” Sol. Energy Mater. Sol. Cells, vol. 35, pp. 437–444, Sep. 1994.
60
31. T. Esram, and Patrick L. C., “Comparison of Photovoltaic Array Maximum Power Point Tracking Techniques”, IEEE Trans. On Energy Conv., Vol. 22, No. 2, JUNE 2007 Pp 439449 32.Chapter 6 Pulse Width Modulated Inverters and Chapter 8 Resonance Pulse Inverters and Chapter 4 Power transistor in Power Electronics Circuits, Devices and Applications By Muhammad H. Rashid Third Edition, PEARSON ©2014 Dorling Kindersley Pvt. Ltd. 33.Chapter 3 Static VAR Compensator and Chapter 14B Pulse Width Modulation for Voltage Source Converters in FACTS Controllers In Power Transmission And Distribution By K R Padiyar, New Age International (P) Limited, Publishers 34.Lesson 33 Introduction to Voltage Source Inverters in Module 5 DC to AC Converters Version 2 EE IIT Kharagpur 35.Chapter 5 Insulated Gate Bipolar Transistor in Power Electronics Handbook Third edition, Muhammad H Rashid, Elsevier Inc. 36. A Power Point Presentation on Pulse Width Modulation by zak ahmad, Phuc Dao and Joel Toussaint. 37. A paper Titled "Simulation Development of Carrier based Pulse Width Modulation for Cascaded Multilevel Inverter" presented in Department of Electrical Engineering University of Jember by Bambang Sujanarko in International Journal of Computer Applications 0975 – 8887 Volume 104 – No.5, October 2014 38. Photovoltaic Parameters SS 3 to 30 series Polycrystalline Photovoltaic Module, Sonali Solar Private Limited, http://sonalisolar.com/3-30-12v-series.php 39. Harmonic distortion in electric supply system, Technical note no.3, March 2000 Asso. Pro. V J Gosbell, Technical Director of Integral energy power quality centre, school of electrical, computer and telecommunications engineering, university of Wollongong, NSW Australia 2522 40. Harmonics in power systems Causes, effects and control Siemens Industry, Inc. 5300 Triangle Parkway, Suite 100 Norcross, GA 30092, 2013 usa.siemens.com 41. MIRUS International Inc. 6805 Invader Cres., Unit #12, Mississauga, Ontario, Canada L5T 2K6 Harmonic Mitigating Transformers Frequently Asked Questions 42. Total Harmonic Distortion and Effects in Electrical Power Systems, Associated Power Technologies apt
61
43. Sinusoidal PWM Signal Generation Technique for Three Phase Voltage Source Inverter with Analog Circuit & Simulation of PWM Inverter for Standalone Load & Micro-grid System in International Journal Of Renewable Energy Research Vol.3, No.3 by Nazmul Islam Raju, Md. Shahinur Islam, Ahmed Ahsan Uddin International University,Bangladesh
62
in Department of EEE, American
8. LIST OF PUBLICATION 1. A Paper Titled "Single-Stage Grid Connected PV System" published in Volume 3, Issue 9, May-2016 of International Journal For Technological Research In Engineering(IJTRE), ISSN (Online): 2347 - 4718 Page No. 2444 to 2447 2. A Paper Titled "Grid Connected PV System by Single Stage" published in Vol. 5, Issue 6, June 2016 of International Journal of Advanced Research in Electrical, Electronics and Instrumentation Engineering (IJAREEIE), ISSN (Print) : 2320 – 3765, ISSN (Online): 2278 – 8875, Page No. 5046 to 5053 3. A Paper Titled "Grid Connected PV System with CSI" published in Volume 3 Issue 7, July 2016 of International Journal of Emerging Technologies and Engineering (IJETE), ISSN 2348 – 8050, Page No. 58 to 61
63