Proceedings of PAC07, Albuquerque, New Mexico, USA
FRPMS047
DESIGN AND IMPLEMENTATION OF AN ELECTRON AND POSITRON MULTIBUNCH TURN-BY-TURN VERTICAL BEAM PROFILE MONITOR IN CESR* M. Palmer#, J. Dobbins, D. Hartill, C. Strohman, E. Tanke, Cornell Laboratory for AcceleratorBased Sciences and Education, Ithaca, NY, 14853, USA R. Holtzapple, B. Cerio, J. Kern, Dept. of Physics, Alfred University, Alfred, NY 14802, USA M. Watkins, Carnegie Mellon University, Pittsburgh, PA 15213, USA Abstract Two fast vertical beam profile monitors have been implemented at the Cornell Electron Storage Ring (CESR); one is dedicated to electrons, the other to positrons. They are being used to probe a range of single bunch and multi-bunch beam dynamics issues as well as machine stability issues. Readout is based on the Hamamatsu H7260K multi-anode photomultiplier [1]. This device has a 32 channel linear anode array with 1 mm channel pitch and sub-nanosecond rise time. A custom 72 MHz digitizer unit allows synchronous multibunch and turn-by-turn data acquisition of the 14 ns spaced bunches in CESR. An on-board digital signal processor provides local data processing capability. This paper describes the profile monitor hardware, data acquisition system, and data analysis software.
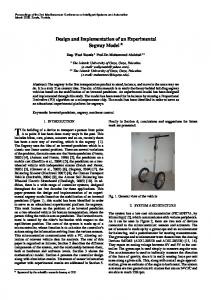
OPTICS FOR THE BEAM SIZE MONITOR There are two nearly identical optical synchrotron radiation beam size monitor systems in CESR, one for positrons and one for electrons (figure 1). Their optics consists of a primary flat Beryllium mirror at 45 degrees mounted in the CESR vacuum chamber that reflects the synchrotron light out through a quartz window on the opposite side of the vacuum chamber. After exiting the quartz window, the light passes through an UV filter and enters a vertical periscope made of two remotely controllable first surface mirrors to translate it down to the optics box contained in the magnet stand underneath the beam line. The light enters the optics box through a 10mm wide horizontal slit to limit its horizontal size and strikes a 445mm focal length parabolic mirror off axis.
INTRODUCTION CESR presently operates at two different beam energies, at high energy (E=5GeV) for synchrotron radiation production at the Cornell High Energy Synchrotron Radiation Source (CHESS), and at low energy (E=2GeV) for high energy physics at the CLEO-c detector. Future plans are to turn CESR into a test accelerator (CesrTA) dedicated to research and development for the International Linear Collider (ILC) Damping Rings[2]. At both operating energies, counter rotating beams of electrons and positrons are present in the same CESR vacuum chamber. Vertical and horizontal separators electrostatically separate the e-/e+ bunches into a closed pretzel orbit such that they only collide in CLEO-c. Under these operating conditions several effects, such as beambeam interaction and parasitic crossing, may be present and need to be quantified on a bunch-by-bunch, turn-byturn basis. This has been achieved in the vertical plane by the installation of a e+/e- vertical profile monitor in CESR. The vertical beam size monitor consists of a Hamamatsu H7260K 32-channel linear photomultiplier tube (PMT) array. It is the visible light produced by the circulating bunches reaching the PMT array that is used to measure the vertical profile of individual e+/e- bunches on a turn-by-turn basis.
Figure 1. The optics transport line for the synchrotron radiation beam size monitor (CCD camera) and PMT array. The light is then directed back to a first surface flat mirror that reflects the light into a remotely controlled moveable eyepiece lens with a focal length of 63mm to focus the beam image onto the 2048 element linear CCD. The optical system images the beam at a location approximately 3 meters inside the adjacent bend magnet. The resolution of the system is limited to around 150µm by a combination of diffraction and depth of field. The
______________________________________________________________ * This work is supported by the National Science Foundation and a National Science Foundation CAREER grant. # E-mail:
[email protected]
06 Instrumentation, Controls, Feedback & Operational Aspects
c 1-4244-0917-9/07/$25.00 2007 IEEE
T03 Beam Diagnostics and Instrumentation
4081
FRPMS047
Proceedings of PAC07, Albuquerque, New Mexico, USA
overall magnification is 0.95 for the electron system and 0.89 for the positron system with the current operating parameters. A beam splitter in the optical path after the eyepiece sends a second beam into a second optical system. In this second system another splitter causes one beam to pass through an expander lens and two flat mirrors such as to give sufficient vertical resolution on the PMT. The magnification, which is of the order of a factor 10, can be adjusted by moving the expander lens. The shutter in this line is operated by the data acquisition software. Its purpose is to allow sufficient light through to the PMT for turn-by-turn measurements of all bunches. The other beam goes to a screen that is viewed by a conventional video camera in order to provide visual feedback to the operator.
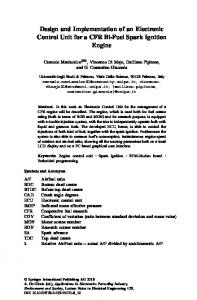
Figure 2 is a vertical bunch distribution for a e+ and an ebunch. The bunch distribution is χ 2 fit to a Gaussian distribution with a quadratic background given by x -B 2 yi -Aexp - i -D-Ex i -Fx i2 2C 32 χ 2 =∑ (1) σi2 i=1 where the fit variables are the peak (A), mean position (B), and width (C) of the Gaussian distribution. In addition, the background has fit variables and in figure 1 they are: flat background (D), linear background (E), and quadratic background (F). The data is weighted by σi =A yi where A is the amplification of the PMT array and yi is the amplitude of the signal.
PMT READOUT ELECTRONICS The readout electronics, described in detail in [3], consists of a digital motherboard, on which a Xilinx Virtex-2 field programmable gate array (FPGA) and an Analog Devices TS101 digital signal processor (DSP) are mounted. Four analog boards, a timing board, and an I/O transition board are plugged into the motherboard. Another board, monitoring the channel by channel and total PMT current, will switch off the high voltage supplied to the PMT in case of over-current. The sub-nanosecond rise time of the PMT allows for digitization of the signal on a bunch-by-bunch basis. The 72 MHz digitization of the PMT signal on the analog boards allows to capture the signals of bunches 14 ns apart (this is the standard bunch spacing in CESR). The on-board data-buffering is sufficient to accommodate 10k turns (or ~25.6 ms) of data from 45 parallel-sampled bunches. The DSP software controls the shutter and PMT high voltage. It also provides various on-board pre-processing capabilities of the raw data before transfer to the CESR Control System. Ultimately the PMT array readout system electronics must be able to distinguish between bunches that are separated by 4 ns in order to be compatible with the planned CesrTA operation. As a first step in this direction, tests are currently being performed on analog boards with faster front end filters.
DATA ANALYSIS A data analysis software package has been written in MatLab to analyze the vertical distributions of the beam profile from the PMT [4]. The software package takes the 32 channel vertical profile and (i) fits the vertical profile to a function to determine its position and width, (ii) plots the position and width on a turn-by-turn basis, (iii) and does an FFT of vertical beam size or position to determine its frequency of oscillation. Below are results from the data analysis software from PMT measurements made during CHESS operation. 06 Instrumentation, Controls, Feedback & Operational Aspects
4082
Figure 2. A single turn vertical bunch distribution of (a) electrons and (b) positrons fit to a Gaussian distribution with a quadratic background. The goodness of fit to the fit function is determined by the χ 2 test. A histogram of χ 2 divided by the number of degrees of freedom (NDF) is shown in figure 3 for a single bunch of electrons. For electron bunches fit to a Gaussian distribution with a curved background we have whereas positron bunches have χ 2 / NDF ~ 1
χ 2 / NDF ~ 2 due to light reflections in the beam optics line.
T03 Beam Diagnostics and Instrumentation
c 1-4244-0917-9/07/$25.00 2007 IEEE
Proceedings of PAC07, Albuquerque, New Mexico, USA
FRPMS047
bunches per train during CHESS operation. The dominant oscillation frequency in both cases is at the vertical tune which varies along the train.
Figure 3. A histogram of χ 2 / NDF for a single bunch of electrons when fit to a Gaussian distribution with a quadratic background. The capability to make turn-by-turn measurements of the vertical beam size and position makes it possible to quantify the evolution of beam dynamics important for colliding beams (beam-beam effect), synchrotron radiation production (beam stability), and the ILC damping ring (radiation damping time and electron cloud instability) [5]. Figure 4 shows the vertical position and beam size of a single e- bunch over a 9k turn interval (~23ms). Jumps in the vertical position on the PMT array are evident at the 50µm level over the 9k turns.
Figure 5. The results of a fast Fourier transform of the (a) vertical position and (b) vertical beam size for each of the 54 bunches of electrons during CHESS operation. The oscillation frequency measured here is fy ∼ 241.7kHz.
CONCLUSIONS The vertical beam size monitor currently allows analysis of CESR e+/e- bunches with 14ns spacing on a bunch-by-bunch, turn-by-turn basis, making it possible to study the evolution of beam dynamics important for colliding beams, synchrotron radiation production, and the ILC damping ring. Tools are in place in MatLab to fit the profile of each bunch in order to get vertical beam size and position data. The application of an FFT then gives the frequency of oscillation and the vertical tune (as well as vertical tune shift along each train). With PMT readout system upgrades under development to capture bunches with 4 ns spacing, the system will be capable of bunch-by-bunch, turn-by-turn data acquisition and analysis for CesrTA.
REFERENCES
Figure 3. The vertical (a) position on the PMT array and (b) beam size of a single bunch of electrons measured for 9k turns during CHESS operation. By applying a fast Fourier transform (FFT) on the vertical position or beam size, the frequency of oscillation of a single bunch can be quantified. Figure 5 is the FFT of the vertical beam size and position for the 9 trains of 6 06 Instrumentation, Controls, Feedback & Operational Aspects
c 1-4244-0917-9/07/$25.00 2007 IEEE
[1] Hamamastu Corporation, 360 Foothill Rd, Bridgewater, NJ 08807. [2] ] M.A. Palmer, et al., “Plans For Utilizing the Cornell Electron Storage Ring as a Test Accelerator for ILC Damping Ring Research and Development”, this conference [3] M.A. Palmer, et al., “A Bunch-by-Bunch and Turn-byTurn Instrumentation Hardware Upgrade for CESRc,” Proc. of the 2005 PAC, Knoxville, Tennessee, pp. 3597-3599. [4] The MathWorks, Inc., 3 Apple Hill Drive, Natick, MA 01760-2098. [5] M. Palmer, et al., “Electron Cloud Studies at CESR-c and CESR-TA”, Proc. of the International Workshop on Electron-Cloud Effects-ECLOUD’07, Daegu, Korea. T03 Beam Diagnostics and Instrumentation
4083