Android 6410 development board b. Intel atom N 450 ... Supports four operating system WinCE, Ubuntu, Linux, Android ... Processor- Intel Atom N450, 1.6GHz ii.
DESIGN AND IMPLEMENTATION OF REAL-TIME ALGORITHMS FOR EYE TRACKING AND PERCLOS MEASUREMENT FOR ON BOARD ESTIMATION OF ALERTNESS OF DRIVERS
Anjith George
DESIGN AND IMPLEMENTATION OF REAL-TIME ALGORITHMS FOR EYE TRACKING AND PERCLOS MEASUREMENT FOR ON BOARD ESTIMATION OF ALERTNESS OF DRIVERS
Report submitted to Indian Institute of Technology, Kharagpur for the award of the degree of
Master of Technology in Electrical Engineering with Specialization in “Instrumentation” by
Anjith George
DEPARTMENT OF ELECTRICAL ENGINEERING INDIAN INSTITUTE OF TECHNOLOGY, KHARAGPUR April 2012 © 2012, Anjith George. All rights reserved
i
DECLARATION I certify that a. the work contained in this report is original and has been done by me under the guidance of my supervisor(s). b. the work has not been submitted to any other Institute for any degree or diploma. c. I have followed the guidelines provided by the Institute in preparing the report. d. I have conformed to the norms and guidelines given in the Ethical Code of Conduct of the Institute. e. whenever I have used materials (data, theoretical analysis, figures, and text) from other sources, I have given due credit to them by citing them in the text of the report and giving their details in the references. Further, I have taken permission from the copyright owners of the sources, whenever necessary.
Signature of the Student
ii
CERTIFICATE This is to certify that the Dissertation Report entitled, “Design and Implementation of Real Time Algorithms for Eye Tracking and PERCLOS measurement for On board Estimation of Alertness of Drivers” submitted by Mr. “Anjith George” to Indian Institute of Technology, Kharagpur, India, is a record of bonafide Project work carried out by him under my supervision and guidance and is worthy of consideration for the award of the degree of Master of Technology in Electrical Engineering with Specialization in “Instrumentation” of the Institute.
………….……………………. Date: (Supervisor) Prof. Aurobinda Routray Department of Electrical Engineering Indian Institute of Technology, Kharagpur
iii
ACKNOWLEDGEMENTS This thesis is the result of research performed under the guidance of Prof Aurobinda Routray at the Department of Electrical Engineering of the Indian Institute of Technology, Kharagpur. I am deeply grateful to my supervisor for having given me the opportunity of working as part of his research group and huge amount of time and effort he spent guiding me through several difficulties on the way. Without the help, encouragement and patient support I received from my guide, this thesis would never have materialized I also acknowledge the research scholars, Anirban Dasgupta, Tapan Pradhan and S.L. Happy for their constant encouraging suggestions, sharing the technical skills and the synergy that they brought in my work. Further I would like to thank my friends and my parents for their wholehearted supports during the work.
Anjith George Department of Electrical Engineering Indian Institute of Technology, Kharagpur April 2012
iv
ABSTRACT The alertness level of drivers can be estimated with the use of computer vision based methods. The level of fatigue can be found from the value of PERCLOS. It is the ratio of closed eye frames to the total frames processed. The main objective of the thesis is the design and implementation of real-time algorithms for measurement of PERCLOS. In this work we have developed a real-time system which is able to process the video onboard and to alarm the driver in case the driver is in alert. For accurate estimation of PERCLOS the frame rate should be greater than 4 and accuracy should be greater than 90%. For eye detection we have used mainly two approaches Haar classifier based method and Principal Component Analysis (PCA) based method for day time. During night time active Near Infra Red (NIR) illumination is used. Local Binary Pattern (LBP) histogram based method is used for the detection of eyes at night time. The accuracy rate of the algorithms was found to be more than 90% at frame rates more than 5 fps which was suitable for the application. Keywords: PERCLOS, Face detection, Real-time system, Local binary pattern.
v
CONTENTS Title page Declaration Certificate by the supervisor Acknowledgements Abstract Contents List of abbreviations List of figures
i ii iii iv v vi vii viii
Chapter 1 Introduction
1
1.1 Literature survey 1.2 Scope of the thesis 1.3 thesis outline
1 4 5
Chapter 2 Requirement analysis
6
Chapter 3 Face detection and eye localization 3.1 Introduction to Haar like features 3.2 Application of Haar classifier in face detection 3.3 Modified algorithm for high frame rate 3.4 Tilted face detection with affine transform 3.5 Face tracking
15 15 17 18 21 24
Chapter 4 Eye detection
27
4.1 Haar classifier based eye detection 4.2 Principal component analysis 4.2.1 Introduction to principal component analysis 4.2.2. Algorithm 4.2.3 Application in image processing 4.2.4 Results with PCA Chapter 5 Detection of eye in Near Infra Red Images
27 28 28 28 30 31 33
5.1 Local Binary Pattern (LBP) features 5.2 Block LBP histogram 5.3 Algorithm 5.4 Results
vi
33 36 37 39
Chapter 6 Eye state classification
40
6.1 Introduction to Support vector Machines 6.2 Theory of SVM 6.3 Application 6.4 Results
40 40 43 43
Chapter 7 On board testing
47
Chapter 8 Discussions and conclusions
49
Chapter 9 Future scopes
50
Chapter 10 References
51
LIST OF ABBREVIATIONS PERCLOS- Percentage closure of eye NIR- Near infra red ROI- Region of interest PCA- Principal Component Analysis SVM – Support Vector Machines LBP-Local Binary Pattern SF- Scale factor SBC- Single board computer
vii
LIST OF FIGURES 2.1 State machine diagram in UML for the system 2.2 Hardware block diagram of the system 2.3 Software block diagram of the system 2.4 Intel Atom board 2.5 NIR lighting system 2.6 Pictorial view of the system 3.1 Common rectangular features 3.2 Integral image representations 3.3 Cascade structure 3.4 Remapping ROI co ordinates to original image 3.5 Scale factor Vs Area under curve 3.6 Scale factor Vs frame rate 3.7 Tilted face detection results 3.8 Tracking in video 3.9 Search window and estimated position when face is detected by Haar detector 3.10 Search window and estimated position when face is not detected 4.1 Flowchart of eye detection with Haar Classifier 4.2 Open and Closed Eigen eyes 4.3 Eye detection results 4.4Closed and open eye detection results 5.1 Circularly symmetric neighbor sets for different (P, R) 5.2 Example of texture primitive 5.3 Calculation of LBP 5.4 Grayscale and corresponding LBP image 5.5 Calculation of Block LBP histogram 5.6 Localization results of block LBP 6.1 Linearly separable classes 6.2 Mapping to a higher dimension 6.3 Weight pattern for open eyes 6.4 Weight pattern for closed eyes 6.5 Some samples of eyes used in the testing 7.1 On board testing of the system 7.2 Arrangement of camera and lighting system 7.3 Camera placement 7.4 NIR lighting system 7.5 Detection of eyes in NIR lighting
viii
9 10 10 12 13 14 15 16 17 19 20 21 23 24 26 26 27 31 32 32 34 35 35 36 37 39 41 42 44 45 46 47 47 48 48 48
Chapter 1 INTRODUCTION The lack of alertness is the prime reason for a number of motor accidents reported [1-2]. The measurement of the fatigue level is crucial in avoiding the road causalities. Percentage closure of eyes (PERCLOS) is reported as a good indicator for fatigue detection [3]. It is the ratio of closed eye frames to the total frames processed. The level of fatigue can be found from the value of PERCLOS. PERCLOS can be measured using non intrusive computer vision methods. The camera picks up the video and the videos are processed in real-time to give the PERCLOS values. The values are obtained in a one minute window and alarm is turned on if it is more than preset threshold. The main challenges of real time and on board estimation of PERCLOS are that the algorithm should exhibit good accuracy with illumination variation, changing backgrounds and vibration of camera. For accurate estimation of PERCLOS the frame rate should be greater than 4 fps. For capturing video under night driving conditions an active Near Infra Red (NIR) lighting system is used. The main focus is the design and implementation of image processing algorithms in a real-time embedded platform. We chose to implement the algorithms in Intel Atom Single board computer. The operating RTOS is chosen to be the Windows Embedded XP. Resolution of web cam is 640x480. For accurate estimate of PERCLOS the processing speed needs to be at least 4 frames per second. Since the system is to be installed in a vehicle, the algorithm has to be tolerant to illumination variations, different face poses and vibration of camera.
1.1 Literature Survey The main approaches for eye detection and tracking is classified into two: they are active IR (infrared) based methods and passive appearance methods. Active IR 1
illumination methods utilize a special bright pupil effect. It is an effective and simple approach for easy detection and tracking of eyes. The method works on a differential infra red scheme [4].In this method Infrared sources of two frequencies are used. First image is captured with infrared lighting at 850 nm, it produces a distinct glow in the pupils (the red-eye effect).The second image uses a 950nm infrared source for illumination that produces an image with dark pupils. These two images are synchronous with the camera and differ only by the brightness of pupil region. Now the difference of the two images are found in which the pupil region will be highlighted. After post processing the pupil blobs are identified and used for the tracking of eyes [5]. The main problems with this method are that the success rate changes with several factors. Brightness and size of pupils face orientation, external light interference (mainly the light from other vehicles and street lights) distance of driver from camera. The intensity of external light should be limited. The reflection and glints with glasses is another problem. Recently many developments are done in tuning the irradiation of IR illuminators. IR illuminators have to be tuned in order to operate in different natural light conditions, multiple reflections of glasses, and variable gaze directions. Some authors tried to implement systems which combines the active IR methods with appearance based methods. By combining imaging by using IR light and appearance-based object recognition techniques, those methods can robustly track eyes even when the pupils are not very bright due to significant external illumination interferences. The appearance model is incorporated in both eye detection and tracking via the use of a support vector machine and mean shift tracking [6]. Appearance based methods generally consists of two steps: locating face to extract eye regions and then eye detection from eye windows. The face detection problem has been faced up with different approaches: neural network, principal components, independent components, and skin colour based method. Each of the methods is having some constraints: frontal view, expressionless images, limited variations of light conditions, uniform background, face colour variations and so on. Eriksson and Papanikolopoulos present a system to locate and track eyes of the driver. They use symmetry-based approach to locate the face in grayscale image, and then eyes are found and tracked. 2
Template matching is used to determine if the eyes are open or closed [7]. Singh and Papanikolopoulos proposed a non-intrusive vision-based system for the detection of driver fatigue [8]. The system uses a colour video camera that points directly towards the driver‘s face and monitors the driver‘s eyes in order to detect micro-sleeps. Paul Viola and Michael Jones proposed a method for face detection using Haar like feature. The Haar like features can be computed fast using integral images. The algorithm is trained using AdaBoost method [9]. A strong classifier is formed by the combination of a large number of weak classifiers. The detector works in a cascaded manner so that the faces like regions passed by the first stages of classifier are more intensively processed. The detection rate of this method was more than 95% and the computational complexity is less. Turk and Pentland proposed Eigen face based method for face detection [10]. It included training with a large number of face images and the principal components are found. In the detection phase extensive block matching is done, with the projection of each block into the Eigen space. The reconstruction error is found for each block and the minimum value is found. If the minimum value is less than a threshold, it is considered as a positive detection. The major disadvantages were the variation with rotation, translation, size variation and illumination variations. In some approaches authors used colour, edge, and binary information to detect eye pair candidate regions from input image, then extract face candidate region with the detected eye pair. They verified both eye pair candidate region and face candidate region using Support Vector Machines (SVM) [11]. Some methods use the appearance and dimensions of eye. Many eye tracking applications only need the detection and tracking of either the iris or the pupil. Depending on the viewing angle, both the iris and pupil appear elliptical and consequently can be modelled by five shape parameters. The Hough transform can be used effectively to extract the iris or the pupil, but requires explicit feature detection. Often a circularity shape constraint is employed for efficiency reasons, and consequently, the model only works on near-frontal faces. Work on driver fatigue detection, has yielded many driver monitoring systems. All of these systems focus on providing information to drivers that will facilitate their driving and increase traffic safety. Some of them are given below 3
DAISY (Driver AssIsting System) has been developed asa monitoring and warning aid for the driver in longitudinal and lateral control on German motorways [12]. The warnings are generated based on the knowledge of behavioural state and condition of the driver. Robotics Institute in Carnegie Mellon University developed a drowsy driver monitor Copilot [13]. The Copilot is a video-based system for measuring slow eyelid closure as represented by PERCLOS. DAS (Driver Assistance System) has been developed by the group at the Australian National University [14]. It uses a dashboard-mounted faceLAB head-and-eye-tracking system to monitor the driver, The Distillation algorithm is used to monitor driver performance. Feedback on deviation in lane tracking is provided to the driver using force feedback to the steering wheel which is proportional to the amount of lateral offset estimation by the lane tracker. 1.2 Scope Of thesis In the current work we consider the detection and classification of eyes in three stages i.
Face detection and eye localization
ii.
Eye detection
iii.
Eye state classification
The false positive rate of algorithms is reduced by this approach and the search region for computationally intensive stages also reduces. For face detection we have selected Haar classifier based approach owing to its high accuracy rate [15]. The algorithm is modified for improved frame rate and detection of tilted faces. During daytime Haar based and PCA based algorithms are used for eye detection. In night time LBP (Local Binary pattern) based features are used for eye detection. Finally the state of eye is classified into open or closed with Support Vector Machine (SVM) [11] approach. The PERCLOS values are found over one minute windows.
4
1.3 Thesis Outline Chapter 2 includes the requirement analysis of the system. The software and hardware requirements and the specifications of the system selected are discussed in detail. Chapter 3 discusses the face detection algorithm and its modification for the improvement of real-time performance. An analysis of the variation of accuracy with different scale factors is also presented. It also discusses the detection of tilted faces. Chapter 4 includes the eye detection methods for daytime. Haar classifier based method and Principal Component analysis based methods are discussed here. Chapter 5 presents Local binary pattern features and their use in the detection of eyes in NIR lighting, Chapter 6 discusses the eye state classification with SVM Chapter 7 includes the details of the onboard testing of the system. Chapter 8 includes Discussions and conclusions
5
Chapter 2 REQUIREMENT ANALYSIS Real-time computing (RTC) is the study of hardware and software systems that are subject to a "real-time constraint"—i.e., operational deadlines from event to system response. A real time system may be one where its application can be considered (within context) to be mission critical. A system is said to be real-time if the total correctness of an operation depends not only upon its logical correctness, but also upon the time in which it is performed. Real time systems can be classified into 2 types i.
Hard Real Time Systems
ii.
Soft Real Time Systems
A hard real time system is one where the completion of an operation after its deadline is considered to be useless – maybe leading to a critical failure of the entire system. Hard real-time systems are used when it is imperative that an event is reacted to within a strict deadline [15]. For example, a pacemaker is an example of a hard real time system. Where as a soft real-time system will tolerate such lateness, and may respond with decreased service quality e.g., dropping of frames while displaying a video. The system to be developed is safety critical but at the same time a certain time span has to be provided to the algorithm to make sure whether the driver is really fatigued or the data obtained was just a one off glitch. The top– down mode of design is the most common approach to embedded system development. The major steps for this approach are:
i. Requirement ii. Specification iii. Architecture iv. Components v. System Integration
6
The requirement of the system are given below a. It should be mountable in the car. b. The system should be non intrusive, it should not cause any distraction to the
driver c. The false alarm rate should be a minimum d. The system should operate in real-time e. It should work for both day and nighttime.
Requirement analysis Requirement analysis is done on the basis of the requirement of the final product. The set of specifications needed are decided from the requirement of the final product. The basic requirement for our system is given below. Table 2.1 System requirements purpose
To monitor the alertness level of the driver using image based methods and to give an alarm if driver is drowsy
inputs(s)
Live Video from camera containing drivers face
output(s)
Alarm in case driver is drowsy
Functions
Detect the alertness level of driver from the camera video and to give an alarm in case driver is drowsy
Performance
The requirement for processing speed is a minimum of 4 frames per second. The accuracy of eye detection and classification should be higher than 90%.
Size
It should be compact enough to mount in the car.
Power
It should be able to draw power from car battery
Cost
Between 15000Rs-25000Rs
7
Specification
The specification is a carefully documented technical statement which accurately reflects the customer‘s requirements in such a way, which can be clearly followed in a design. The Universal Modelling language (UML) is the most common approach to capture all these design tasks [15]. It is a standardized general purpose modelling language which uses graphical notation techniques to create models of specific systems. UML diagrams represent two different views of a system model. Static (or structural) view: Emphasizes the static structure of the system using objects, attributes, operations and relationships. This approach consists of as many as 6 different types of diagrams. Dynamic (or behavioural) view: Emphasizes the dynamic behaviour of the system by showing collaborations among objects and changes to the internal states of objects. This method consists of 7 different types of diagrams. For our system, the best description would be behavioural state machine type diagram as we are more interested in the behavioural model of the system. Finally the algorithm is to be implemented on a development board. Therefore, structural diagrams are not considered though a rough idea of system resources required is necessary for board selection. Fig 2.1 shows the UML diagram of the system.
8
Behavioural representation (state machine diagram in UML)
Fig 2.1 State machine diagram in UML for the system 9
Block Diagram of the system Hardware
Embedded System
Camera
Buzzer
NIR lighting system Fig 2.2 Hardware block diagram of the system Software Alarm Yes
Start
Capture frame
Determine Eye state (open/close)
Calculate PERCLOS
If>thre shold
PER
Fig 2.3 Software block diagram of the system Fig 2.2 shows the overall hardware block diagram of the system. Camera and the embedded processing unit is the main part of the system. Fig 2.3 shows algorithm steps used for PERCLOS measurement. The loop runs continuously and the PERCLOS values are determined in overlapped time window of one minute. Selection of hardware platform We have considered two embedded development boards for the implementation , they are a. Android 6410 development board b. Intel atom N 450 board
10
a. Android 6410 development board The Android6410 Single Board Computer is developed based on Samsung ARM11, which is designed to provide cost-effective, low-power capabilities, high performance Application Processor solution for consumer electronics, industrial control, GPS, industry pda etc.. Android6410 perfectly realized the performance of Samsung S3C6410 in video media decoding, 2d the 3d graphics, display and then put etc..It provides LCD interface, TV Out interface, camera input port, Serial ports, SD Card interface, SPI, 100m network Ethernet rj45 interface, USB2. 0 - OTG interface, USB host interface, audio input and output interfaces, i2c interface etc. it contains a higher CPU Frequency and richer peripheral, and can apply to the embedded situation which needs higher performance and processing capacity. Supports four operating system WinCE, Ubuntu, Linux, Android CPU frequency 667MHz DDR 128M/256M Bytes DDR1 Nand Flash 256M Bytes The main drawbacks of the system were 1. The lower CPU speed 2. Lack of proper documentation for cross compilation of libraries and drivers for camera. b. Intel atom N 450 board Intel Atom board is having a Intel Atom N450 processor, with a cpu speed of 1.66GHz, 1GB DDR2RAM, VGA port, 6USB ports, 2 Ethernet ports, Serial port and a DIO port. It can be powered from a DC source of 12V. We have selected this platform for implementation owing to its higher processing speed and compatibility withX86 architecture. The board can work on 12 V DC supply so it could be directly connected to the car battery
11
Intel Atom Specifications i.
Processor- Intel Atom N450, 1.6GHz
ii.
RAM-1 GB single channel DDR2 667 MHz
iii.
Ethernet- 2 Ethernet ports
iv.
VGA port-1
v.
USB- 6 (USB 2.0 compatible)
vi.
Audio-3( Mic -in, Line-in, Line-out)
vii.
Serial port- 1 RS 232
viii.
DIO- 8 bit GPIO
Fig 2.4. Intel Atom Board
ix.
Operating system support- Windows Embedded XP, Linux, CE6.0
x.
Power requirements- DC 12V input (Tolerance ±10%)
xi.
Operating temperature- 0-60° C
xii.
Dimensions –255x152x50 mm
xiii.
Weight- 2.5 Kg
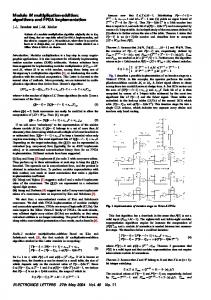
The Intel atom board selected for our application is shown in Fig 2.4 Camera Hardware The main aspect of the camera to be used include good resolution image. It should be able to transmit the videos at 30 fps through USB. During night time NIR illumination is used so the camera should be sensitive in NIR region (750-2000nm). For our application we have selected an I Ball Webcam with a resolution of 640x480 with maximum frame rate 60. Camera Positioning The placement of camera should be selected in accordance with four constraints It should not obstruct the view of the driver The image acquired should contain driver face at its centre Direct light from other vehicles or street lights should not fall on the camera Effect of vehicle vibration should be minimum
12
Based on the above constraints the camera placement is done on top of the dashboard. A hood is to be given to reduce the effect of light directly falling on the camera. On the final implementation the size of the camera will be very small so that it can be concealed in the dashboard. Lighting system During night time we use an active NIR illuminator for lighting up the face. We have used 24 NIR LED‘s for the NIR detector. The illuminator positioning has been done in such a way that it gives maximum illumination to the face. Fig 2.5 shows one part of the NIR lighting system.
Fig 2.5 NIR lighting system Power The system is to be powered from car battery. Use of extra battery will need frequent maintenance. We have used the 12V direct outlet from the car for powering the system. The main issue with the usage of battery is the surges during starting. We have used voltage stabilization to prevent surges. Software Platform Real time performance is the key requirement for the selection of software platform. The software platforms we have tested are Windows XP Embedded, Windows CE, Ubuntu and Android. The software platform selected for our system is Windows Embedded XP. The IDE used for development is Visual Studio 2006.
13
Pictorial view
Single board Computer
Webcam
Buzzer
NIR Lighting system
Fig 2.6 Pictorial view of the system Fig 2.6 depicts the arrangement of parts in the final system. USB web camera is used as the input device. The NIR lighting system is another part. The buzzer is used to generate alarm when PERCLOS value is more than a threshold.
14
Chapter 3 FACE DETECTION AND EYE LOCALIZATION 3.1. Introduction to haar like features Primarily Haar classifiers have been used for Face and Eye detection. A rectangular Haar-like feature can be defined as the difference of the sum of pixels of areas inside the rectangle, which can be at any position and scale within the original image. Each Haar like feature consists of two or three jointed black and white rectangles. The Haar wavelets are a natural set basis functions which encode differences in average intensities in different regions. The value of a Haar-like feature is the difference between the sums of the pixel gray level values within the black and white rectangular regions: f(x)=Sum black rectangle (pixel gray level) – Sumwhite rectangle (pixel gray level)
(3.1)
The advantage of using Haar like features over raw pixel values is that it can reduce/increase the in-class/out-of-class variability, which makes the classification easy. Fig 3.1 shows the commonly used rectangular features.
Fig 3.1 Common rectangular features
15
Fig 3.2 Integral image representation From Fig 3.2, Integral image at location of x, y contains the sum of the pixel values above and left of x, y, inclusive: (3.2)
𝑖(𝑥 ′ , 𝑦 ′ )
𝑃 𝑥, 𝑦 = 𝑥 , 0) That form a circularly symmetric neighbour set. If the coordinates of 𝑔𝑐 are (0,0) then the co ordinates of 𝑔𝑝 are given by
33
(−𝑅 sin
2𝜋𝑃
, 𝑅 cos
𝑃
2𝜋𝑃 𝑃
(5.2)
)
The Fig 5.1 shows circularly symmetric neighbour sets for various (P,R). The gray values of neighbours which do not fall exactly in the centre of pixels are estimated by interpolation.
Fig 5.1 Circularly symmetric neighbour sets for different (P, R) For grayscale invariance the gray value of the centre pixel (𝑔𝑐 ) is subtracted from the circularly symmetric neighbourhood𝑔𝑝 (𝑃 = 1,2, . . 𝑝 − 1). Giving 𝑇 = 𝑡(𝑔𝑐 , 𝑔0−𝑔𝑐 , 𝑔1 −𝑔𝑐 , … … , 𝑔𝑝−1 − 𝑔𝑐 )
(5.3)
Now we assume differences 𝑔𝑝 − 𝑔𝑐 are independent of 𝑔𝑐 , so 𝑇 = 𝑡(𝑔𝑐 )𝑡(𝑔0− 𝑔𝑐 , 𝑔1 −𝑔𝑐 , … … , 𝑔𝑝−1 − 𝑔𝑐 )
(5.4)
This is a highly discriminative texture operator. The occurrences of patterns in the neighbourhood of each pixel will be encoded in a P-dimensional histogram. In uniform regions the differences are zero in all directions. The Operator records highest difference in a gradient direction on a slowly sloped edge, Zero values along the edges and for a spot differences are high in all directions. The signed differences (𝑔𝑝 − 𝑔𝑐 ) are not affected by changes in mean illuminance: hence the joint difference distribution is invariant against grayscale shifts. The scale Invariance is obtained by considering the just the signs of the difference instead of their exact values. 𝐿𝐵𝑃 =
7 𝑛=0 𝑠(𝑖𝑛
− 𝑖𝑐 )2𝑛
Where,
34
(5.5)
𝑠 𝑥 =
1, 𝑥 ≥ 0 0, 𝑥 < 0.
Fig 5.2 Example of texture primitives Calculation of LBP feature
Fig 5.3 Calculation of LBP Fig 5.3 shows the calculation of LBP feature, the steps for calculation of LBP feature is explained below.
Divide each window to cells (e.g. 16x16 pixels for each cell).
For each pixel in a cell, compare the pixel to each of its 8 neighbours (on its lefttop, left-middle, left-bottom, right-top, etc.). Follow the pixels along a circle, i.e. clockwise or counter-clockwise.
Where the centre pixel's value is greater than the neighbour, write "1". Otherwise, write "0". This gives an 8-digit binary number (which is usually converted to decimal for convenience).
35
Compute the histogram, over the cell, of the frequency of each "number" occurring (i.e., each combination of which pixels are smaller and which are greater than the centre).
Optionally normalize the histogram.
Grayscale image
LBP image
Fig 5.4 Gray scale and corresponding LBP image Fig 5.4 shows a greyscale image and its corresponding LBP image. 5.2. Block-LBP histogram The LBP algorithm encodes the local features efficiently. Block LBP histogram feature is having information at three levels global features, region features and the pixel level features. In the LBP approach for texture classification, the occurrences of the LBP codes in an image are collected into a histogram. The classification is then performed by computing simple histogram similarities. But this results in loss of spatial information. One way to overcome this is the use of LBP texture descriptors to build several local descriptions of the eye and combine them into a global description. These local feature based methods are more robust against variations in pose or illumination than holistic methods. In the LBP approach for texture classification, the occurrences of the LBP codes in an image are collected into a histogram. The classification is then performed by 36
computing simple histogram similarities. However, considering a similar approach for facial image representation results in a loss of spatial information and therefore one should codify the texture information while retaining also their locations. One way to achieve this goal is to use the LBP texture descriptors to build several local descriptions of the face and combine them into a global description. Such local descriptions have been gaining interest lately which is understandable given the limitations of the holistic representations. These local feature based methods are more robust against variations in pose or illumination than holistic methods. The basic methodology for LBP based face description proposed by Ahonen et al. (2006) [19] is as follows: The facial image is divided into local regions and LBP texture descriptors are extracted from each region independently. The descriptors are then concatenated to form a global description of the face, as shown in Fig 5.5.
Fig 5.5 Calculation of block LBP histogram
5.3 Algorithm Here we have used the local histograms and pixel level values to get the feature vector.
37
Training Algorithm 1. Open eyes of size 50x40 are selected and each image are divided in to sub-blocks of size 5x4 2. The LBP feature values of the sub-blocks are found 3. 16 bin histogram of each block is calculated 4. The histogram of each block is arranged to form a global feature descriptor 5.
PCA is done on the feature vectors and 40 Eigen vectors having highest Eigen values were selected.
Detection Phase 1. ROI from face detection stage is obtained 2. For each sub window the Block- LBP histogram is found and is projected to Eigen space 3. The sub window with minimum reconstruction error is found 4. If the reconstruction error is less than a threshold it is considered as a positive detection Improvement of speed for calculation The speed of calculation for a single frame was prohibitive for a real-time application. The size of ROI from face detection stage is 200x70 and the size of eye for detection is 50x40. This means the number of sub windows to be searched is 4500. For each sub image the LBP feature is to be found and then the 16 bin multi block histogram. Once the feature vector is calculated it is projected to PCA subspace. In MATLAB the frame rate obtained was only 0.33. The number of search windows was limited by decreasing the overlap of pixels from 1 to 5 in horizontal and 4 in vertical direction. The calculation of LBP feature is done only once. From the Global LBP descriptor the 16 bin histograms are found at the first stage itself. Now in detection phase, the histograms are concatenated to give the description of the region. This approach reduced the computational to a great extent. In C coding the speed of the algorithm improved to a maximum of 6 fps.
38
5.4 Results
Fig 5.6 Localization results with block LBP The Fig 5.6 shows the detection of eye in NIR image. The frame rate obtained was 6 fps. The algorithm was giving better results even with illumination variations.
39
Chapter 6 EYE STATE CLASSIFICATION The eyes are detected by the block LBP histogram based approach. The final stage is the classification of state of the detected eyes. Support Vector Machine is reported as robust for the classification of open and closed eye [20]. The weight components from the previous stage are used for the classification of eyes. 6.1. Introduction to Support Vector Machines (SVM) SVM is a supervised learning method applied for data classification. The standard SVM is a binary classifier. A support vector machine constructs a hyper plane or set of hyper planes in a high or infinite-dimensional space, which can be used for classification or regression. Good classification accuracy can be obtained if the hyper plane is maximally distant from the nearest training data from both the classes. When data cannot be classified by a linear classifier the original data can be transformed into a higher dimension where the classes can be separated by a hyper plane. The essence of SVM is to map the training data from the input space to a higher dimension feature space, where an optimal hyper plane can be found which can separate the data. In the SVM training process the dot product of input vectors have to be computed in the feature space [21]. The mapping of the input vectors to the feature space is achieved by using kernels, which actually directly computes the dot product of the input vectors in the feature space, instead of first transforming each input vector to the feature space and only then computing the dot product. There are various types of kernels available quadratic, polynomial, radial basis function (RBF) etc. 6.2. Theory of SVM
For a linearly separable data the principle of SVM is explained below. Fig 6.1 shows two linearly separable classes. Given a set of linear separable training samples (𝒙𝒊 , 𝑦𝑖 )1≤𝑖≤𝑁 , 𝑥𝑖 ∈ 𝑅 𝑑 , 𝑦𝑖 ∈ {−1,1}
(6.1) 40
𝑦𝑖 is the class label where 𝑥𝑖 belongs to .The general form of linear classification function is[22] 𝑔 𝒙 = 𝒘. 𝒙 + 𝑏
(6.2)
This corresponds to a separating hyper plane 𝒘. 𝒙 + 𝑏 = 0
Fig 6.1 Linearly separable classes We can normalize 𝑔(𝒙) to satisfy 𝑔(𝒙) ≥ 1for all 𝒙𝑖 , so that the distance from the closest point to the Hyper plane is 1 𝑤 Among the separating hyper planes, the one for which the distance to the closest point is maximal is called optimal separating hyper plane (OSH). Since the distance to the closest point is 1 𝑤 finding the OSH amounts to minimizing 𝑤 and the objective function is: min ∅ 𝑤 =
1 𝑤 2
2
=
1 (𝑤. 𝑤) 2
(6.3)
Subject to 𝑦𝑖 𝒘. 𝒙𝒊 + 𝑏 ≥ 1, 𝑖 = 1,2, . . 𝑁
(6.4)
41
If we denote by (𝛼1 , 𝛼2 , … . . 𝛼𝑁 ) the 𝑁 non-negative Lagrange multipliers associated with constraints in (6.3, 6.4), we can uniquely construct the OSH by solving a constrained quadratic programming problem. The solution 𝑤 has an expansion 𝑤=
(6.5)
𝛼𝑖 𝑦𝑖 𝒙𝒊 𝑖
In terms of a subset of training patterns, called support vectors, which lie on the margin. The classification function can thus be written as 𝑓 𝑥 = 𝑠𝑖𝑔𝑛(
𝛼𝑖 𝑦𝑖 𝒙𝒊 . 𝒙 + 𝑏)
(6.6)
𝑖
When the data is not linearly separable, on the one hand, SVM introduces slack variables and a penalty factor such that the objective function can be modified as 1 𝜙 𝑤, = 𝒘. 𝒘 + 𝐶( 2
𝑁
(6.7) 𝜉𝑖 )
1
Fig 6.2 Mapping to a higher dimension
On the other hand, the input data can be mapped through some nonlinear mapping into a high-dimensional feature space in which the optimal separating hyper plane is constructed. Thus the dot product can be represented by 𝑘 𝒙, 𝒚 = (𝜙 𝒙 . 𝜙(𝒚))
(6.8)
When the kernel 𝑘 satisfy Mercer‘s condition [23]. Fig 6.2 shows a mapping from 2 dimensions to 3 dimensions. Finally, we obtain the classification function 𝑓 𝒙 = 𝑠𝑖𝑔𝑛(
𝛼𝑖 𝑦𝑖 . 𝑘 𝒙, 𝒙𝒊 + 𝑏) 𝑖
42
(6.9)
6.3. Application Here the eye state classification is modelled as a binary class problem. The class labels include open class and closed class. In the training phase from the open and closed eyes are feature transformed with Block-LBP and then projected to PCA subspace. The weights obtained are used for the training input of the SVM. The weight data along with the ground truth is used for the training. In the detection phase, the localized eye region is feature transformed first and then projected into the PCA feature space to get the weight components. The weights are fed into the SVM and SVM returns the classification result. From this eye state is obtained. The value of PERCLOS is found by calculating the ratio in overlapped time windows of one minutes and alarm is given when it is more than a threshold. 6.4. Results The training of SVM has been carried out with 460 images and it‘s tested with another 1700 samples of data. The training images are loaded to MATLAB Then block LBP histogram feature transform is done. Then PCA is carried out on the feature vectors. Now the weight vectors corresponding to each sample is found by projecting the samples to PCA subspace. These weights along with the ground truth are used for SVM training. The training is done with different kernels and different accuracy levels were obtained. The results are shown below
43
Pattern of Weight Components for Open Eyes
Weight Values
50
0
40 35
-50 30
0 25
5 20
10 15
15 10 20
5 25
Principal Components
Image Number
Fig 6.3 Weight pattern for Open eyes
44
Pattern of Weight Components for Closed Eyes
60
Weight Values
40 20 0 -20 -40
40 35
-60 30
0 25
5 20
10 15
15 10 20
5 25
Principal Components
Image Number
Fig 6.4 Weight pattern for closed eyes Fig 6.3 and Fig 6.4 shows the weight patterns for open and closed eye images.20 images of each class are projected after the LBP feature transform. From the weight pattern of first 10 weight components the variation of weight components for open and closed classes is apparent. The table shows the detection results. SVM with polynomial kernel was found to give good accuracy. Fig 6.5 shows some samples of eyes used for the testing.
45
Fig 6.5 Some samples of eyes used in the testing
Table 6.1 Detection results with SVM
Kernel function
True True False False True positive(tp) negative(tn) positive(fp) negative(fn) positive rate(tpr) 838 808 42 12 98.58%
False positive rate(fpr) 4.94%
827
765
85
23
97.29%
10%
Polynomial 848
807
43
2
99.76%
5.32%
Linear SVM Quadratic
46
Chapter 7 ON BOARD TESTING An on board experiment was carried out to check the operation of the designed platform. One camera was placed directly on steering column just behind the steering wheel, and the other was towards the left of the steering wheel on the dashboard (Fig7.2 Fig 7.3) . The SBC was powered from the car battery. The pictures of the on board test are given below
Webcams
SBC
Fig. 7.1 On board testing of the system
IR LED Panel
Top Camera Bottom Camera
Fig. 7.2 Arrangement of camera and lighting system 47
Camera on Top
Camera on Steering Wheel (mounted inside a thermocol hood to protect the camera lens from direct falling of light)
Fig 7.3 Camera placement
IR LED Lighting glued just beneath the ceil
Fig 7.4 NIR lighting system
Fig. 7.5 Detection of eyes in NIR lighting NIR lighting system works well for the test duration. Lighting was enough to detect faces properly providing a clear NIR image as input to the SBC. Fig 7.5 shows the detection from the system. Detection of face and eye in NIR images was quite successful with satisfactory results. 48
Chapter 8 DISCUSSIONS AND CONCLUSIONS Real time implementation of the algorithm has been done. This method has proven to be useful under laboratory as well as on board testing conditions with dark and lighted illumination conditions .The PERCLOS has already established to be an effective method by my co researchers at IIT Kharagpur [24]. The detection rate of the final algorithm is well above the required accuracy rate. The speed of computation is more than the requirements needed. The Haar classifier based algorithm for face detection was found to be working with accuracy more than 90% in daylight conditions as well as NIR lighting. The face detection method was working up to a frame rate of 9, and detects tilted faces with an in plane rotation of 70 degree. Performance of Haar based eye detection poor in NIR lighting, since the features available in NIR lighting is low PCA based algorithm performed with an accuracy of 98% in detection eyes in daytime. PCA can tolerate moderate amounts of tilt and can be modified to detect eyes with spectacles The performance of PCA depends on the training set, so a representative training set has to be selected for the training. LBP feature based methods gave best results in NIR eye localization The eye state classification accuracy from SVM was more than 98%, which was suitable enough for the application.
49
Chapter 9 FUTURE SCOPES The speed of the algorithm implemented is more than the required frame rate, so more computationally intensive post processing can be used to reduce the false positive rates. Tracking of face with Condensation algorithm can be used to detect the eyes even if the face detection stage fails. The detection of face in off plane rotation can be solved with the use of suitable tracker algorithms. A specially designed camera can be used which can be concealed in the dashboard, it will reduce the problem of light directly falling on to the camera The NIR lighting is to be designed for final implementation The packaging of the system is to be done for automotive conditions. The certification by ARAI (Automotive Research Association of India) has to be obtained.
50
Chapter 10 REFERENCES [ 1 ] Ji Q, Zhu Z, and Lan P, ―Real-Time Non intrusive Monitoring And Prediction of Driver Fatigue‖,IEEE Trans. Veh. Technol, vol.53,No.4,pp.1052-1068, Jul. 2004 [ 2 ] Bergasa L. M, Nuevo J, Sotelo M. A, Barea R, and Lopez M. E, ―Real-Time System for Monitoring Driver Vigilance‖, IEEE Trans. Intell. Transp. Syst., vol. 7, No. 1, pp. 63-77, Mar. 2006. [ 3 ] Lal, S. K., and Craig A. ― A critical review of the psychophysiology of driver‘s Fatigue‖, Biological Physiology, 55, 173-194.2001. [ 4 ] R. Grace, ―Drowsy driver monitor and warning system,‖ in Proc. Int.Driving Symp. Human Factors in Driver Assessment, Training andVehicle Design, 2001. [ 5 ] Zhang Guang Yuan ―A real-time eye detection system based on the active IR illumination‖ Control and Decision Conference. 2008. [ 6 ] Xia Liu ―Real-time eye detection and tracking for driver observation under various light conditions‖,Intelligent Vehicle Symposium, June 2002 [ 7 ] M. Eriksson, and N.P. Papanikotopoulos, ―Eye-tracking for detection of driver fatigue,‖ in Proc .Int. Conf. Intelligent Transportation Systems, Boston, pp. 314319, 1997. [ 8 ] S. Singh, and N.P. Papanikolopoulos, ―Monitoring driver fatigue using facial analysis techniques,‖ in Proc. Int. Conf. Intelligent Transportation Systems, Tokyo, Japan, pp. 314-318, 1999. [ 9 ] Paul Viola and Michael Jones "Rapid Object Detection using a Boosted Cascade of Simple Features", Conference on computer vision and pattern recognition, 2001. [ 10 ] M. Turk, and A. Pentland, "Eigen faces for Recognition", Journal of Cognitive Neuro sicence, Vol. 3, No. 1, 1991
51
[ 11 ] Hyungkeun Jee, Kyunghee Lee, and Sungbum Pan, ―Eye and Face Detection using SVM‖ Electronics and Telecommunications Research Institute [ 12 ] R. Onken, ―DAISY: an adaptive knowledge-based driver monitoring and warning system,‖ in Proc. Vehicle Navigation and Information Systems Conf., pp.3-10, 1994.] [ 13 ] R. Grace, ―Drowsy driver monitor and warning system,‖ in Proc. Int. Driving Symp. Human Factors in Driver Assessment, Training and Vehicle Design, 2001. [ 14 ] L. Fletcher, N. Apostoloff, L. petersson, and A. Zelinsky, ―Vision in and out of Vehicles,‖ IEEE Trans. Intelligent Transportation Systems, pp. 12- 17, 2003. [ 15 ] Wayne Wolf ―Computers as componets principles od embedded computing system design‖ 2 nd edition Elsevier 2008 [ 16 ] Lienhart R, Maydt J.‖An extended set of Haar-like features for rapid object detection‖International conference on image processing ,vol 1,2002. [ 17 ] Ahmad Ali1, and Dr. Sikander Majid Mirza, "Object Tracking using Correlation, Kalman Filter and Fast Means Shift Algorithms", IEEE-ICET 2nd International Conference on Emerging Technologies , 2006. [ 18 ] T. Ojala, M. Pietikainen, and M. Maenpaa, "Multiresolution gray-scale and rotation Invariant texture classification with local binary patterns", IEEE Trans. PAMI, vol. 24, pp. 971-987, 2002. [ 19 ] T. Ahonen, A. Hadid, and M. Pietikaeinen. ―Face recognition with local binary patterns‖, In Proc. of 8th European Conference on Computer Vision, Prague, Czech, 2004. [ 20 ] R.C. Coetzer and G.P Hancke ―Eye detection for a real-time vehicle driver fatigue monitoring system‖, IEEE Intelligent Vehicles Symposium (IV), June 5-9, 2011 [ 21 ] Hearst M.A, Dumais S.T, and Osman E,Platt J. ―Support Vector Machines‖, Intelligent Systems and their Applications, Jul/Aug 1998. [ 22 ] Lei Zhang, Fuzong Lin, and Bo Zhang, ‖Support vector machine for image retrieval ” International conference on image processing.Vol 2.pp 721-724,2001 52
[ 23 ] C.J.C. Burges, ―A Tutorial on Support Vector Machines for Pattern Recognition‖, Data Mining and Knowledge Discovery, pp. 1-47, 1998. [ 24 ] Sukrit Dhar, Tapan Pradhan, Supratim Gupta and Aurobinda Routray, ,"Implementation of Real Time Visual Attention Monitoring Algorithm of Human Drivers on an Embedded Platform", Proceedings of the 2010 IEEE Students' Technology Symposium 3-4 April 2010, IIT Kharagpur
53