DESIGN AND SET-UP OF A BI-PENDULUM IMPACT TESTING MACHINE Leonardo D’Acquisto* and Roberto Montanini° *DIMA, University of Palermo, V.le delle Scienze, 90128 Palermo, Italy ° DCIIM, University of Messina, Salita Sperone 31, 98166 Messina, Italy ABSTRACT In this work the design and set-up of a bi-pendulum testing rig able to perform low-velocity impact measurements on small and medium-size components is reported. Experimental tests were conducted both to check the theoretically calculated value of the equivalent impacting mass and to quantify the overall energy losses during the idle movement of the mass. In order to provide useful information on the material behaviour during a crash test, the impact testing machine has been instrumented with different sensors: a piezoelectric accelerometer placed on the impact mass to measure the horizontal acceleration, an optical sensor to measure the initial impact velocity, a piezo film load cell, developed by the Authors, placed on the sample holder block, to measure the impact force directly on the specimen. 1.
OVERVIEW OF IMPACT TESTING TECHNIQUES
Measurement of mechanical properties at high rates of strain is conventionally done by means of different types of testing rigs, which, with regard to the operation principle, may be classified into three groups: a) Charpy or Izod pendulum b) Falling weight machines c) Split Hopkinson pressure bar The first type is typically used for resilience test (Izod, Charpy) on notched specimens according to the ISO 148-1 [1] standard or ASTM E23 [2], and usually only the difference in potential energy before and after the test (i.e. the total energy required to fracture the test piece) is measured. The specimen is subjected to a three-points bending load and therefore it is not crushed. Furthermore, the maximum potential energy of commercial resilience pendulum is not very high (up to about 100 J). This type of test lacks important information about what was happening to the specimen during the impact event. Recently also instrumented Charpy testing, in which a striker edge is instrumented with strain gauges, have been standardized [3]. The strain gauges may be placed on the striker at various locations which have been found to result in significant differences in the impact energies derived from the load signal [4-6]. These differences are a consequence of the particular striker design and location of the strain gauges on the striker edge, the dynamic response of the tup and the loading conditions which the tup experiences when the test pieces are bent through to large angles [7]. These conditions are different from the conditions for which the tup has been calibrated, especially if using static calibration procedures. Falling weight testing machines are generally used for low-velocity impacts, in which throughthickness stress waves in the specimen do not influence the stress distribution at any time during the impact event. Falling weight or drop-weight impact tests are performed by several types of machines (drop-dart, ball drop impact tester, etc.) which consist of an instrumented impactor, variously shaped, which falls vertically from a certain level on the specimen to test. Depending on the instrumentation used, detailed information, like test piece elastic stiffness, deflection, load time history, absorbed energy, collapse mechanism, could be provided by this kind of test. A large number of tailor-made impact testing machines have been proposed by different research groups [8-13], in addition to commercial versions (i.e. Instron Dynatup, CEAST Fractovis, MTS 819.XX Series). The initial energy could be easily setup by changing the initial height and/or the mass value; kinetic energies up to 400-500 J can
be obtained, with initial impact velocity up to 15 m/s. In conventional instrumented drop-tower test, the force that the specimen exerts on the impact mass is the only quantity which is measured as a continuous function of time. Therefore, the specimen itself is generally not instrumented. To obtained load-deflection plots, the deflection of the specimen should be determined somehow as a function of time and this determination is generally done indirectly, by numerical integration of the equation of motion for the impact mass. The split Hopkinson pressure bar (SHPB) technique has been developed over the past 80 years and many versions have been proposed based on the original work of Hopkinson [14]. Major advances were made by Davies [15], who applied electrical measurement techniques to increase greatly the versatility of the Hopkinson design and to enable direct measurement of the pressure-time curve at the end of the bar. The modern form of the technique was developed by Kolsky [16], who split the bar and introduced disc-shaped samples between the two portions of the bar and thus invented the split Hopkinson pressure bar which has for almost 50 years been one of the primary methods of performing high-rate (102 ÷ 104 s-1) mechanical tests [17-19]. In its usual form the SHPB consists of a cylindrical projectile which is launched to impact upon a long cylindrical bar. The stress pulse due to the impact proceeds down to the bar and encounters the sample under test which is compressed between the impacted bar and a similar transmitter bar. Strain gauges mounted on the impacted and transmitter bar are used to evaluate the stress and the strain in the sample. The force on the sample is directly measured from the transmitted wave using the gauges on the transmitter bar and the amplitude of the reflected wave is integrated to yield the sample’s longitudinal strain. The assumption of constant volume deformation is then used to determine the sample’s cross section and hence stress. Although they have provided a very large quantity of data, SHPB systems have the disadvantage of usually requiring a supply of highpressure gas for the gun used for projectile launching, thus requiring a large dedicated floor area [20]. In addition high level oscillations, superimposed to the signal, are generated as a consequence of the short rise-time of the loading pulse produced by the impact of the projectile [21]. 2.
DESIGN OF A LOW-VELOCITY IMPACT TESTING RIG
Two crucial factors in the design of instrumented impact test rigs are drop guide and instrumented impactor. A close observation of commercial drop weight impact rigs reveals that two design principles for drop guiding are used, namely, double column-guide and double channel-guide: for both solutions, friction effects during the impact mass falling are not negligible and they could provide slightly different responses even under similar impact conditions. Furthermore, if the drop mass isn’t well guided, high frequency vibrations will be generated when it crashes the specimen, thus adding noise to the measured signals. As far as the instrumented impactor is concerned, it has to be as rigid as possible, without appreciable elastic deformations during the crash and the instrumented part should be placed close to the nose (or tup) of the impactor in order to minimise distortions of the recorded impact response. In addition, it is quite desirable for the instrumented part to be machined out of one piece of solid material with the impactor rather than bolted together from two separate pieces. In the latter case, in fact, the presence of an interface between the two parts is believed to be one of the major design sources for significant oscillations in the impact response. These considerations lead to the choice of a swinging bi-pendulum layout for the design of a low-velocity impact testing machine able to crush small and medium-size components, with an adequate energy level (up to about 300 J). The bi-pendulum principle ensures that the impact end surface always lays on a vertical plane. Another advantage of this solution when compared to the drop-weight layout is a more effective guiding of the impactor, which is supported by means of rolling bearings. The bi-pendulum impact testing rig, developed at the University of Messina, consists of a
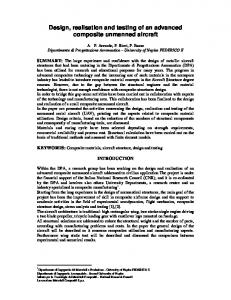
tubular frame on which two pairs of prismatic bars, holding the impact mass, are connected. The frame layout has been optimised by means of a simplified FE analysis performed with the MSC Nastran code. Different configurations have been considered (Fig.1) and compared in terms of maximum equivalent Von Mises stresses and maximum displacement (Table I).
#1
#2
#3
#4
Figure 1 – Different layout configurations
Comparing results in Table I, it can been seen that the last two configurations give similar results both in terms of stress peaks and maximum global displacement, but the last one is simpler, requiring a minor number of bars: this configuration has therefore been chosen (Fig.2). The equivalent stiffness of the frame has also been determined numerically for different load values (Fig.3). Max. Von Mises Stress [MPa] Max. total displacement [mm]
LAYOUT #1 95 1.15
LAYOUT #2 57 0.20
LAYOUT #3 56 0.14
LAYOUT #4 56 0.13
Table I – Comparison of different frame configurations (FE analysis) Equivalent stiffness [kN/mm]
180 y = -0.0642x + 148.7
160 140 120 100 80 60 40 20 0 0
2
4
6
8
10
12
14
16
18
20
Load [kN]
Fig. 2 – Bi-pendulum impact testing machine
Fig. 3 – FE calculated frame stiffness vs. load
The mass of the impactor is about 50 kg, but also the four supporting bars will contribute to the impact kinetic energy. The theoretical equivalent mass can be easily calculated starting from the geometric and physical characteristics of the masses involved and - neglecting the mass of the rolling bearings - it is about 64 kg. By varying the initial height, the impact energy can be adjusted. Initial positioning and release of the impact mass is obtained with an electro actuated
Description Value Theoretical equivalent mass 63.69 kg Maximum drop height 540 mm Maximum kinetic energy 340 J Maximum impact area 110 x 110 mm2 Maximum specimen length 200 mm Table II – Nominal characteristics of the bi-pendulum impact testing machine
magnet, which is supported by means of a metallic wire to an electric winch, that is fixed to the laboratory ceiling. The test piece is fixed on a high stiffness metallic block, rigidly connected to the ground. Relative positioning, i.e. specimen vs. machine frame, can be accurately set up before executing the test. The other characteristics have been reported in Table II. 3.
EXPERIMENTAL DETERMINATION OF MECHANICAL PARAMETERS
An accurate evaluation of some mechanical parameters influencing the performance and behaviour of the impact machine should be carried out in order to establish a precise relation between the initial falling height of the impact mass and the maximum kinetic energy available at the beginning of the impact. An accurate knowledge of both the equivalent mass acting during the impact and the mechanical losses (friction, windage, etc), which can at some extent reduce the theoretical value of the horizontal velocity at the impact, is therefore required. Experimental tests have been conducted both to check the theoretically calculated value of the equivalent impacting mass and to evaluate the friction model acting during the movement of the impactor in order to quantify the overall energy losses during the idle movement of the mass before the impact occurs. To evaluate the equivalent impacting mass a test was performed using the acceleration signal from an accelerometer placed horizontally at the rear surface of the impacting mass and the load signal from a novel piezo film load cell [22] placed directly on the sample holder block, visible on the left side of Fig.2. The accelerometer was a piezoelectric transducer mod. 4382 supplied by Bruel & Kjaer, with sensitivity 3.155 pC/ms-2, which is connected via signal conditioner mod. Nexus 2262 to a digitizing oscilloscope Tektronix mod. TDS7254. The piezo film load cell is an ad-hoc transducer realized by the Authors with a 60*60 mm P(V2F-V3F) copolymer gage which has been calibrated under dynamic working conditions after it was installed on the proposed impact machine, providing a calibration factor equal to 0.0107 V/N, with non-linearity about 2% F.S. [22]. A medium energy impact test was performed directly on the instrumented specimen holder block without any specimen showing a peak impact force level around 1300 N. The amplitude spectrum of the frequency response function (FRF) between the piezo film load cell output (expressed in Newton) and the horizontal accelerometer output (expressed in m/s2) is presented in Fig.4. It shows over almost the whole range of excited frequencies a value of the equivalent impacting mass appreciably close to the calculated value 63.69 N indicated in section 2. 200
2
180
horizontal velocity [m / s ]
160
Amplitude [kg]
140 120 100 80 60 40
0
1 0.5 0 -0.5 -1 -1.5
20 0
1.5
500
1000 1500 2000 2500 3000 3500 4000 [Hz]
4500 5000
Fig.4 – Evaluation of the equivalent mass
-2 0
50
100
150 [s]
200
250
300
350
Fig.5 - Damped horizontal velocity
A different test was performed after removal of the specimen holder block to evaluate the losses acting during idle oscillation of the impactor. A long run oscillation test was performed and the horizontal acceleration of the bi-pendulum impactor was recorded (Fig.5). Mass was relieved from about 85 mm above its rest position and it was left free to oscillate until the oscillation vanished. The acceleration output was time-integrated to obtain the velocity
signal, while the initial value of the impact velocity (i.e. velocity before the crash) was measured by means of an optical sensor (Fig.6). The results show a linear decay of the horizontal velocity vs. time, expressed by equation: v(t)=-0.0037·t + 1.258, which substantially confirms the theoretical assumed model of viscous friction. Windage effects are however observable at higher velocities, where the linear fit is not perfectly followed. On the ground of the results obtained from these tests the proper working of the bi-pendulum impact machine can be assessed providing an operating table (or chart) which relates the maximum kinetic energy at the beginning of the impact to initial height of the impacting mass the operator has to set to perform the desired impact test.
Fig.6 – Optical velocity sensor (grid pitch 0,5 mm)
Fig.7 – Vertical acceleration (1), horizontal acceleration (2) and impact velocity (3) signals
In Fig.7 time histories of the horizontal and vertical accelerations, measured by two accelerometers (Bruel & Kjaer 4382, sensitivity 3.155 and 3.148 pC/ms-2, respectively) are shown together with the initial impact velocity measured with the optical sensor. 4.
EXAMPLE OF APPLICATION
The dynamic compression of a rubber tapered specimen, having dimension φ1=30 mm, φ2=20 mm, height=25 mm (see fig. 9), is presented. This material has been chosen for its low strain rate sensitivity and because it shows a noticeable non-linear behaviour at high degree of compression. This characteristics allow to check the designed impact machine repeatability by comparison of the measured force – displacement signals with those obtained by a simple quasi-static test, performed with a universal testing machine. 7
16 Double integration signal [mm]
Optical sensor velocity [V]
4
12 10
3
8
2
6
1
4
0 Single integration signal [m/s]
-1 -2 0
V0= 1,42 m/s 15
V0= 1,20 m/s 10
V0= 1,05 m/s V0= 0,96 m/s
5
0
Static
2
0 500 1000 1500 2000 2500 3000 3500 4000 4500 5000 5500 6000
Rigid block
Accelerometer [V]
Force [kN]
Voltage level [V]
5
20
14 Sample compression [mm]
6
Specimen
Impactor
-5 0 Samples
Fig.8 - Acceleration, velocity, displacement and optical sensor signals measured during the impact test on a rubber specimen.
5
10
15
20
Sample compression [mm]
Fig.9 – Force - displacement curves obtained by dynamic compression of rubber specimens at different initial impact velocity.
In Fig.8 the measured acceleration signal is plotted, together with the velocity and displacement ones, obtained by numerical integration. In the figure also the optical sensor
signal, which has been used in order to determine the initial impact velocity, is reported. From the acceleration curve, it can be noted that damped oscillations are generated at the beginning of the impact but they could be easily removed by filtering the signal. In Fig.9 force - displacement curves obtained by dynamic compression at different initial impact velocity are shown, together with the quasi-static one, obtained with an universal testing machine (LLYOD 10kN). It can be observed a very good comparison between the curves, although strong material non-linearity are present. CONCLUSIONS A bi-pendulum impact testing machine for low velocity impact with energy up to 300 J is proposed. It has been characterized in terms of equivalent mass and friction losses providing satisfactory results. It has been equipped with measurement instrumentation which has shown to be effective for the required measurement needs. Further development will aim to improve the effectiveness of the on-board measurement instrumentation. REFERENCES [1] [2] [3] [4] [5] [6] [7] [8] [9] [10] [11] [12] [13] [14] [15] [16] [17] [18] [19] [20] [21] [22]
ISO 148-1. Metallic materials – Charpy pendulum impact test –Part1: Test method. ASTM E23-96. Standard test methods for notched bar impact testing of metallic materials. st ISO 14556. Steel Charpy V-notch pendulum impact test – Instrumented test method. 1 ed., 2000. Tronskar J.P., Mannan M.A., Lai M.O. “Measurement of fracture initiation toughness and crack resistance in instrumented Charpy impact testing” - Engineering Fracture Mechanics vol. 69 pp.321–338; (2002) Tronskar J.P., Mannan M.A., Lai M.O., “Direct measurement of displacement in instrumented Charpy impact testing for structural integrity assessment”. Journal of Testing and Evaluation, vol. 29 (3), pp.246-257 (2001) Lorriot T., “Specimen loading determined by displacement measurement in instrumented Charpy impact test“ - Engineering Fracture Mechanics 65 (2000) pp.703-713 Kalthoff JF. “On the measurement of dynamic fracture toughness - a review of recent work”. International Journal of Fracture;27:pp.277-298, (1985). Zhao H., “A study on testing techniques for concrete-like materials under compressive impact loading”. Cement and concrete composites, vol. 20, pp. 293-299; (1998). Found M.S., Howard I.C., Paran A.P., “Interpretation of signals from drop-weight impact test”. Composite structures, vol. 42, pp.353-363; (1998) Toropov A.I., Grosso M. “Dynamic Calibration of Impact Test Instruments” - Journal of testing and evaluation, Vol. 26 (4), pp. 315-319, (1998). Zhou G., “The use of experimentally determined impact force as a damage measure in impact damage resistance and tolerance of composite structures”; Composite Structures, vol. 42 – pp. 375-382, (1998). R.A. Chivers, D.R. Moore, “Further developments in the interpretation of signals form instrumented falling weight impact (IFWI)”, Meas. Sci. Technol., 1, pp. 313-321, (1990). J.M. Lifshitz, F. Gov, M. Gandelsman, “Instrumented low-velocity impact of CFRP beams”, Int. J. Impact Eng., Vol: 16, Issue: 2, pp. 201-215 (1995). B. Hopkinson, B. "A method of measuring the pressure produced in the detonation of high explosives or by the impact of bullets", Phil. Trans. R. Soc. Lond. A 213, pp. 437-456, (1914). R.M. Davies, "A critical study of the Hopkinson pressure bar", Phil. Trans. R. Soc. Lond. A 240, pp. 375-457, (1948). H. Kolsky, "An investigation of the mechanical properties of materials at very high rates of loading", Proc. Phys. Soc. Lond., B 62, pp. 676-700, (1949). Knapp J., Altmann E., Niemann J., Werner K.D.: “Measurement of shock events by means of strain gauges and accelerometers” – Measurement vol. 24, pp. 87-96, (1998). Knapp J., Altmann E., Deichmann F., Grumm H., “Measurement of acceleration and strain in impact tests” – Proceedings of 14 IMEKO World Congress, Tampere 1-6 June 1997, vol. 14, pp. 81-86, (1997). Ueda K., Umeda A., “Characterization of shock accelerometers using Davies bar and laser interferometer”, Experimental Mechanics, vol. 35(3), pp.216-223, (1995). S. Hamdan, G.M. Swallowe, “A crossbow system for high strain rate mechanical testing”, Meas. Sci. Technol., 6, pp. 443446, (1995). D.J. Parry, A.G. Walker, P.R. Dixon, “Hopkinson bar pulse smoothing”, Meas. Sci. Technol., 7, pp. 1068-1072, (1996). L. D’Acquisto, R. Montanini, “A study on the impact measurement instrumentation for a bi-pendulum testing machine”, Proc. 5° National Congress on Mechanical and Thermal Measurement, Montegrotto Terme (PD), Italy, September 17-19, (2002).
CONTACT Leonardo D’Acquisto Dipartimento di Meccanica e Aeronautica Università degli Studi di Palermo Viale delle Scienze – 90128 Palermo – Italy E-mail:
[email protected]
Roberto Montanini Dipartimento di Chimica Industriale e Ingegneria dei Materiali Università degli Studi di Messina Salita Sperone, 31 – 98166 Messina – Italy E-mail:
[email protected]