Design of a 3D Interactive Simulator For Driver Behavior Analysis Smaragda Christodoulou, Despina Michael Department of Multimedia and Graphic Arts, Cyprus University of Technology Limassol, Cyprus
[email protected],
[email protected] Andreas Gregoriades Department of Computer Science and Engineering, European University Cyprus Nicosia, Cyprus
[email protected] Maria Pampaka School of Social Sciences, The University of Manchester, Manchester, UK
[email protected]
Keywords: Driving Simulator, Workload, Distractions, Human Error. Abstract Diagnosing the causes of road accidents and the development of effective countermeasures to reduce accident rates is of key importance in road safety. Human error is one of the principal influencing factors that lead to road accidents, and is attributed to increased mental workload induced by distractions. Workload, however, is characterized by intrinsic properties that are difficult to observe. Hence, phenotype behaviors, such as lane deviations, could act as good predictors of driver workload. Driving simulators emerged as a promising technology for the analysis of driving conditions and road users’ behavior in an attempt to tackle the problem of road accidents. However, the cost of designing or owning a simulator to conduct a safety analysis is prohibitive for many government agencies. The work presented herein demonstrates the design and development of a driving simulator, using a 3D game engine that aims to contribute towards evaluating black spots in road networks by promoting rapid design of realistic models and facilitating the specification of test scenarios. The developed simulator was employed to conduct a set of preliminary experiments that analyzed driving behaviors of local road users for a chosen black spot in a road network in Limassol-Cyprus. Data collected from the experiments are analyzed, results are presented and conclusions are drawn.
1.
INTODUCTION Road accidents have become a daily hazard in Europe and worldwide [1]. According to Eksler [2], around 1.2 million fatalities and more than 50 million injuries occur in roads worldwide every year. Given the current trends, the accident fatalities are projected to become the second most common cause of death in 2020 if no drastic measures are taken. To that end, EU set the goal to reduce road fatalities and injuries by 50% by 2020. In addition to fatalities, traffic accidents result in high economic losses due to traffic congestion which in turn leads to a wide variety of adverse consequences such as, traffic delays, supply chain interruptions, travel time unreliability, increased noise pollution, as well as deterioration of air quality. Road accidents are caused by many factors and there are different viewpoints to the problem. Eksler [2] argue that accidents are caused by demographic, infrastructural and political factors.. At the other end of the spectrum human factors experts view the problem from another perspective and consider accidents as a consequence of human error. According to Hollnagel [3] human error is defined as the human activity or absence of activity that leads to incorrect system behavior. Human error may occur due to physical, perceptual and cognitive limitations of humans [4] and is directly related to visual attention [1] and workload [5]. The analysis of accidents accounting for human error can be carried out from two perspectives: the designers and the user’s perspective. The former addresses the system designers' flaws that hinder human activity due to usability problems whereas the latter analyzes internal cognitive
processes of human operators to identify bottlenecks in decision making that are caused by overloading due to increased workload. Mental workload constitutes an important influencing factor on road accidents and is directly related to human performance [6] and attention. According to Bailey [7], workload is defined as the demand placed upon people which could be a behavioural response to events, communication and interaction between the human and the technology, the human and the environment and human-human interaction. High levels of workload degrade the operator’s concentration, information processing and decision making, leading to increased errors, which might have catastrophic effects [8-10]. Similarly, low workload causes boredom that reduces alertness and attention while performing the primary task of driving the vehicle. In the case of road accidents, when the information that needs to be processed by the driver exceeds his/her available attentional resources, this causes overloading, and subsequently increased errors that could result in road accidents.The focus of this study is on human factors analysis of road network designs to identify potential areas of concern. The analysis is based on data from an experiment conducted regarding phenotype driver behavior using a driving simulator. In particular, this investigation focuses on the impact of different types of driver distractions such as advertisements along a critical point of a road network in Cyprus in combination with different designs of traffic control. The use of a driving simulator is inevitable for such type of experiments because of ethical reasons and due to the fact that control parameters in the real world requires investment of time and money [11] which in most cases in prohibitive. To rule out confounding effects it is necessary to control influences to human error that are irrelevant to the study. This, however, is very difficult in field experiments. Therefore the use of a driving simulator provides the researcher with a powerful tool to test driving behavior [11] under controlled settings. However, the cost of owning a driving simulator to conduct safety analyses is prohibitively costly for many government agencies. At the same time outsourcing of experiments to analyze driving behavior using native users is difficult, if not impossible, in some cases due to the large number of subjects that need to take part in the experiments. On the other hand, low cost simulators lack the desired level of realism necessary for driving behaviour or human factors analyses. Unrealistic conditions affect the driving behavior of users which
influence the validity of the experimental studies conducted. The method proposed herein demonstrates the design of a driving simulator that exploits 3D modeling tools in a module-based approach to promote realism and interactive 3D construction of road networks. The approach simplifies the process of implementing 3D road infrastructure models through the utilization of reusable modules. This simplifies the process of designing/modifying the simulation model by reusing model constructs in a plug and play fashion. The paper is organized as follow: firstly an overview of the related work is outlined; next the design of the driving simulator is presented along with the design of the experiment. The paper concludes with the analysis of the results and their implications. 2.
RELATED WORK Road accidents are attributed to human factors as a contributing factor [6]. Humans have limited information processing abilities and must rely on three fallible mental functions: perception, attention and memory. Drivers commit errors because the situation exceeds the limitations of one or more of these three functions. Human factors in driving address two aspects: the driving behaviour and the driving task. The latter relates to information perception, analysis, decision making and action at the operational level while the former to perception, analysis, decision making and action at the tactical and strategic level. The driving task requires information processing and motor skills, which improve with time while, driving behaviour refers to the style of driving that is not necessarily time depended. Driving behaviour is manifested by phenotype behaviours such as: speed, gap acceptance and lane changing while the primary driving task is supported or hindered by visual, tactile and auditory information. Driver information processing needs increase with distractions from endogenous and/or exogenous parameters. The former include aspects relating to the environment, the vehicle, the road infrastructure and the traffic conditions and exogenous parameters include, but are not limited to: passenger distractions, noise, mobile phones, in-vehicle information systems' usability. People driving in a highway are bombarded with information. Most of this information is visual input, such as road geometry, other vehicles, pedestrians, scenery, etc. At the same time, the driver may be processing other inputs relating to auditory resources, such as communicating with a
passenger, listening to the radio, etc. This information creates a demand for cognitive resources. In the case that the demand exceeds available resources then the driver attends to only a subset of the available information to make decisions. According to Miller [12], people can process 7 plus or minus 2 discrete information chunks at a given point in time. This approximates to the boundary of our cognitive capacity in terms of memory. Therefore, increased demand for cognitive resources may result in drivers failing to attend to critical information on the road. Humans are information processing systems with a number of information flow channels (visual, auditory, tactile) sampling various information sources (e.g. a navigation system display, the forward view through the windscreen) which have various bandwidths (e.g. high-density traffic will require a higher sampling rate than low-density traffic). Our cognitive capacity is limited, and in return there is an upper threshold to the amount of information we can process per second and channel. Therefore, we tend to share our attention among a few information sources. When overloaded, we neglect to sample some of the information sources (e.g. the rear-view mirror) or miss information (e.g. the fact that the car ahead is slowing down) because we sample the information source too infrequently. Moreover, we are limited in our ability to manipulate the information we take in, and in the rate at which we can make decisions. Therefore, in an unexpected event an overloaded driver is less capable of dealing with the situation safely. Fuller [13-14], also expresses accident risk as a function of the driver’s cognitive resources and task-demand in the driver-road system. Another important factor for road accidents is the link between workload and driver distraction. Distraction in driving is a frequently reported factor for road accidents. According to Dingus [15] distractions contribute to 78% of accidents and to 65% near-crashes. Distractions can emerge from outside or inside the car. Most research investigate incar distractions [16], and relatively little work is done for exogenous distractions that emerge from outside the car [17]. Among the many distractions that can emerge from the environment are roadside advertising billboards which poses a crucial risk to road safety. Given that driver’s attention is limited, when over-consumed they reduce task-relevant concentration that adversely affect driving performance. The evidence that accident risk increases with roadside advertising is increasing, with estimates putting advertisements responsible for up to 10% of all road traffic accidents. According to Young [18] roadside advertising
adversely affect lateral control which is a manifestation of overloading. In the same vein, basic research results stress the fact that visual search reaction times increase with distractors and proximity to the stimulus that cause the distraction [19]. This as a result yields evidence that highlights that drivers’ visual attention is attracted by advertisements [20]. This however increases significantly the risk of accident in the case that the driver’s visual workload is already compromised. As a result the driver may fail to sufficiently attend primary task-needs and hence make erroneous actions that could lead to a hazard. Overloaded driver phenotype behaviours include but are not limited to the following: lane position deviation, number of lane departure, lane departure durations, and speed deviation. Monitoring these phenotypes can give a good estimation of driver workload. However, whilst there is evidence that roadside advertisements have potential effects on driver attention, it is difficult to conclude about its specific risks. Results from field studies and controlled experiments seem to conflict. Hence, more empirical research is required. This work contributes in this direction through the empirical analysis of the effect of distractions on driving behaviours and in consequence accident risk using native road users. The use of local users tailors the analysis using native driving behaviours that could vary in different contexts. 3.
DESIGNING THE DRIVING SIMULATOR The first part of this work involved the design and development of a modular driving simulator that would enable the analysis of traffic conditions and driving behaviors using native users. Given these needs it was imperative that the method for designing the simulator and its inherent models should have been generic, utilizing libraries of components representing assets that make up the driving conditions and infrastructure in Cyprus. Therefore, the design and development of the driving simulator utilized software packages to enhance the quality and reduce implementation time. The software applications that were used include: Unity 3D game engine, City Engine, Autodesk Maya, and Tree[d]. Unity is a 3D game engine software application that enables the development of 3D computer games and interactive virtual environments. It is a powerful 3D game development ecosystem which has a powerful rendering
with a complete set of intuitive tools and rapid workflows to create interactive 3D content. The Unity 3D game engine [6] was chosen, mainly because it homes a built-in physics engine useful for animating vehicle maneuvering. The Unity engine, like most game engines, uses a standard mesh description containing the location of all vertices that make up the object’s shape. Unity provides a physics engine and embedded collision detection algorithms that enhance the realism in the behavior of moving objects in the simulator. Moreover it provides multiple built-in shaders and effects allowing realism enhancement of the 3D virtual environment. Unity comes with a combined opportunity to change the graphical environment using an editor, or by manipulating directly with the environment in a graphical view. It also provides the designer with the ability to define behaviors though a powerful scripting language. In our case JavaScript software language was used to define the interactivity between the user and assets of the simulator. The main steps followed for the design of the simulation environment are listed below: (1) Modeling, texturing and animation of 3D (static and moving) objects: (a) Creating road network and buildings using ESRI CityEngine (b) Modeling assets in Autodesk Maya (c) Modeling vegetation using tree[d] (d) Composition of the scene using the above mentioned 3D models in Unity3D (2) Enhancing realism simulating lighting conditions, shadows, atmospheric effects and sound effects within Unity3D (3) Adding interactivity within Unity3D The first problem was the modeling of the road network. To achieve this we extracted a section of the Limassol road network using OpenStreetMap by cropping the area of interest using a polygon on the map. Subsequently the extracted XML file was imported into the CityEngine application. ESRI CityEngine is a 3D procedural modeling software application, specializing in the generation of 3D urban environments through the manipulation of objects and existing GIS data. In our case City Engine was used to import the XML file from openstreetmaps. Subsequently the 2D format of the map was converted into 3D using the tools CGA Shape Grammar. Through the use of the grammar, the tool’s codes are diversified as needed until the required result was achieved. The final model was exported into fbx format that is recognized by Unity.
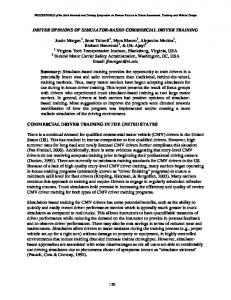
Figure 1. The GIS model of the black spot and its realization in the driving simulator below The third software application that was utilized is Autodesk Maya. This was chosen for 3D modeling and animation. Maya is a graphics software that provides a comprehensive feature-set for 3D computer animation, modeling, rendering, and compositing on a highly extensible production platform. Maya was utilized for development of the vehicles and other assets (e.g. traffic lights, advertisement billboards) that have been imported into the game engine. The next step after the development of the city model was the specification of the static and dynamic models, that refer to traffic lights, street lamps, street signs, the traffic signs, road stakes and advertising billboards. In the case of advertising billboards static and dynamic model have been used to refer to static and motion-based advertisements. These models were designed in Autodesk Maya. For all the 3D models used in the simulator, attention was paid to keep the geometric complexity relatively low, thus allowing us to have the simulator running in high frame rates. Additional car assets have been imported in the simulator through car models, existing in digital libraries, to provide variety. The imported car models were modified accordingly to abide with the regulations of the Cypriot authorities that state that the steering wheel has to be on the right hand side. The selection of the car models was based on the type and brands that are used in Cyprus currently. This was a criterion so as to enhance the realism factor of the simulator.
Additional color modifications and textures manipulations helped the design of car models become more realistic. For the development of the surrounding environment the tree[d] software was used that specializes in tree design. The tool was utilized to design trees that replicate the actual vegetation. 3D models of three different types of trees, simulating existing vegetation in the area, were exported from tree[d] and imported in Unity.
Figure 2-The user interface of the developed driving simulator The final part for the environment of the simulator was the specification of traffic routing. For this task Maya software was utilized to create cars movements as overlay animation. Firstly, the customized city model was imported into Maya and the traffic cars were added accordingly. To have a realistic view of the cars while moving, their wheels were manipulated using MEL scripting language, the scripting language of Expression Editor, to make them rotate according to speed. The movement of cars was achieved through the Motion Path. Upon specifying the motion-path cars were imported to Unity software. The paths specified were based on a preliminary analysis of the cars routing on the selected black spot at the time that the majority of the accidents occur to recreate the conditions that maximize the likelihood of an accident occurring. Besides the development of the simulator’s 3D virtual environment other important aspects are controlling dynamic conditions in the environment and the interactivity between user and simulator. These were addressed within Unity3D using JavaScript language. The user is able to control the navigation of the vehicle, by changing its direction and speed. Interactivity is also provided in a higher level. Taking into account that the simulator may be used by the proper authorities to perform experiments for different scenarios,
we provide them with an easy way to switch between different implemented scenarios (e.g. with/without advertisement billboards) before the beginning of each experiment. 4.
REASEARCH DESIGN The intention of this study was to determine the effects of roadside advertising (billboards) and traffic signaling on driver attention and crash risk at an accident black spot in Limassol-Cyprus. To investigate these aspects in was imperative to design and develop the driving simulator and the corresponding road infrastructure model as illustrated in the previous section. Using this simulator, the research design then employed an experimental evaluation to test the aforementioned (and other) effects. Participants drove a prespecified route in the designed road network both with and without billboards and traffic lights at a major intersection that has been identified by the police as a safety critical point. For the billboard condition the use of static and animated advertisement was used and for the traffic signals the absence and presence of traffic lights. Figure 2 illustrates a sample screenshot of the virtual road design in Unity from first-person perspective. Prior to the experiment participates were familiarized with the simulator and briefed of the task that they had to perform. The road network used for simulator training was different from the model used during the experiment. Each participant had to complete a set of four scenarios to cover the different combinations of experimental conditions: with/without traffic lights and with/without animated advertisements. Data collected at different stages: pre-experiment, during experiment and after the experiment. The preexperiment data collection stage concentrated on participants demographics, driving experience and historical data relating to driving. The post experiment data collection focused on recall of advertisement types and location. During the drivers’ engagement with the experimental conditions, various information was recorded including driver workload, as manifested by lane position deviation, number of lane departures, , crash location and speed. The method used to capture the data during the experiment was observation, video recording of each participant and post experiment video analysis. To facilitate the data collection task the road was divided into 7 sections as illustrated in figure 3. The specification of these sections was based on infrastructural properties and billboard locations. With the completion of the experiment the analyst studied each video
and recorded for each participant the speed, lane deviation, and accident occurrence at each road section. It should be noted that the observations were stopped once an accident occurred.
participants (e.g. gender, age, driving experience) as well as their behavioral measures during the four experimental conditions (e.g. accident occurrence, speed, lane change, etc). The design, is illustrated schematically in Table 1, and shows how we resulted with 80 (correlated) observations in total. Table 1: the repeated measures experimental design Traffic Lights YES
Traffic Lights NO
Advertisement Advertisement Advertisement Advertisement Static Animated Static Animated Subject 1-20
Figure 3The division of the road into sections
Figure 4 An aerial view of the intersection that is identified by the police as accident prone There were 20 participants (10 male) in the present study, with a mean age of 24 (SD = 4.0). All participants had held a full driving license. The age range of participants that took part in the experiment was based on age related data of the black spot under study. All participants were Cypriot residents and hence familiar with the left-hand traffic regulations. Participants were divided into two groups. The first group concerned residents of Limassol and the second residents of other towns in Cyprus. During the experiment, participants were asked to drive as they normally would and to keep to the posted speed limits. After the experiment, participants were asked to recall if there was traffic light in the road, the type of advertisement (static/dynamic), location and content. ANALYSIS AND RESULTS As can be deducted from the aforementioned description of the experiment, this involved a repeated measures experimental design since each of the 20 took part in 4 tests/experimental conditions. The data collected during the different stages of the study were merged into one dataset, which included the necessary information for both the
Subject 1-20
Subject 1-20
Subject 1-20
Both descriptive/exploratory data analysis as well as inferential statistical analysis employing regression modeling, were applied to this dataset with the help of the widely used statistical package SPSS (version 20). Results are presented in this order. 5.1. Exploratory Analysis In this section we explore some descriptive analysis demonstrating some relationships between some background variables of interest with the outcome variable as well as some potentially confounding variables. The outcome variable of interest for this analysis is the occurrence of an accident. Out of the 80 observations in the above conditions, 25 (31.25%) accidents were recorded. The vast majority of them (24 corresponding to 96%) happened at Section D of the road. This should be considered for the interpretation of the results. However it should be noted that a new variable was constructed including information of whether an accident occurred or not, independently of location, and was used for further statistical modeling. In the remaining of this section we will explore how (a) this outcome variable is associated with the gender of participants and the two experimental conditions tested, and (b) other relevant factors, such as line deviation which are considered in the literature good predictors of accident are associated with the outcome and other background variables. Table 2 presents the association of accident occurrence with the subject’s gender. Table 2: Cross-tabulation of accident occurrence by gender Gender
5.
female Frequency
Total male
32
23
55
58.2%
41.8%
100.0%
8
17
25
32.0%
68.0%
100.0%
NO % within Accident Accident Frequency YES % within Accident
As can be seen, the majority of accidents (68%) observed are attributed to male drivers. This association was found to be statistically significant (chi-square=4.713, p=0.03). Of crucial importance is the investigation of the association between the two experimental conditions and the outcome variable of interest. Table 3 presents these associations.
Section 2. Another observation regards the increased proportions of lane deviations in the final two sections (for female drivers lane deviation appears to happen up to 44% in the case of Section F, for instance. Table 5: Lane deviation’ per section gender
N
Proportion of
Std. Error
Lane Deviation
As can be seen, there are no notable differences in the distribution of accidents when compare traffic light conditions, under the static advertisement scenario (in both cases there were 6 accidents recorded). In contrast, there are some apparent statistically significant differences (chisquare= 5.584, p=0.018).
Section A Section B Section C Section D Section E Section F
A final association to explore, as suggested in literature, is that of lane deviation as shown in Table 4. This association appears to be statistically significant (xsquare=19.369, p=0.01) but denotes the opposite of the expected trend: those with more observed deviations seem to be less prompt to accidents. Table 3:Two-way cross-tabulation between advertisement and traffic light conditions with the occurrence of accidents Advertisement
Traffic light No Frequency
Total
Yes 14
14
28
50%
50%
100%
NO % within Accident Static
Accident Frequency
6
6
12
50%
50%
100.0%
YES % within Accident Frequency
10
17
27
37%
63%
100.0%
No % within Accident Animated
Accident Frequency
10
3
13
76.9%
23.1%
100.0%
YES % within Accident Count
24
31
55
43.6%
56.4%
100.0%
NO % within Accident Total
Accident Count
16
9
25
64%
36%
100.0%
YES % within Accident
Table 4: Cross tabulation of lane deviation by accident Lane Deviation (number of sections observed) 0 Frequency
1
2
3
Total 4
20
19
8
4
4
55
36.4%
34.5%
14.5%
7.3%
7.3%
100.0%
22
1
2
0
0
25
88.0%
4.0%
8.0%
0.0%
0.0%
100.0%
42
20
10
4
4
80
52.5%
25.0%
12.5%
5.0%
5.0%
100.0%
No % within Accident Accident Frequency
Section G
t-test (p-value)
m
40
0
NA
f
40
0
NA
NA
m
40
.025
.025
-2.003
f
40
.15
.0578
(0.049)
m
40
.1000
.04804
-1.249
f
40
.2000
.06405
(0.216)
m
40
.1000
.04804
1.356
f
39
.0256
.02564
(0.179)
m
23
.0435
.04348
-1.545
f
33
.1818
.06818
(0.128)
m
23
.2609
.09362
-1.341
f
32
.4375
.08910
(0.186)
m
23
.1739
.08081
-1.864
f
32
.4063
.08821
(0.068)
5.2. A repeated measures logistic model The above associations (in Table 2 and 3), even though indicative of some patterns, have two main limitations: they fail to account for the inter-relationships between different variables, and they do not take into account the repeated measures design and the resulting correlation between the observations for each subjects. These limitations are overcome with the regression model presented in this section. Towards this direction, we employed a generalized linear modeling framework [21] to model the binary variable of interest (i.e. accident occurrence) based on various explanatory variables including the experimental conditions and participants characteristics. The appropriate model was a logistic regression model, which can also deal with the repeated nature of our experimental design. Technically, we used the mixed generalized linear modeling tool of SPSS and resulted in the following model with the main effects shown in Table 6. It should be noted that different versions of the model were run checking for the effects of other background and behavioral measures (e.g. speed and lane deviation) however these were not found to be effective for the response variable (i.e. accident occurrence). The model below is considered to be robust and concise accounting for both experimental conditions and their interaction and gender which was found to have a significant effect.
Yes % within Accident Count Total % within Accident
A further exploration of ‘lane deviation’ was performed, this time for each section separately. Table 5 shows the mean proportions of deviation (which can be explained as percentages per group) for the two gender groups at each section. T-test was also performed for the differences between the two mean proportions, and it can be seen that the only statistically significant difference is observed in
Table 6:A model for predicting accident occurrence Variables Coefficient (B) Constant -1.226 Traffic Light (Ref: No) 1.883 Advertisement (Ref: Static) 0.948 TrafLight*Advert -1.883 Gender (ref:Female) -1.314
Significance 0.031 0.014 0.218 0.083 0.02
Exp (B) 3.407 6.573 2.58 0.152 0.269
The parameters of the variables in regards to their effect to the response variable are interpreted similarly to those from a multiple logistic regression (i.e. based on the change in odds ratio using the exponential of the coefficient). For
instance, what we could say for gender given the above results is that, controlling for all other variables in the model, when we move from male to female participant we reduce the odds of an accident by 0.269 (in other words, for males the odds of accident are almost 4 times those of female). Similarly the odds of an accident are increased by more than 6 when we remove the traffic lights.
[5] Gregoriades, A., Sutcliffe, A., Papageorgiou, G., Louvieris, P. “HumanCentred Safety Analysis of Prospective Road Designs”, IEEE Transactions on Systems, Man and Cybernetics, Part A, 40, no 2, (2010): 236-250.
6.
CONCLUSIONS To our knowledge this is the first study that was conducted in Cyprus for black spot analysis using a driving simulator and local road users. The method provides local authorities with a cost effective solution that enables the involvement of native driving users for the analysis of local driving behaviors and road design challenges. The method enables the design and customization of the road infrastructure for what-if analyses in a modular fashion. This enables the design of the experimental settings for the analysis of a variety of conditions such as the use of dynamic and static advertisement of billboards in straightforward fashion.
[8] Williams, J. C. “A data-based method for assessing and reducing human error to improve operational performance,” in Proc. Human Factors Power Plants, Monterey, CA, (1988): 436–450.
Preliminary results from this study highlight a weak relationship between lateral deviations of road users and advertisement. Overall the results highlight a significant difference between genders on accident likelihood.
[13] Fuller, R. “Towards a general theory of driver behaviour,” Accident Anal. Prev. 37, no 3 (2005): 461–472.
Limitations of this work concentrate on realism and immersion factors that laboratory methods are suffering from. Simulated settings currently do not offer the resolution of the real world, and so these may affect driving behavior. Future work includes the use of immersive driving conditions using virtual reality. This will enhance realism and hence improve observational accuracy.
[15] Dingus, T. A., Klauer, S. G., Neale, V. L., Petersen, A., Lee, S. E., Sudweeks, J., et al. The 100-car naturalistic driving study: Phase II – Results of the 100-car field experiment (report no. DOT HS 810 593). Washington, DC: National Highway Traffic Safety Administration, 2006.
7.
REFERENCES
[6] Gregoriades A., and Sutcliffe, A. “Workload prediction for improved design and reliability of complex systems,” Reliab. Eng. Syst. Saf. 39, no 4 (2007): 530–549. [7] Bailey, R. Human Performance Engineering, (Englewood Cliffs, NJ: Prentice-Hall, 1996).
[9] Endlsey, M. R. “Toward a theory of situation awareness in dynamicsystems,” Hum. Factors 37, no. 1 (1995): 32–64. [10] Norman, D. The Psychology of Everyday Things, (New York: Basic Books, 1988). [11] Davenne, D., Lericollais, R., Sagaspe, P., Taillard, J., Gauthier, A., Espié, S., Philip, P. “Reliability of simulator driving tool for evaluation of sleepiness, fatigue and driving performance,” Accident Analysis and Prevention 45, (2012): 677-682. [12] Miller, G. “The magic number seven plus or minus two: Some limits on our capacity to process information,” Psychol. Rev. 63, no. 2 (1956): 81–97.
[14] Fuller, R. and Santos, J. Human Factors for Highway Engineers, (New York: Pergamon, 2002).
[16] Jamson, A. H., Westerman, S. J., Hockey, G. R. J., & Carsten, O. M. J., “Speech-based e-mail and driver behaviour: Effects of an in-vehicle message system interface,” Human Factors 46, (2004): 625–639. [17] Young, K. L., Regan, M. A., & Hammer, M. Driver distraction: A review of the literature (report no. 206). Victoria, Australia: Monash University Accident Research Centre, 2003.
[1] Konstantopoulos, P., Chapman, P., Crundall, D. “Driver’s visual attention as a function of driving experience and visibility. Using a driving simulator to explore driver’s eye movements in day, night and rain driving,” Accident Analysis and Prevention 42, (2010): 827-834.
[18] Young, M. S., Mahfoud, J. M., Stanton, N. A., Salmon, P. M., Jenkins, D. P., Walker, G. H. “Conflicts of interest: The implications of roadside advertising for driver attention,” Transportation Research 12, (2009): 381388, 2009.
[2] Eksler V., Lassarre, S., Thomas, I. “Regional analysis of road mortality in Europe,” Public Health 122, (2008): 826-837.
[19] Holohan, C., Culler, R., and Wilcox, B. “Effects of visual distraction on reaction time in a simulated traffic environment,” Human Factors 20, (1978): 409–413.
[3] Hollnagel, E., Woods, D., Leveson, N. Resilience Engineering and Management, (Aldershot, U.K.: Ashgate, 2004). [4] Montella, A., Ariab, M., D’Ambrosiob, A., Galantea, F., Maurielloa, F., Pernettic. M. “Simulator evaluation of drivers’ speed, deceleration and lateral position at rural intersections in relation to different perceptual cues,” Accident Analysis and Prevention 43, (2010): 2072-2084.
[20] Horberry, T., Castro, C., Martos, F., and Mertova, P. An introduction to transport signs and overview of this book. In C. Castro & T. Horberry (Eds.), The human factors of transport signs (pp. 1–15). Boca Raton, FL: CRC Press, 2004. [21] Hutcheson, G. D. and Sofroniou, N. The Multivariate Social Scientist: Introductory statistics using generalized linear models. Sage Publications, 1999.