298
IEEE TRANSACTIONS ON NEURAL SYSTEMS AND REHABILITATION ENGINEERING, VOL. 16, NO. 3, JUNE 2008
Design of a Modular and Low-Latency Virtual-Environment Platform for Applications in Motor Adaptation Research, Neurological Disorders, and Neurorehabilitation Daniel J. Myall, Michael R. MacAskill, Paul R. Davidson, Member, IEEE, Tim J. Anderson, and Richard D. Jones, Senior Member, IEEE
Abstract—We have developed a modular virtual environment platform for movement research and rehabilitation. The system uses several networked computers running Linux to share computation. An electromagnetic tracker is the primary position tracker and both a head-mounted display and stereo goggles are used for visual display. System software is written in a combination of C++, JAVA, and Python and makes considerable use of the open-source toolkits VR Juggler and OpenSceneGraph. These are integrated with additional toolkits and custom modules written specifically for the study of motor control and rehabilitation. The system performs well with low latency, accurate calibration, and a consistently high graphics update rate. Preliminary applications have confirmed that the system is a powerful tool for sensory-motor investigation and has considerable potential as a tool for neurorehabilitation. Its primary advantage over other systems is its ability to utilize different display and input devices, and run a range of experiments simply by changing XML configuration files. Additionally, the use of powerful open-source libraries provides a feature-rich foundation for advanced features and low-cost duplication. Further work and experiments are needed to extend, further validate, and fully utilize this platform. Manuscript received July 17, 2007; revised November 19, 2007; accepted December 22, 2007. The work of D. J. Myall was supported the University of Otago and the Christchurch Neurotechnology Research Programme (CNRP). The work of M. R. MacAskill was supported by the New Zealand Neurological Foundation and the Foundation for Research, Science, and Technology (FRST). The work of P. R. Davidson, T. J. Anderson, and R. D. Jones was supported by FRST. The funding for equipment was provided by the Canterbury Medical Research Foundation, FRST, and CNRP. D. J. Myall and M. R. MacAskill are with Van der Veer Institute for Parkinson’s and Brain Research, Christchurch 8011, New Zealand and also with the Department of Medicine, University of Otago, Christchurch, Christchurch 8140, New Zealand (e-mail:
[email protected];
[email protected]). P. R. Davidson was with the Department of Medical Physics and Bioengineering, Canterbury District Health Board, Christchurch 8140, New Zealand. He is now with S.L.I. Systems Inc., Christchurch 8011, New Zealand (e-mail:
[email protected]). T. J. Anderson is with Van der Veer Institute for Parkinson’s and Brain Research, Christchurch 8011, New Zealand, and also with the Department of Medicine, University of Otago, Christchurch, Christchurch 8140, New Zealand, and also with the Department of Neurology, Canterbury District Health Board, Christchurch 8140, New Zealand (e-mail:
[email protected]). R. D. Jones is with the Van der Veer Institute for Parkinson’s and Brain Research, Christchurch 8011, New Zealand, and also with the Department of Medicine, University of Otago, Christchurch, Christchurch 8140, New Zealand, and also with Department of Medical Physics and Bioengineering, Canterbury District Health Board, Christchurch 8140, New Zealand, and also with the Department of Electrical and Computer Engineering, University of Canterbury, Christchurch 8140, New Zealand (e-mail:
[email protected]). Color versions of one or more of the figures in this paper are available online at http://ieeexplore.ieee.org. Digital Object Identifier 10.1109/TNSRE.2008.922676
Index Terms—Calibration, motor adaptation, neurological disorders, Parkinson’s disease, rehabilitation, virtual reality.
I. INTRODUCTION VIRTUAL ENVIRONMENT (VE) is a computer-generated environment, providing visual, auditory, and/or haptic feedback which responds to actions of individuals interacting with it [1]. VEs are being used for training, performance measurement, entertainment, teleoperation, and rehabilitation. In the area of motor control and motor rehabilitation, several motivations have emerged for the use of VEs. First, the hardware and methods used to gather the input data for interactive VEs provide a feature-rich collection of tools to measure the movements of participants. These span a range of technologies (see [2] for a review), including optical, electromagnetic, mechanical, acoustic, and inertial, each with their own benefits. They offer the flexibility for a range of multijoint movement to be quantified with 6 degrees-of-freedom (DOF) (three translational and three rotational DOF) with update rates and accuracy dependent on the hardware in use. This hardware can be used to measure finger movements, head movement, upper-limb movements, and motions of rigid body segments during whole-body tasks. Second, VEs allow complete control over stimulus display and also make it possible to provide novel stimuli and information not practical in the real world. For example, a movement might be guided by overlaying information on the path a person should follow in the same spatial reference frame [3]. Third, due to complete control over stimulus display, an artificial visual environment provided by a VE is an ideal way to implement changes in sensory feedback. In a VE, feedback can be manipulated in a complex way in both the temporal and spatial domains, which is difficult to achieve in real-world experiments. A common example of modifying feedback in the spatial domain is to change the visually perceived gain of hand movements [4]. Our system has potential for several areas of neurorehabilitation but has been evaluated in the context of applications for Parkinson’s disease. The most prominent symptoms in this disorder are movement related [5], including bradykinesia (slowing of movements), hypometria (movements smaller than they should be), akinesia (difficulty initiating movements), and
A
1534-4320/$25.00 © 2008 IEEE
MYALL et al.: DESIGN OF A MODULAR AND LOW-LATENCY VIRTUAL-ENVIRONMENT PLATFORM FOR APPLICATIONS
rest tremor, all which can be accurately quantified in a VE. Additionally, the observation that several aspects of the movements of people with Parkinson’s disease can be influenced by changes to visual and auditory input [6] makes VEs particularly useful to investigate and potentially rehabilitate people with Parkinson’s disease. For example, augmented-reality visual stimuli are being investigated to help overcome difficulties with gait [7]–[9]. II. TECHNICAL REQUIREMENTS In order to generate an effective visual VE (with or without auditory and/or haptic feedback) intended for movement research, there are several requirements that the hardware and software should satisfy. First, accurate measurement of object positions is of critical importance to gather data that can be quantitatively analyzed. This requires appropriate positional tracking system(s) to be used, calibration to be checked, and a calibration correction process to be implemented if needed. Second, visual stimuli and feedback should appear in their correct positions and have a correct scale, so that there can be confidence that participants have received correct and consistent stimuli. To achieve this, an appropriate display system needs to be used, an accurate model of the display is required (i.e., the position, angle, and size of the display surfaces in the world), an accurate location of the participant’s eyes is needed, display calibration has to be checked, and a display calibration process may need to be implemented. Third, the time between a movement being made and the resulting feedback (end-to-end latency) should be minimal. This latency comprises sampling delays arising from the sampling rate of sensors and refresh rate of displays, and delays associated with sensor hardware, protocols, processing time, and the response time of displays. For example, typical systems can have a data collection rate of 60–240 Hz, a display update rate of 60–120 Hz, and a total latency of 30–80 ms, depending on the components used in the system [10], [11]. This can have a substantial adverse effect on the realism of the VE [12]. A low latency is even more important where the aim is to have participants adapt to a feedback manipulation in a VE. For example, if the latency is greater than 300 ms there is no observable adaptation after effect to feedback manipulations [13], and even a latency of 50–60 ms has a severe effect on adaptation after-effects [14], [15]. The sensorimotor mismatch caused by latency increases the occurrence of motion sickness, particularly with tracked headmounted displays. In these, a “swimming effect” is introduced in which there is a noticeable delay before a change in head position is reflected in the display system [16]. Thus, when a head movement starts there is a delay before the scene begins updating and, conversely, when the head movement stops the scene is still moving. For these reasons it is important to minimize latency in a VE, especially if it is being used to examine or induce motor adaptation. This can be achieved through the use of appropriate hardware, together with prediction to compensate for any residual latency in the system [17]–[19]. Although most predictors will alter the frequency content of the output and add a small nonlinear component, overall performance improves with the use of
299
prediction [20], with delays appearing, at least subjectively, to be eliminated. Fourth, the performance of the graphics system also plays a part in impacting upon the use of VEs. A slow graphics updaterate contributes to latency and can make moving objects or responses appear to move discretely instead of in a continuous path. This graphics update rate also needs to be consistent, as random large delays between screen updates compromise the realism of VE and can affect the behavior of participants in the system. Fifth, for a system to be useful for a wide range of tasks it needs to be easily configured for different devices and experimental protocols. Many VE platforms can only be used for a single type of task, as they are intrinsically restricted to specific hardware. To overcome this, layers of abstraction can be used to separate the application from the input and output devices. Additionally, instead of programming the display of stimuli and appropriate responses into the program, these can be specified in configuration files. Finally, to make the platform available to a range of groups with varying financial resources, the system needs to find a balance between achieving the above goals and reducing the total cost of duplicating the system or, even better, incorporate novel methods to reduce cost without affecting realization of the above goals. Here, we provide an overview of the hardware and software used to develop a platform for VEs for use in motor research into neurological disorders and rehabilitation, along with example applications including preliminary evaluations of people with Parkinson’s disease. III. HARDWARE Hardware for the VE platform, part of the Movement and Virtual Environment Laboratory (MoVELab), was chosen for two VE display systems (Fig. 1). The first is a near-field (NF) system [21], which provides a small 3-D virtual display area that falls completely within the reach of a user and is useful for tasks involving the upper-limbs. The second is a gait-and-posture (GAP) system, which uses a head-mounted display and provides a large VE where the user has freedom of body movement. Both setups have been created to meet requirements of different VEs, but they share a large proportion of their hardware and software. The primary rendering for both systems was set up on separate machines to allow both systems to be used simultaneously. The NF system has two CPUs (AMD Athlon 2000 MP), 2 GB memory, a quad-buffered AGP card (Nvidia Quadro4 750 XGL), and PCI video card (Nvidia MX440). The GAP system has one dual-core CPU (Athlon 3000+ X2), 2 GB memory, and two video cards (Nvidia 6600GT PCIe), each with dual outputs. The GAP system utilizes a V8 head-mounted display (Virtual Research, Aptos, CA). This has a resolution of 640 480, a diagonal field of view of 60 , a refresh rate of 60 Hz, and a display response time of around 60 ms. The NF system utilizes a 19-in monitor (Viewsonic P95+) 768 and refresh rate of 166 Hz in at a resolution of 1024 combination with StereoGraphics (San Rafael, CA) CrystalEyes synchronized to the screen refresh rate to provide stereo vision. This gives each eye an image that refreshes at 83 Hz.
300
IEEE TRANSACTIONS ON NEURAL SYSTEMS AND REHABILITATION ENGINEERING, VOL. 16, NO. 3, JUNE 2008
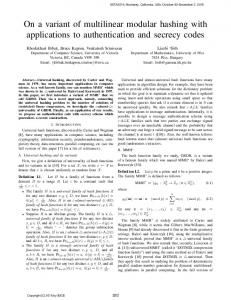
Fig. 1. VE platform consists of two virtual-display environments: a NF system and a GAP system. Both systems share input devices although some input devices are tailored more to one environment (as indicated by the setup to which they are linked). Solid dark lines indicate physical connections. Dotted lines indicate the environment that a particular piece of equipment is used in. Dashed–dotted lines indicate network connections.
To track movements in 3-D space, a Polhemus (Colchester, VT) Liberty electromagnetic tracking system with eight sensors sampling at 240 Hz each is used. Two different transmitters are utilized: a TX4, which provides excellent accuracy over a small range for the NF setup, and a Long Ranger, which covers a greater area but with reduced accuracy for use with the GAP system. An ac electromagnetic tracking system was selected as, despite needing care and software compensation to counteract distortions due to metallic objects, it is relatively immune to electric and magnetic interference. Also, in comparison to optical systems, it does not suffer occlusion problems and each sensor provides full 6 DOF data. The sensors are placed according to the application. For example, in the NF system the position of the arm is of most interest, and arm position is measured by electromagnetic sensors placed on the fingertip, hand, forearm, upper arm, and shoulder. In the GAP system, head position is measured by a sensor attached to the head-mounted display. Other sensors can be attached to the torso and limbs to provide measures of movement of the entire body. 5DT Data Glove 5 (5DT, Pretoria, South Africa) are used to record finger flexion.
Eye movement monitoring is needed to ensure participants follow instructions during tasks in which participants have to stay fixated on a home target. To achieve this, a miniature camera is used to monitor the left eye. Four infrared LEDs inside the stereo goggles provide extra illumination for the infrared-sensitive camera in the dark environment. The output of this camera is displayed on a small black-and-white CRT monitor and can also be recorded via a video-capture card in a dedicated video-capture PC. This video stream is synchronized with a timestamp from the central application. In the NF environment, auditory output is provided by standard computer stereo speakers. In the GAP system, a pair of Sennheiser stereo earphones mounted on the head-mounted display provides the user with audio. The apparatus used to combine the components of the NF system is shown on the left side in Fig. 1. Wood was the main construction material to reduce interference with the electromagnetic tracker system, with the TX4 transmitter mounted at the centre rear of the frame (for maximal strength and accuracy over the working area). The monitor is mounted above the participant with the screen pointing to and parallel with the floor. The participant sits on a
MYALL et al.: DESIGN OF A MODULAR AND LOW-LATENCY VIRTUAL-ENVIRONMENT PLATFORM FOR APPLICATIONS
chair in front of the experimental frame, with the height of the chair adjusted so that the nasion is aligned with the top of the nose piece in the CrystalEyes goggles. The participant views the virtual 3-D workspace by placing their head into goggles (keeping on their own glasses if required) which also serves to keep the head in a fixed position. The participant then looks at a half-silvered mirror which reflects the monitor screen from above, giving the illusion of a 3-D workspace. A half-silvered mirror allows the participant to see their arm and the computer-generated images or, by using an occlusion panel, only the computer-generated images. The mirror allows the superposition of the real and virtual spaces, without the participant’s hand obscuring the virtual view. The mirror also facilitates display calibration, as the position of real objects can be compared with the perceived position of virtual objects. The monitor is set to its highest brightness to make the environment easier to see via the half-silvered mirror. The room is in darkness to remove flicker and increase the contrast of the virtual environment. IV. SOFTWARE The operating system is Debian GNU/Linux. Several open-source libraries are used in the system, with the primary one being VR Juggler [22]. VR Juggler provides the core system for virtual environments and provides the basis for abstraction of input and output which means that an application can be written independent of the exact input hardware or display hardware. It also provides the basis for the modularity of the system, so that components can be added and removed as needed without large changes to code. OpenSceneGraph integrates with VR Juggler and manages the virtual graphical world. It is a powerful and efficient scene graph which allows models in many different 3-D file formats to be easily loaded into the virtual environment. Other libraries utilized include VRPN (communicates with input devices) [23], [24], HDF5 (a storage container format for saving data) [25], GSL (mathematical routines) [26], and wxWidgets (graphical user interface) [27], all integrated as in Fig. 2. The main application [28] is written in a combination of C++, Java, and Python. Several modules were developed to integrate the different libraries, perform calibrations, implement custom display and tracker transformations, parse configuration files, control experiments, present stimuli, and save data. The main application is designed such that it has several threads to utilize multiple processing cores, each thread responsible for a different component of the application such as drawing to different displays, collecting data, running the experiment, controlling visual and auditory stimuli, and saving data. To make sure that data is processed quickly and frames are rendered on-time, soft-realtime methods are used in which having a calculation performed within a certain timeframe is desirable but not critical. A collection of XML files are used to configure the application. These files specify the hardware setup, experiment parameters, participant parameters, session settings, and trial and stimulus specifications. The Polhemus Liberty system came only with drivers for Microsoft Windows. Hence we developed a Linux driver for the 1http://www.openscenegraph.org/
301
Polhemus system. The Polhemus Liberty tracker is interfaced via USB to an input machine using a custom Linux-kernel module optimized for low latency. A custom Liberty driver written for the VRPN input library collects the data from Liberty via the USB driver and sends it over the network to the main experimental machine. These two components are freely available and distributed with the Liberty Driver CD and VRPN [24] releases. The Liberty system is connected to a separate input machine which runs a real-time kernel to minimize any latency in the USB subsystem. Connecting the input devices to a separate machine allows extra computational overheads needed for research and during system development, such as extra logging of performance and data, without having an impact on the main control and rendering processes. Additionally, having Liberty and other input devices on a separate machine allows the input devices to be easily shared between multiple systems. In the GAP system, tracker calibration is implemented using the NCSA calibration library [29]. A grid of points are sampled through the work area and are used to map the measured data to the location and orientation of the sensor in the real world. To calibrate the display in the NF system, virtual targets are shown, the user aligns a sensor to match the virtual target, and several samples of the position of the sensor are recorded. This allows the mismatch between where the virtual object should appear, and where it is perceived, to be measured. Assuming only linear differences (i.e., translation or scaling), a display calibration matrix can be constructed via a process of numerical minimization. This matrix transforms the virtual world positions so they are displayed in the correct real world positions when shown in the VE. Because of intrinsic latencies in the hardware, a double-exponential predictive filter [17], [18] is used to compensate for delays. This algorithm has a relatively simple implementation, is computationally efficient, and achieves a prediction performance close to more computationally intensive algorithms [19]. A. Virtual Environments The use of VR Juggler and OpenSceneGraph allows a wide range of existing graphical environments to be easily used. All VEs are rendered utilizing anti-aliasing to reduce the appearance of artifacts in the display including jagged edges and highfrequency noise. In the NF system, the primary VE is a simple workspace with a blue background to reduce the effect of ghosting, an effect where the image intended for one eye is seen slightly by the other eye due to a longer decay time of certain phosphors used in many commercial CRT monitors. The usable workspace, defining both the real and virtual workspace which occupy the same volume of space, is a parallelepiped mm wide mm deep mm high. Visual objects such as spheres, targets, text, and 3-D models can be placed at any location in this workspace [Fig. 3(a)]. In this environment, the Cartesian coordinate system has an origin at the centre of the CrystalEyes goggles and an axis arrangement when looking through the gogright and away from centre of goggles (horizontal gles of up (vertical). plane) and
302
IEEE TRANSACTIONS ON NEURAL SYSTEMS AND REHABILITATION ENGINEERING, VOL. 16, NO. 3, JUNE 2008
Fig. 2. Diagram showing how the software components interact with the hardware to provide a complete VE platform. The base boxes show the components that the software is built upon. Cylinders represent sources of input. Shaded boxes represent output. Solid lines represent interaction between components. Dashed lines show the flow of configuration data.
In the GAP system, with a rectangular workspace of 5300 mm long, 2400 mm wide, and 2300 mm high, several virtual environments can be used. These include a virtual model of the laboratory [Fig. 3(b)] and several arbitrary 3-D environments in formats supported by OpenSceneGraph. In both environments, arbitrary 3-D sounds can be utilized, including background sounds, beeps to prompt movement, and sounds played in response to a participant’s actions. B. Analysis Tools Several tools have been developed for analysing data from the system, including a graphical tool written in REALbasic and a range of scripts in Python and R. These tools are all cross-platform and allow the data to be analysed on Windows, Linux, and
Mac OS X. A useful visualization feature is that 3-D animations of the recorded movement can be made from any perspective. Additionally, stimulus information can be overlaid in the animation and multiple movements can be superimposed into the same animation sequence for direct comparison. V. VALIDATION OF PLATFORM A. Calibration Over the small work area of the NF system there were no noticeable distortions of the tracking workspace. To confirm this, two sensors were attached 100 mm apart on a piece of wood and moved throughout the real workspace and the data recorded. If the workspace is free of distortions, the distance and angle between the two sensors will stay constant throughout. The min-
MYALL et al.: DESIGN OF A MODULAR AND LOW-LATENCY VIRTUAL-ENVIRONMENT PLATFORM FOR APPLICATIONS
303
Fig. 3. (a) Top-down 2-D montage of 3-D graphical elements used in the NF system display environment. The marked items are: (A) home target, (B) text displayed during pause mode, (C) the sphere representing the user’s fingertip, (D) a target used during ballistic tests, (E) feedback of velocity during ballistic tests, (F) a target used during reaching tests, (G) feedback of movement speed. (b) A model of the MoVELab used in the GAP system.
imum distance recorded between the two sensors was 97 mm and the maximum was 102 mm. 98.7% of the measurements were between 99 and 101 mm. Further tracker calibration routines are unlikely to improve this small level of distortion [29]. Display calibration of the NF system was examined by looking at the virtual world with the occlusion panel removed and seeing how closely the position of the sensor matched up with the virtual object rendered to match it. Over 27 evenly-spaced points in the workspace, the mean normalized euclidean error was 2.4 mm, with a maximum error of 6 mm at the top left-hand corner. In the GAP system large distortions are present in the tracking field and distortion mapping has been implemented [29]. The current setup does not allow display calibration of the GAP system to be examined, as the real world and virtual environment cannot be viewed simultaneously. B. Latency and Compensation A double-exponential prediction filter was used to estimate the level of perceptual latency by using an iterative bisection method to find a prediction level that minimized perceptual problems. The parameter [18], [19] in the double exponential filter, which determines the rate at which the influence of a position of a measurement decays, was set at 0.5 which works well for movements that that don’t have large accelerations. In the NF system, the perceptual latency was determined from the prediction time that caused the sensor and attached virtual object to stay together during a movement along a straight line in , with the initial the virtual environment at a speed of 0.5 end-points of latency chosen at 22 and 38 ms based upon the expected latency of the system (tracker 4 ms, communications 2 ms, software and rendering 8–16 ms, refresh rate 6–12 ms, and monitor delay 2–4 ms). In the GAP system, the level of perceptual latency was estimated by finding the prediction value that minimized the subjective swimming effect of the display without causing overshoot, with the initial endpoints chosen at 60 and 104 ms (similar composition to NF setup except that the refresh rate adds 16–32 ms and LCD delay in the head-mounted display adds 30–50 ms).
Training and test sets of tracking data were collected of typical movements in both systems. The optimal was determined by iterating from 0.01 to 0.99 and selecting the that minimized the prediction error. The accuracy of prediction was then determined by calculating the residual error for test data sets from each system, with the filter predicting the position s in the future. In the NF setup, prediction of the position of objects is most important for our current applications and, hence, spheres are used which give no clue about their orientation. In the GAP system, prediction of orientation is also important, as rotations of the head have a large effect on the view in the head-mounted display. In the NF system, the use of equipment with high update rates and low delays, along with software optimized for minimizing processing latency, kept end-to-end system latency low. Because the real-world movement and computer-generated display of the movement are superimposed, when the occlusion panel is removed any delay between making a movement and the display being updated is clearly obvious. With no prediction filter, the virtual sphere can lag 20–30 mm behind during fast movements. Predicting 32 ms ahead, the virtual object representing the sensor in the virtual world appears to follows the path of the sensor accurately. With the test set of hand movements, an between 0.3 and 0.6 provided similar reductions in error, with a larger slightly increasing noise but providing quicker responses to changes in movement. The mean absolute error was 1.2 mm with prediction versus 5.9 mm without, giving an 80% reduction in error (Fig. 4). In the GAP system, the lower update rate and slow response of the display resulted in an end-to-end latency that induced a noticeable swimming effect. The filter needed to predict close to 84 ms to compensate for the large delays, with the exact value changing due to the different response rate for different intensities and colors in the head-mounted display. For the test dataset samples collected using the head-mounted display, the mean absolute error in position decreased from 14 to 5 mm and the mean absolute orientation error from 1.3 to 0.4 , a 66% reduction in error in both cases. When using the head-mounted display, the effect of the prediction filter is
304
IEEE TRANSACTIONS ON NEURAL SYSTEMS AND REHABILITATION ENGINEERING, VOL. 16, NO. 3, JUNE 2008
Fig. 4. (a) A 600 ms sample of movement data recorded in the NF system, along with predicted location 32 ms in the future and location without prediction. The prediction loses track slightly during acceleration and deceleration but, in general, is able to predict the future location well. (b) A boxplot displaying the error in the location of a virtual object attached to a sensor in the NF system for 24.0 s of data, with and without prediction. The middle line is the median, the box is the inter-quartile range, the whiskers are the largest and smallest non-outlier values, and the circles outliers (defined as values than 1.5 times inter-quartile range from the median).
>
dramatic, with a near complete elimination of the subjective swimming effect. A relatively simple filter such as double exponential decay is able to compensate for a large proportion of latency in two virtual display environments, in which there are quite different prediction depths and types of movements. The improvement makes a large qualitative difference to the usability of both systems. C. Graphical Performance Graphical performance of the NF system was evaluated by running an 82-min experimental session of reaching trials. During these trials, data was saved in the background and the graphical user interface was actively used by the experimenter. In the GAP system, graphical performance was measured while a participant navigated and interacted with the medieval town provided by VR Juggler TemplateApps [22] for 81 min. In the NF system with a display refresh rate of 166 Hz, and an image for each eye at 83 Hz, the time between successive frames in a perfect system with SYNC_TO_VBLANK (where the screen draw is sychronized with the buffer swap) would be a constant 6.0 ms. In the GAP system, the screen refresh rate is 60 Hz and, hence, the time between frames should be a constant 16.6 ms. Any deviation from these values is known as rendering jitter. In the NF system, 820 704 frames were drawn during the 82-min evaluation session. The times between the first two frames were discarded, as it takes a few frames for the program to become completely initialized. Of the remaining frames the duration to the next frame was 6.0 ms for all but seven frames, in which the duration was 12 ms (i.e., a single frame had been missed). Average CPU usage was 42%. In the GAP system, 289 806 frames were drawn during the 81-min evaluation session The times between the first 13 frames
were discarded. Of the remaining frames, the duration until the next frame was 16.6 ms for all but 14 frames, where the duration was 33.3 ms. Average CPU usage was 64%. These results indicate that the system can, for the most part, keep up with the demands of the application and miss only a minor number of frames. This is particularly important for the NF system as any delay in rendering the next frame is easily perceptible in the VE because the sphere representing the location of the sensor on the index finger stalls or jumps between locations. D. Pilot Application 1: Quantification of Movement In the NF system, people with Parkinson’s disease and agematched controls performed an arm movement task in which they moved between two fixed stimuli on a horizontal line. The experimental procedures were reviewed and approved by the Canterbury Ethics Committee. Informed consent was obtained prior to the experimental procedure. A session consisted of four trials, and in each trial they executed 30 movements between two alternating fixed stimuli 150 mm apart. Each trial had a fixed interstimulus interval of either 750, 1000, 1400, or 2050 ms, with the order randomized between subjects. Several parameters were extracted from each movement trace, including latency (time from target onset to start of movement), primary movement duration (from the start of the movement to the end of the primary submovement, as defined by zero velocity), total movement duration (from the start of the movement to the end of all submovements), peak velocity, time from start of movement to peak velocity, primary movement amplitude (the distance of the movement at the time of the end of the primary submovement), final movement amplitude (the distance of the movement at the time of the end of all submovements), primary gain (the ratio of the amplitude of the
MYALL et al.: DESIGN OF A MODULAR AND LOW-LATENCY VIRTUAL-ENVIRONMENT PLATFORM FOR APPLICATIONS
Fig. 5. Typical responses during a predictive trial where targets (represented by solid grey lines) alternate regularly between two constant locations every 2050 ms in a horizontal direction. (a) Person with Parkinson’s disease, with markedly reduced peak velocity. (b) Aged-matched control.
primary movement to the distance between targets), final gain (the ratio of the amplitude of the final location of the movement to the distance between targets), and path length (the total length of the path taken in 3-D space between the starting and the end positions) [30]. The Parkinson’s disease group had 1) hypometric movements to the 150 mm target, with a mean primary amplitude of 146 mm compared to 151 mm for controls, 2) a reduced peak velocity of 390 mm/s compared to 660 mm/s for controls, 3) an increased path length of 172 mm compared to 155 mm for controls, and 4) decreased prediction, moving to the target 25 ms after it appeared compared to controls who moved 137 ms before the target appeared. Samples from a trial for a person from the Parkinson’s disease group and a person from the control group are shown in Fig. 5. E. Pilot Application 2: Modifying Movements via Feedback Manipulation To determine whether adaptation could be induced in the NF setup, several sessions were completed in which four participants (students aged between 22 and 29 years) performed reaching tasks. In each trial, the subject started at a home location and moved to a target that appeared at one of 15 locations placed on an arc 150 mm from the home target. The home target then reappeared and the subject returned to start the next trial. The session consisted of a baseline of 30 trials (the last 10 without visual feedback), 60 trials with the ratio between the distance moved and the actual distance shown (feedback gain) set to 0.7 (i.e., the subject had to reach further to reach the same location), a further 30 test trials in which the participant was given no feedback of their movement in the VE, and then another 15 trials where the movement gain was returned to normal and feedback given. These sessions showed that robust adaptation is possible in the system (Fig. 6). F. Pilot Application 3: Presentation of Novel Stimuli As an example of using a VE to display stimuli not easily achieved in the real world, the GAP system was used to examine the effect of a virtual field of moving 3-D spheres moving
305
slowly back and forward sinusoidally. Due to the oscillating visual input, participants will subconsciously compensate for the apparently moving world and gently sway in phase with the moving stimuli. Two healthy male students (aged 25 and 28 years) were placed in the VE and their sway responses recorded. The sway stimulus frequency of the spheres were incremented from 0.1 to 0.8 Hz until a sway response was recorded. The peak-peak amplitude of the movement of the spheres was 50 mm, and the spheres were no closer than 50 mm from the front of the subject. The movement of the spheres was in the direction the subject was facing. The spheres were white and had a radius of 100 mm. A 360 background image of snowcapped mountains was used, mapped onto a sphere of radius 30 m. For each subject, the stimuli were displayed for 30 s and the response recorded at 240 Hz. Due to the system allowing the participant to look in any direction, the primary axis of sway is not usually orthogonal to a primary axis of the coordinate system. To correct for this, principal component analysis is used to determine the primary axis of sway and transform the data to a new coordinate system. For the first participant, the peak sway response was at 0.5 Hz and for the second participant at 0.6 Hz. To a stimulus with an amplitude of 50 mm the sway response was strong, with a sway amplitude close to 50 mm (Fig. 7). VI. DISCUSSION A. Modular and Low-Latency VE System A hardware and software platform for displaying virtual environments and performing experiments has been developed. By changing only XML configuration files, a powerful and flexible system for movement analysis has been created which is able to 1) utilize arbitrary display and input devices and, hence, allow any application to generate a VE in a NF system, GAP system, or potentially many other measurement and display systems and 2) implement different stimuli and experimental paradigms. In addition, a custom-developed and freely-available high-performance Linux driver for the Polhemus Liberty system helps reduce latency in the tracking system. Accurate measurement, minimal latency, accurate registration, and robust graphical performance have been achieved in the NF system and, in part, in the GAP system. The prediction filter is an important component of the system and helps reduce the negative effects of latency, especially in the GAP system. Cost has been reduced by utilizing open-source software and, where possible, commodity hardware. Three sample applications have been used to demonstrate the robustness and utility of the system in a realistic experimental setting. B. Comparisons With Other Systems Several systems similar to our NF setup have been developed for applications in virtual reality (e.g., [10], [21], [31]) and motor control research (e.g., [32], [33]). The first NF VE system using a mirror and a stereo display utilized a Polhemus Fastrack tracking system, LCD shutter glasses, and a time-multiplexing CRT [31]. Its tracking system
306
IEEE TRANSACTIONS ON NEURAL SYSTEMS AND REHABILITATION ENGINEERING, VOL. 16, NO. 3, JUNE 2008
Fig. 6. Representative 3-D movements from a subject moving between a home position and target on the xz plane, with a movement out from the subject measured by a decrease in z, and x representing a left or right component of the movement. (a) Baseline phase in which the subject adjusted to the task and quickly learned to perform fast and accurate movements. (b) When visual feedback of finger tip position was removed, the subject was still able to perform accurate movements. There is then a phase of 60 trials when the feedback gain is set to 0.7 so that the subject has to reach further in the real world to get to the same place in the virtual world. (c) Test phase without visual feedback in which the subject continuously overshoots the target, showing that they have learned the feedback adaptation. (d) Test phase with feedback in which the subject makes a ballistic movement that overshoots the target for the first few trials and then makes a corrective movement back to the target. The horizontal lines represent the location and timings of the targets.
Fig. 7. Response of a normal subject to swaying stimuli, showing movement amplitude parallel to the 0.6 Hz field of oscillating spheres. The dashed line represents the overall stimulus motion. The side graphic is a 2-D representation of what the subject observes in the 3-D environment while wearing the head-mounted display.
suffered from warping due to interference from the CRT and substantial random noise in the tracking data. To overcome the problem with interference, systems were developed using mechanical position sensors [21], [34], [35]. The Virtual Workbench [21] is a NF VE developed for psychophysics and training
research. In this system, a PHANToM manipulandum is used for position tracking and haptic feedback. Calibration is thorough and accurate, although the latency of the system is uncertain. Other NF systems utilize optical tracking. An example of such a system is the Enhanced Virtual Hand Laboratory (EVHL)
MYALL et al.: DESIGN OF A MODULAR AND LOW-LATENCY VIRTUAL-ENVIRONMENT PLATFORM FOR APPLICATIONS
[36] for experiments in motor performance and perception. The system utilizes a half-silvered mirror, so that both the real and virtual worlds can been seen at the same time, and an occlusion panel when only the virtual world should be seen. The system has a strong focus on calibration [36], an end-to-end latency close to 50 ms, [11], and is able to track head movements. The Personal Space Station [10], [37] is similar to EVHL but aimed at wider applications including scientific visualization, training, and entertainment. The system software is based upon Linux, with a custom toolkit developed to provide the components needed to produce a virtual environment. End-to-end latency is 60 ms. There is no tracker or display calibration procedure to ensure visual objects appear in the correct location, and no prediction to compensate for latency. Our NF system has several advantages over these systems. Latency has been reduced, display quality has been increased, calibration is easier, and total system cost reduced. Our use of the Polhemus Liberty system (which provides a higher sampling rate and reduced effects from static distortions than Polhemus Fastrack), wood as a construction material, and careful placement of the tracker and CRT, has led to minimal interference between the tracker and CRT, along with the benefits of magnetic tracking of no occlusion, a large tracking space, and minimal latency. Another substantial advantage of our system comes from its software framework. Instead of developing a VE system from scratch (or utilizing an expensive commercial library that makes it costly to duplicate the system), our system uses the foundations provided by open-source VR Juggler and OpenSceneGraph, and benefits from colossal work invested in these libraries. This has provided our system with a base of abstraction and modularity, and the ability to run an application on different hardware setups by simply changing configuration files. C. Towards Neurorehabilitation and Other Clinical Applications As well as quantifying motor performance, the ability to easily automate tasks and show increased feedback gives VEs considerable potential in neurorehabilitation. VEs can also provide increased motivation for participants to continue with their rehabilitation [38]. Consequently, many studies have looked at using VEs for upper- and lower-limb rehabilitation of the motor system (see [38] for a review). Several studies have shown that neurological patients are able to improve motor performance in VEs better than, or at least comparable to, training in the real world, and that these improvements are transferable to the real world and can generalize to untrained tasks [38]–[40]. Thus, for example, VEs may prove of value in Parkinson’s disease by being able to improve initiation, speed, and accuracy of movements. Although the movement deficits can usually be improved pharmacologically by L-DOPA or dopamine receptor agonists, the benefits after prolonged treatment reduce and complications often arise [41]. VEs may provide a nonpharmacological and noninvasive rehabilitative tool to help in the reduction of some of the motor deficits. A major study is underway using our system. VEs have been used to a limited extent to examine, and attempt to improve, gait in Parkinson’s disease [9], [42].
307
This research was based on the observation that persons with Parkinson’s disease who have difficulty initiating a step can substantially overcome this when lines or small objects are placed in their path. Hence, it may be possible to utilize a VE to facilitate walking by overlaying virtual objects in the real world. In these studies, spatial stabilization was found to be critical as opposed to the realism of the VE. Although our platform is currently being used primarily for research, this research will determine the extent to which the system’s accurate registration and low-latency can facilitate motor adaptation in neurological disorders and, through this, be of value for applications in neurorehabilitation. Due to the modular design of the platform, a clinical system can be based upon the research platform configuration, with different hardware optimized to the application and desired cost. Custom configuration files for the new hardware will allow applications written for the research platform to run directly on the reduced system. Additionally, the calibration routines and prediction filter help overcome limitations that are often more severe in less expensive hardware. To further simplify a clinical system based upon the platform, the current software components could be run on a single computer with minimal loss of performance. Currently, the system can be used to accurately quantify a range of movements, with complete control over the stimuli displayed to the subject. This can be used to quantify disease progression as well as improvements due to pharmaceutical or rehabilitation intervention. Due to its modular and flexible nature, the system can be tailored to a clinician’s specific requirements and available hardware. However, the central value of the system lies in its flexible and low-latency VE. This opens tremendous opportunities for functional rehabilitation in neurological disorders such as stroke, traumatic brain injury, and Parkinson’s disease. ACKNOWLEDGMENT The authors would like to thank A. Clark, P. Steenbergen, M. Khashram, and Y. Shirakura for their help in developing components of the system. REFERENCES [1] C. Cruz-Neira, D. J. Sandin, and T. A. DeFanti, “Surround-screen projection-based virtual reality: The design and implementation of the CAVE,” in Proc. ACM SIGGRAPH (Computer Graphics), New York, Jul. 1993, pp. 135–142. [2] G. Welch and E. Foxlin, “Motion tracking: No magic bullet, but a respectable arsenal,” IEEE Comput. Graph., vol. 22, no. 6, pp. 24–38, Nov. 2002. [3] M. K. Holden, “Neurorehabilitation using ‘learning by imitation’ in virtual environments,” in Usability Evaluation Interface Design: Cognitive Engineering, Intelligent Agents Virtual Reality: Proc. HCI Int. 2001, J. Smith, G. Salvendy, D. Harris, and R. Koubek, Eds. London, U.K.: Lawrence Erlbaum , 2001, vol. 1, pp. 624–628. [4] J. Groen and P. J. Werkhoven, “Visuomotor adaptation to virtual hand position in interactive virtual environments,” Presense-Teleop. Virt., vol. 7, pp. 429–446, Oct. 1998. [5] H. Bergman and G. Deuschl, “Pathophysiology of Parkinson’s disease: From clinical neurology to basic neuroscience and back,” Movement Disorders, vol. 17, pp. S28–S40, Mar. 2002. [6] T. C. Rubinstein, N. Giladi, and J. M. Hausdorff, “The power of cueing to circumvent dopamine deficits: A review of physical therapy treatment of gait disturbances in Parkinson’s disease,” Movement Disorders, vol. 17, no. 6, pp. 1148–1160, Nov. 2002.
308
IEEE TRANSACTIONS ON NEURAL SYSTEMS AND REHABILITATION ENGINEERING, VOL. 16, NO. 3, JUNE 2008
[7] J. Prothero, “The treatment of akinesia using virtual images,” M.S. thesis, Human Interface Technol. Lab., Univ. Washington, Seattle, 1993. [8] T. Riess and S. Weghorst, “Augmented reality in the treatment of parkinson’s disease,” in Proc. Medicine Meets Virtual Reality III, K. Morgan, R. M. Satava, H. B. Sieburg, R. Mattheus, and J. P. Christensen, Eds., Amsterdam, The Netherlands, 1995, pp. 298–302, IOS Press. [9] S. Weghorst, J. Prothero, and T. Furness, “Virtual images in the treatment of Parkinson’s disease akinesia,” in Proc. Medicine Meets Virtual Reality II, San Diego, CA, Jan. 1994, pp. 242–243. [10] J. Mulder and R. van Liere, “The personal space station: Bringing interaction within reach,” in Proc. Virtual Reality Int. Conf., VRIC 2002, S. Richer, P. Richard, and B. Taravel, Eds., Jun. 2002, pp. 73–81 [Online]. Available: citeseer.ist.psu.edu/625639.html [11] C. Swindells, J. Dill, and K. Booth, “System lag tests for augmented and virtual environments,” in Proc. 13th Ann. ACM Symp. User Interface Software Technol., New York, Nov. 2000, pp. 161–170. [12] M. Meehan, S. Razzaque, M. Whitton, and F. J. Brooks, “Effect of latency on presence in stressful virtual environments,” in Proc. IEEE Virtual Reality, Los Angeles, CA, Mar. 2003, pp. 141–148. [13] R. Held, A. Efstathiou, and M. Greene, “Adaptation to displaced and delayed visual feedback from the hand,” J. Exp. Psychol., vol. 72, pp. 887–891, Dec. 1966. [14] S. Kitazawa, T. Kohno, and T. Uka, “Effects of delayed visual information on the rate and amount of prism adaptation in the human,” J. Neurosci., vol. 15, pp. 7644–7652, Nov. 1995. [15] R. Held and N. Durlach, “Telepresence, time delay and adaptation,” in Pictorial Communication in Virtual and Real Environments, S. R. Ellis, M. K. Kaiser, and A. J. Grunwald, Eds. London, U.K.: Taylor Francis, 1991, pp. 232–246. [16] F. Brooks, “What’s real about virtual reality,” IEEE Comput. Graph., vol. 19, no. 6, pp. 16–27, Nov. 1999. [17] B. J. Bowerman and R. T. O’Connell, Forecasting and Time Series an Applied Approach. Belmont, CA: Wadsworth, 1993. [18] J. LaViola, “Double exponential smoothing: An alternative to Kalman filter-based predictive tracking,” in Proc. Immersive Projection Technol. Virtual Environ., New York, May 2003, pp. 199–206, NY: ACM Press. [19] J. LaViola, “An experiment comparing double exponential smoothing and Kalman filter-based predictive tracking algorithms,” in Proc. IEEE Virtual Reality, Los Alamitos, CA, Mar. 2003, pp. 283–284. [20] J. Wu and M. Ouhyoung, “On latency compensation and its effects on head-motion trajectories in virtual environments,” Visual Comput., vol. 16, no. 2, pp. 79–90, Mar. 2000. [21] T. von Wiegand, D. Schloerb, and W. Sachtler, “Virtual workbench: Near-Field virtual environment system with applications,” PresenceTeleop. Virt. Environ., vol. 8, no. 5, pp. 492–519, Oct. 1999. [22] A. Bierbaum, C. Just, P. Hartling, K. Meinert, A. Baker, and C. CruzNeira, “VR Juggler: A virtual platform for virtual reality application development,” in Proc. IEEE Virtual Reality, Los Alamitos, CA, Mar. 2001, pp. 89–96. [23] R. Taylor, T. Hudson, A. Seeger, H. Weber, J. Juliano, and A. Helser, M. Green, C. Shaw, and W. Wang, Eds., “VRPN: A deviceindependent, network-transparent VR peripheral system,” in Proc. ACM Symp. Virtual Reality Software Technol., New York, Nov. 2001, pp. 55–61. [24] Virtual reality peripheral network (VRPN) [Online]. Available: http:// www.cs.unc.edu/Research/vrpn/ [25] M. Folk, A. Cheng, and R. McGrath, D. Mehringer, R. Plante, and D. Roberts, Eds., “HDF5: A new file format and I/O library for scientific data management,” in Proc. Astronomical Data Anal. Software Syst. VIII, San Francisco, CA, Nov. 1999, vol. 172. [26] M. Galassi, J. Davies, B. G. J. Theiler, G. Jungman, M. Booth, and F. Rossi, GNU Scientific Library Reference Manual, 2nd ed. Bristol, U.K.: Network Theory, 2005. [27] J. Smart et al., wxWidgets 2005 [Online]. Available: http://www. wxwidgets.org [28] Movement and virtual environment laboratory (MoVELab) [Online]. Available: http://www.movelab.org/ [29] V. Kindratenko, “Calibration of electromagnetic tracking devices,” Virtual Reality, vol. 4, pp. 139–150, Jun. 1999.
[30] Y. Shirakura, M. MacAskill, N. McGrane, M. Khashram, and T. Anderson, “Predictive eye and arm movement in Parkinson’s disease,” in Proc. Australian Winter Conf. Brain Res., Aug. 2006 [Online]. Available: http://www.psy.otago.ac.nz/awcbr/Abstracts/Abstracts2006.htm#Shirakura [31] C. Schmandt, “Spatial input/display correspondence in a stereoscopic computer graphic work station,” in SIGGRAPH Comput. Graph., New York, Jul. 1983, pp. 253–261. [32] H. A. Ingram, P. van Donkelaar, J. Cole, J. L. Vercher, G. M. Gauthier, and R. C. Miall, “The role of proprioception and attention in a visuomotor adaptation task,” Exp. Brain Res., vol. 132, no. 1, pp. 114–126, May 2000. [33] J. A. Saunders and D. C. Knill, “Humans use continuous visual feedback from the hand to control fast reaching movements,” Exp. Brain Res., vol. 152, no. 3, pp. 341–352, May 2003. [34] T. Poston and L. Serra, “Dextrous virtual work,” Commun. ACM, vol. 39, no. 5, pp. 37–45, May 1996. [35] S. J. Goodbody and D. M. Wolpert, “Temporal and amplitude generalization in motor learning,” J. Neurophysiol., vol. 79, no. 4, pp. 1825–1838, Apr. 1998. [36] V. Summers, K. Booth, T. Calvert, E. Graham, and C. MacKenzie, “Calibration for augmented reality experimental testbeds,” in Proc. 1999 Symp. Interactive 3-D Graph., New York, Apr. 1999, pp. 155–162. [37] R. van Liere and J. Mulder, “Virtual reality on a Linux desktop,” presented at the NLUUG, Ede, The Netherlands, Oct. 2002 [Online]. Available: citeseer.ist.psu.edu/562052.html [38] M. K. Holden, “Virtual environments for motor rehabilitation: Review,” Cyberpsychol. Behav., vol. 8, no. 3, pp. 187–211, Jun. 2005, discussion 212-219. [39] M. K. Holden, T. A. Dyar, and L. Dayan-Cimadoro, “Telerehabilitation using a virtual environment improves upper extremity function in patients with stroke,” IEEE Trans. Neural Syst. Rehabil. Eng., vol. 15, no. 1, pp. 36–42, Mar. 2007. [40] A. S. Merians, D. Jack, R. Boian, M. Tremaine, G. C. Burdea, S. V. Adamovich, M. Recce, and H. Poizner, “Virtual reality-augmented rehabilitation for patients following stroke,” Phys. Therapy, vol. 82, no. 9, pp. 898–915, Sep. 2002. [41] T. N. Chase, “Levodopa therapy: Consequences of nonphysiologic replacement of dopamine,” Neurology, vol. 50, pp. S17–S25, May 1998. [42] Y. Baram, J. Aharon-Peretz, Y. Simionovici, and L. Ron, “Walking on virtual tiles,” Neural Process. Lett., vol. 16, no. 3, pp. 227–233, Dec. 2002.
Daniel J. Myall received the B.Sc. (Hons) degree in mathematics from the University of Canterbury, Christchurch, New Zealand , in 2001. He is currently working toward the Ph.D. degree at the University of Otago, Christchurch. Based at the Van der Veer Institute for Parkinson’s and Brain Research, he is Director of the Movement and Virtual Environment Laboratory. His research interests include human motor control and learning, virtual rehabilitation, and computational modelling, particularly in relation to Parkinson’s disease.
Michael R. MacAskill received the B.Sc. and B.A. (Hons.) degree in psychology from the University of Canterbury, Christchurch, New Zealand, 1993 and 1994, respectively, and the Ph.D. degree in medicine from the University of Otago, Christchurch, New Zealand, in 2002. He is currently a Research Fellow at the University of Otago, Christchurch, New Zealand. Based at the Van der Veer Institute for Parkinson’s and Brain Research, he is Director of its Eye Movement Laboratory, and co-founded its Movement and Virtual Environment Laboratory. His research interests are perception and motor control, particularly in neurological disorders such as Parkinson’s disease.
MYALL et al.: DESIGN OF A MODULAR AND LOW-LATENCY VIRTUAL-ENVIRONMENT PLATFORM FOR APPLICATIONS
Paul R. Davidson (S’95–M’01) was born in New Zealand in 1977. He received the B.E. (Hons.) and Ph.D. degrees in electrical and electronic engineering from the University of Canterbury, Christchurch, New Zealand, in 1998 and 2001, respectively. He is currently a Senior Software Engineer at SLI Systems in Christchurch, New Zealand. His research interests include machine learning, human motor control and learning, and biomedical signal processing. Dr Davidson is a Member of the Australasian College of Physical Scientists and Engineers in Medicine. He was a Brain Physiology and Modeling Track Co-Chair for EMBC 2005 in Shanghai.
Tim J. Anderson is a neurologist at the University of Otago, Christchurch, Christchurch Hospital and the Van der Veer Institute for Parkinson’s Disease and Brain research. He holds the Cas Van der Veer Chair in Parkinson’s Diseases located in Christchurch. His clinical interests are in movement disorders and his research activities are particularly in the realm of eye movements in Parkinson’s disease and other movement disorders.
309
Richard D. Jones (M’87–SM’90) received his B.E. (Hons) and M.E. degrees in electrical and electronic engineering from the University of Canterbury, Christchurch, New Zealand, in 1974 and 1975, respectively and the Ph.D. degree in medicine from the University of Otago, Christchurch, New Zealand, in 1987. He is Director of the Christchurch Neurotechnology Research Programme, a biomedical engineer and neuroscientist in the Department of Medical Physics and Bioengineering of Canterbury District Health Board, a Research Associate Professor in the Department of Medicine at the University of Otago, Christchurch, and an Associate Professor in the Department of Electrical and Computer Engineering at the University of Canterbury. His research interests and contributions fall largely within neural engineering and the neurosciences, and particularly within human performance engineering—development and application of computerized tests for quantification of upper-limb sensory-motor and cognitive function, particularly in brain disorders (stroke, Parkinson’s disease, traumatic brain injury) and driver assessment; drowsiness and lapse detection from behavioural measures (tracking and video metrics) and electrophysiological signals (EEG, EOG); signal processing in clinical neurophysiology—detection of epileptic activity; eye movements in brain disorders; computational modelling of the human brain; virtual-reality approaches to neurorehabilitation; and neural control of swallowing. He is on the Editorial Board of Journal of Neural Engineering Dr. Jones is a Fellow of the Institution of Professional Engineers New Zealand, a Fellow and a Past President of the Australasian College of Physical Scientists and Engineers in Medicine, a Fellow of American Institution for Medical and Biological Engineering, and a Fellow of the Institute of Physics (U.K.). He was a Co-Chair of Neural Engineering Theme at EMBC 2005, and is a Co-Chair of Neural Engineering, Neuromuscular Systems and Rehabilitation Engineering Theme at EMBC 2008 in Vancouver, BC, Canada. He is an Associate Editor of IEEE TRANSACTIONS ON NEURAL SYSTEMS AND REHABILITATION ENGINEERING and a past Associate Editor of IEEE TRANSACTIONS ON BIOMEDICAL ENGINEERING.