DESIGN OF WEB-BASED GIS TOOLS TO SUPPORT ROUTINE QUALITY MONITORING OF REMOTE SENSED PRODUCTS FROM NEXT GENERATION LEO AND GEO MISSIONS T. Scott Zaccheo, Michael Sze and David B. Hogan AER, Inc, Lexington, MA 02421-3126 1. INTRODUCTION* As the focus of current and future environmental satellite missions migrates towards providing common production oriented products, the routine monitoring and assessment of these products must also evolve from a local environment at a single site to an open system that provides common access to a larger community. This community consists of not only those involved in daily production, but also those who maybe sporadically called upon to aid in problem resolution as well as the diverse set of end users. This evolution enables, if desired, the geographic diversification of those involved in the daily assessment of product quality and the ability to rapidly disseminate common information on an adhoc basis to science community and the academic /industrial users. In order to facilitate this transition from center-oriented activity to a community based approach, common and open source standards and tools must be adopted to facilitate visual inspection and comparison of these products with those from other satellite-based systems and ground-based measurements. How to best accomplish this task is an open question, and will most likely be driven on a case by case basis in part by specific program needs and requirements. However, in general, many of these future systems will employ multi-tier approaches that combine traditional data dissemination methods, with newer interactive web-based GIS-like applications in order to provide a comprehensive data monitoring, analysis and problem resolution environment. In this work we assess the potential use of open source Geographic Information System (GIS) applications, e.g. Google EarthTM/Google MapTM† technologies, to meet some of these requirements. As part of this effort, a set of prototype interactive *
Corresponding author address: T. Scott Zaccheo, AER, Inc., Lexington, MA 02421-3126; e-mail:
[email protected] †
Google EarthTM and Google MapsTM are trademarks of Google, Inc.
networked enabled tools were developed for data visualization and quantitative comparison of remote sensed products with data from other satellite-based instruments, model results and ground based in situ measurements. The intent behind these prototyping efforts was to examine the benefit and limitations of use of open source metadata standards and publically available Application Programming Interfaces (API)/GIS tools to provide routine product inspection and quality monitoring via access to data from a variety of sources including products generated inhouse as well as those provided by government agencies, i.e. NOAA/NASA, and in situ measurements form national/international data collection systems, i.e. METARs/BUOYs. 2. DESIGN The design approach that was taken in this study was to employ a publically available set of GIS-like display tools and API that have a common open standard metadata interface, but the goal was to prototype elements that illustrate required functionality for typical atmospheric/ environmental remote sensing data monitoring/ assessment tools. These elements include: 1.
2.
3.
Visualization of satellite remote sensing data and products imagery using common geo-spatial and temporal references. This includes layering of diverse data from multiple sources. Display of gridded model data, e.g. mesoscale Weather Research Forecast (WRF) output, as imagery, contour lines and point sources. Geo-located display of point source in situ data as queriable entries for comparison to remote sensed and model data.
In this study, we chose to implement these prototype elements using the Google EarthTM application and Google EarthTM/MapTM APIs in conjunction with data generated in Keyhole Markup Language (KML) format. This suite of tools, APIs and metadata formats is by no means the only public-domain/ commercial available GIS software system, and may not provide the best complement of costbenefit/features for any given application. It was however chosen for this study primarily based on: 1)
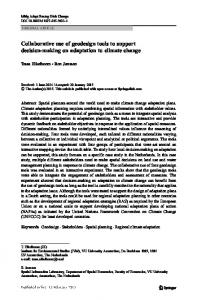
The fact that KML is open-source GIS metadata standard that is actively being developed and widely supported across the community; and 2) The Google suite provides some level of application interface to most KML attributes. The other consideration was that these tools have a significant installed/ user base and require minimal training, which makes them ideal candidates for providing access to a diverse community. The overall design of this prototype system design consisted of three basis types of software elements. A basic flow diagram of this system is illustrated in Figure 1. These functional elements were: 1) Data retrieval/ingest application, 2) KML data generation application and 3) Graphical User Interface (GUI). These basic elements enabled the development of two types of applications.
Data Archive
Ingest
Generate Products
Imagery
KML Data
Satellite in situ NWP Other
Backend Processing
Meta Data
HTTP Server
Server Side Client
Web Browser
Google Earth App
Google Map API
Google Earth API
JavaScript Application
Figure 1: Three teir system architecture containing backend processing component, server side application and multiple client interfaces. The first design employs the stand-alone Google EarthTM application. In this instance, KMZ formatted files (compressed KML files) provide point, contour, imagery and spatial/temporal metadata which enables Google EarthTM to geo-locate individual data layers in a single view. Google EarthTM enables visualization of multiple data layers as time independent elements or time dependent sequences. The Google EarthTM application, however has limited
ability to customize the user interface or add additional functionality. KML is an open source XML schema for describing geographically and temporally oriented data sets. This schema provides an open standard for denoting geographically oriented annotations, polygons/filled polygon models and imagery data. It provides standardized mechanisms for describing and grouping a spatially and temporally unique data element that can be displayed as separate entities or a collection of data layers. The second design approach involves embedding Google MapsTM within a standard Web browser. This approach employs customized Javascript GUIs to control the Google EarthTM/MapsTM APIs to display and query data. Google MapsTM-based applications provide planar map views, and have limited KML/KMZ support. However, Javascript enables the design and development of complex web-based analysis tools that may provide interactive access to remote databases, graphics tools, tabular data displays and data import/export functions. Google EarthTM API based applications combines the KML/KMZ support provide by the standalone application with Javascript support. 3. IMPLEMENTATION The design elements outlined above were prototyped and incorporated into an end-to-end evaluation system. One of the overall design approaches that was emphasized in the development of this system was the use of modular software development to assist in the transition of these data acquisition, formatting and display/analysis objects in to future end-user applications. The software design approach used in this instance is outlined in work by Zaccheo 2004. To this end, a number of C++ and scripted base objects developed on prior programs formed the basis of the data acquisition and data decoding for this application. Weather and environmental satellite, model and in situ data were acquired from various sources via automated FTP/HTTP-based applications. These data included GOES-11/12 imagery and WRF NWP for an extend CONUS sector from the Air Force Weather Agency (AFWA) via a CRDA agreement between AER, Inc and AFWA, regional Sea Surface Temperature (SST) data from an inhouse development efforts designed in collaboration with the University of New Hampshire Center for Earth, Ocean and Space, and in-situ METAR/BOUY data from NOAA and UNH. The second class of software applications developed for this endeavor decoded and converted the data
described above to application specific KML/KMZ and simple text based ancillary data files for direct use by the Google EarthTM standalone application or other web-based applications constructed using the Google EarthTM/MapsTM APIs. These application data included KML files containing: Placemarkers that provide annotated point location information; Lines/Polygons that describe contour lines; and weather symbols, e.g. wind barbs, metadata that aid in imagery geolocation and data organization information used to group data and provide time sequence information.
In addition to the dynamic placement of buoy location information, the Google MapsTM API provides support for overlaying contour/imagery information that can be animated. In this application, animation is provided by “forward” and “reverse” buttons located directly below the display window. Contour support is provided directly via the APIs KML/KMZ interface. The geolocation of imagery data however is provide by the ancillary data streams, due to the limitation of the Google MapsTM API KML support.
In addition to data in KML/KMZ format, these tools were also designed to simultaneously generate imagery in KML/KMZ compatible formats, e.g. Joint Photographic Experts Group (JPEG) and Portable Network Graphics (PNG), and other ancillary information that directly interface with the web-based applications developed as part of this effort. The KML/KMZ data described above can be viewed directly in the stand alone Google EarthTM application or others that adhere to the KML standard. Examples products provide by this class of application are shown in Figure 2. Even though directly ingesting these data in a publically available viewer provides a standardized mechanism for displaying geo-located weather products derived from remote data, and other weather/environmental data sources, it does not provide methods for basic data analyses or quantitative comparison. In this study, two versions of an interactive webenabled application were developed using embedded Javascript to illustrate the basic design elements described above. One employed the Google MapsTM Javascript API and second variant version was developed using the Google EarthTM API. An example screen shot of the Google MapsTM based web page design is shown in Figure 3. This web application provides a geo-referenced view of in situ buoy locations with either contour or imagery of a regional SST product, along with user selectable graphical and tabular comparisons between measured and modeled data. The Google MapsTM API was used extensively to provide the interactive map region shown on left hand side of Figure 3. This provides a zoom/pan-able map window with user selectable background (map-based, satellite-based or hybrid view). The API provides methods for constructing user selectable placemarkers that may initiate “callback” events upon activation. In this case, the placemarker geolocation information is not provide in KML form, but instead via ancillary data accessed directly by the embedded scripts.
Animated Satellite Imagery
Animated Wind Barbs
Animated NWP Contour
Worldwide SYNOP Station Information
Figure 2: Example Google EarthTM KML/KMZ overlays. Panels illustrate animated satellite imagery and NWP windbarbs/height contour as well as SYNOP station maker with “pop-up” information windows Software events generated by user selection of individual buoy markers populate the X/Y plot window shown in the upper right corner of the screen and the tabular view in the lower right. These plots and tables provide graphical and numerical comparison of measured SST with collocated estimated from SST field constructed by blending model and remote sensed data. An analogous web interface was also developed which replaced the Google MapsTM API object/ methods with Google EarthTM API elements. Implementing this approach required only nominal changes to the original web design.
A Google EarthTM view was added to the original implementation and the SST imagery was converted from a custom data stream interface to a KML approach that is fully supports the Google EarthTM environment. 4. DISCUSSION There are merits and limitations to the two approaches taken in this work for developing webenabled monitoring, quality control and analysis applications of remote sensed data and their comparison to in situ measurements. The stand-alone Google EarthTM application is the simplest and requires only providing KML-formatted data. Google EarthTM is inherently network enabled and permits access local and remote data transparently. Currently Google EarthTM does not permit customization of the user interface. For example, selection/ de-selection of groups of elements is constrained by the KML structure and cannot be modified on the fly. Time sequencing and animation are provided but are inflexible. TM
TM
By embedding Google Earth or Google Maps in a Web browser, a high degree of customization is available through Javascript/ ECMA programming. Although very sophisticated tools can be constructed in this manner it comes at the cost of custom client
server programming with Javascript on the client side with server side functionality by your language of choice (Java, C++, C#, etc.). Other limitations are that Google MapsTM does not provide full KML support and the embedded Google EarthTM currently is computationally and memory intense. Nevertheless embedded Google MapsTM/EarthTM is an excellent way to streamline a customized user interface to geographic data and deploy it to a wide user community. The suite of tools described here are not the choice for complex data analysis tasks or for GIS-workflow applications. They are an excellent adjunct to such tools, however, for deploying data and customized data exploration capabilities. We anticipate Google EarthTM/ MapsTM to continue to advance in coming years. By subscribing to the standards used by these tools (especially KML), we expect increasing flexibility, capabilities and ease in deployment to follow.
5. REFERENCES Zaccheo, T.S., Galantowicz, J., Hogan, D.B., Kennelly, E.J. and Snell H.E., (2004) “Testbed Architecture for Rapid Prototyping and Assessment of Environmental Remote Sensing Algorithms”, Proc. SPIE, 5548, pp. 37-47.
Figure 3. Example prototype SST web user interface developed using Google MapsTM Javascript API. Geographic view on left-hand side provides pan/zoomable map, satellite or hybrid background with user selectable annotated measurement buoy location and SST contours or imagery overlays. Animation buttons below the map frame provide ability to step forward and backwards in time.