WSEAS TRANSACTIONS on COMPUTERS
Anca Iordan, Manuela Panoiu
Design using UML diagrams of an educational informatics system for the study of computational geometry elements ANCA IORDAN, MANUELA PANOIU Technical University of Timişoara, Engineering Faculty of Hunedoara, Revoluţiei 5, 331128 Hunedoara ROMANIA
[email protected] Abstract: - This paper presents the necessary stages in implementing an informatics system used for the study of computational geometry elements, such as determining the parallel and perpendicular to a given line through a point, to verify the property that a point lies within a triangle, verification of the convex or concave property of a polygon, the determination of the convex hull of a set of points. The modeling of the system is achieved through specific UML diagrams representing the stages of analysis, design and implementation, the system thus being described in a clear and concise manner. Key-Words: - Educational Software, Computational Geometry, Java, Distance Education. use-cases. Each case describes the interaction between the user and the system. The use case diagram is represented in figure 1. The presented diagram defines the system’s domain, allowing visualization of the size and scope of the whole developing process. It contains: an actor - the user who represents the external entity with which the system interacts; six use cases describing the functionality of the system; relationships between the user and use cases (association relationships) and the relationships between use cases (generalization relationships). For each use-case in the diagram presented earlier an activity diagram is constructed. Each diagram will specify the processes and algorithms that are behind the use cases studied. Activity diagrams [8] are represented by nodes (with partitions and branches) or conditional blocks (with decisions). The activity diagrams are used to visualize, specify, build and document dynamic issues related to the informatics system processes. They focus on flow control seeking the transition, in a certain order, from one activity to another. Figure 2 present the activity diagram corresponsive to the use-case “Determination of a perpendicular and a parallel to a line through a point”. Figure 3 present the activity diagram corresponsive to the use-case “Check property if a point is inside a triangle” and figure 4 present the activity diagram corresponsive to the use-case “Verifies if a polygon is convex”.
1 Introduction The multimedia technologies transformed the computer into a valuable interlocutor and allowed the students, without going out of the class, to assist the lessons of different emeriti scientists and professors, to communicate with persons located in different countries, to have access to different information [1,3]. By a single click of the mouse, the student can visit an artistic gallery, read the originals for writing a history paper or visualize information for a narrow profile, which couldn’t be found five-ten years ago. One of the main aspects of using computer for lessons is the development of the student’s creative thinking. An optimal mean in this case is the introduction in the computational training means of the interactivity elements [2,4,5]. The „interactivity” term means „to interact, to influence one-toanother”. This property of the computational technologies is absolutely unique compared with television, lectures, books, instructive movies etc.
2 Development stages of the educational informatics system 2.1
System’s analysis
Using the UML modeling language, the analysis of an informatics system consists in drawing the use case and activity diagrams [6]. The software utility ArgoUML [7] was used to construct the diagrams. The informatics system will be described in a clear and concise manner by representation of the
ISSN: 1109-2750
960
Issue 9, Volume 9, September 2010
WSEAS TRANSACTIONS on COMPUTERS
Anca Iordan, Manuela Panoiu
Fig.1 Use-cases diagram
Fig. 3 Activity diagram for the use-case “Check property if a point is inside a triangle”
2.2
2.2.1 Class Diagrams Conceptual modeling [9] allows the identification of the most important concepts for the system.
Fig. 2 Activity diagram for the use-case “Determination of a perpendicular and a parallel to a line through a point”
ISSN: 1109-2750
System’s designing
961
Issue 9, Volume 9, September 2010
WSEAS TRANSACTIONS on COMPUTERS
Anca Iordan, Manuela Panoiu
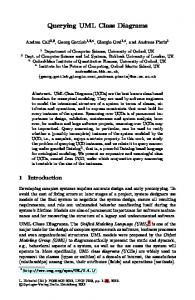
Since classes are concepts, the following two diagrams present the classes that will be used in the project. Figure 5 presents the inheritance and achievement relationships used. It may be noted that all attributes and methods of the JPanel class will apply to the derived class Desen, which implements two interfaces, Runnable and MouseInputListener. The composition and aggregation relationships that exist between instances of the classes in the architecture are shown in figure 5. Aggregation relationship is a partnership where the whole and the part are specified. By analyzing figure 6, it is apparent that an object of type Dreapta or type Graham is part of an object of type Proiect. The difference of the composition relationship, with respect to aggregation, is that the instance of the whole could not exist without part objects. Fig. 4 Activity diagram for the use-case “Verifies if a polygon is convex”
Fig.5 Class diagram
ISSN: 1109-2750
962
Issue 9, Volume 9, September 2010
WSEAS TRANSACTIONS on COMPUTERS
Anca Iordan, Manuela Panoiu
Fig.6 Class diagram objects, from which the object type Triunghi is already created and object types DesenTriunghi, TextArea, Graphics2D, Punct2D, String and Triunghi will be instantiated during interactions. These objects are represented on the Ox axis and the messages sorted ascending by time are represented on the Oy axis. At first, execution control is acquired by the object type Triunghi which creates instances of classes DesenTriunghi, TextArea and Graphics2D. Now control is acquired by the newly created instance DesenTriunghi which will allow the creation of the triangle endpoints through interactions with Punct2D, String, Graphics2D and TextArea object types. Thereafter control is passed to the object of type DesenTriunghi which that will instantiate the object type Triunghi2D. The last post will lead to the redesign of the geometrical construction which will now include the previously created triangle.
When looking at figure 6 one can see that a type DesenTriunghi instance consists of five Punct2D type items, one Triunghi2D object type and one Graphics2D object type. In such a relationship it is possible for an object to belong to several instances of a whole. For example object type Punct2D belongs to DesenTriunghi, DesenDreapta, Desen, Desen1 and Desen2 type instances. Both class diagrams shown contain specific classes to the application as well as existing classes and interfaces from Java. 2.2.2 Sequence Diagrams Sequence diagrams [10] describe the behavior of a set of objects in a certain context, emphasizing the temporal aspect. The diagram shown in figure 7 reflects the interactions between objects, the purpose of which is drawing a triangle with specified points. Note that there are interactions between 11
ISSN: 1109-2750
963
Issue 9, Volume 9, September 2010
WSEAS TRANSACTIONS on COMPUTERS
Anca Iordan, Manuela Panoiu
Fig.7 Sequence diagram 2.2.4. Collaboration diagrams Collaboration diagrams describe [12], same as sequence diagrams, the conduct of a set of objects in a certain context, focusing on organizing objects participating in an interaction. These diagrams are graphs, their peaks are objects participating in the interaction and the arcs represent the links between instances.The diagram shown in figure 9 reflects the interactions between objects aimed at drawing a triangle. Note that the following interactions between objects types exist: Triunghi, DesenTriunghi, Punct2D, Triunghi2D, TextArea, String and Graphics2D.
2.2.3 State chart diagrams The objects corresponding to the classes presented posses both behavior and internal state, in other words, they fulfill certain actions and posses information. State chart diagrams can be developed in order to understand them. UML state chart diagrams [11] describe the different states an object can be found in and the transitions between these states. Figure 8 illustrates, the state chart diagram corresponding to an instance of the class Desen, class which implements the Runnable interface corresponding to threads.
ISSN: 1109-2750
964
Issue 9, Volume 9, September 2010
WSEAS TRANSACTIONS on COMPUTERS
Anca Iordan, Manuela Panoiu
Fig.8 State chart diagram of components that all together provide functionality for the educational informatics system that allows geometric constructions in the plan. The central component of the diagram Proiect.class is obtained by transforming the component Proiect.java into executable code by the Java compiler. It can be noted that this component interacts directly only with components Dreapta.class, Triunghi.class, Graham.class, Poligon_convex..class and Jarvis.class.
3 User interface The application "Computational Geometry Elements” is accomplished using the Java programming language [14, 15]. The main page of the application contains buttons for selecting the following options: perpendicular and parallel to a line through a point inside a triangle, the verification of the convexity of a polygon, the determination of the convex hull using Graham and Jarvis methods. By selecting "Parallel and perpendicular to a line through a point”, a new window is opened containing the drawing area, an image containing formulas used to calculate the parallel and perpendicular to a line, a text component containing the equations of the lines and two radio buttons to select the type of line (perpendicular or parallel).
Fig. 9 Collaboration diagram
2.3
System’s implementation
The component diagram [13] allows the visualization of the module in which the system is broken into and the dependencies between modules. The component diagram emphasis on physical software components (files, libraries, executables) and not on logic components, such as packages. The diagram in figure 10 describes the collection
ISSN: 1109-2750
965
Issue 9, Volume 9, September 2010
WSEAS TRANSACTIONS on COMPUTERS
Anca Iordan, Manuela Panoiu
Fig.10 Component diagram s+=String.format("%.1f",A.getY())+")"); f.setRezultat(s); s=new String("\nPunct B("; s+=String.format("%.1f",B.getX())+","; s+=String.format("%.1f",B.getY())+")"); f.setRezultat(s); s=new String("\nPunct C("; s+=String.format("%.1f",C.getX())+","; s+=String.format("%.1f",C.getY())+")"); f.setRezultat(s); s=new String("\nPunct M("; s+=String.format("%.1f",M.getX())+","; s+=String.format("%.1f",M.getY())+")"); f.setRezultat(s); g.setColor(Color.red); t.desenare(g,this.getWidth(),this.getHeight()); t1.desenare1(g,this.getWidth(),this.getHeight(),new Color(155,65,30,100)); t2.desenare1(g,this.getWidth(),this.getHeight(),new Color(0,255,0,80)); t3.desenare1(g,this.getWidth(),this.getHeight(),new Color(155,55,150,120)); s=new String("\nAria triunghiului ABC este "; s+=String.format("%.2f",a)); f.setRezultat(s); s=new String("\nAria triunghiului MAB este "; s+=String.format("%.2f",a1)); f.setRezultat(s);
The second option of the main window opens another window (Fig. 11) to check if a point is inside a triangle drawn by the user. This window contains a drawing area, an image that contains the formula for calculating area of a triangle, a text component containing the coordinates of peak triangles and their areas, and result verification. The triangles are drawing by the following method of the class DesenTriunghi: public void paint(Graphics g1) { g=(Graphics2D) g1; g.clearRect(0,0,this.getWidth(),this.getHeight()); g.setColor(Color.yellow); g.fillRect(0,0,this.getWidth(),this.getHeight()); String s; A.setCuloare(Color.red); A.desenare(g,this.getWidth(),this.getHeight()); B.setCuloare(Color.red); B.desenare(g,this.getWidth(),this.getHeight()); C.setCuloare(Color.red); C.desenare(g,this.getWidth(),this.getHeight()); M.setCuloare(Color.blue); M.desenare(g,this.getWidth(),this.getHeight()); f.stergRezultat(); s=new String("Punct A("; s+=String.format("%.1f",A.getX())+",";
ISSN: 1109-2750
966
Issue 9, Volume 9, September 2010
WSEAS TRANSACTIONS on COMPUTERS
Anca Iordan, Manuela Panoiu
Fig.11 Point inside of a triangle The method of the class Poligon2D which draw the polygon is presented forwards: public void desenare(Graphics2D g) { figura=new GeneralPath(); int xe,ye,a,b; a=(int)(latime/2); b=(int)(inaltime/2); xe=Desen.xecran(latime,a,V[0].getX()); ye=Desen.yecran(inaltime,b,V[0].getY()); figura.moveTo(xe,ye); for (int i=1;i=2); } repaint(); pauza(1000); }
Selecting "Graham Method" opens a window (Fig. 13) with a program that determines the convex hull of a set of points. This window contains a drawing surface, an image that contains the algorithm used, three buttons, two labels and two text components containing the initial points and those points which are in the list determined by the hull. After selecting the points on the drawing area by clicking the button Animaţie a thread, that will allow the simulation of the algorithm for determining the convex hull, is instantiated. At first the nearest point to the origin is determined. The points’ vector is then scanned and sorted according to the polar angle. After the points’ vector was sorted the points’ list will appear sorted by the polar angles to the minimum point determined during the algorithm’s first stage. Further, the first three points are added to the chosen list. They will be displayed in the appropriate text component and on the drawing surface they will be colored in red so they can stand out. Further, for every three points, a check is performed to determine whether the angle formed by these points cancels the polygon’s convexity. If so, the second point is then removed from the stack and will be colored black. If the angle formed by the three points does not cancel the polygon’s convexity, then the three points are inserted into the stack and will be colored red. The method of the class Desen1 which presents step-by-step the Graham algorithm is presented forwards: public void run() { repaint(); pauza(500); sortare(); pas=2;
Fig. 13 Graham Algorithm
ISSN: 1109-2750
968
Issue 9, Volume 9, September 2010
WSEAS TRANSACTIONS on COMPUTERS
Anca Iordan, Manuela Panoiu
pas=2; do { crt=new Punct2D((Punct2D)sortare(pozCrt+1)); infasuratoare.add(crt); f.setLista(crt,2); pozCrt=pozitie(crt); repaint(); pauza(1000); }while(!(crt.getX()==Q.getX()&& crt.getY()==Q.getY())); pas=3; do { crt=new Punct2D((Punct2D)sortare1(pozCrt-1)); infasuratoare.add(crt); f.setLista(crt,2); pozCrt=pozitie(crt); repaint(); pauza(1000); } while(!(crt.getX()==P0.getX()&& crt.getY()==P0.getY())); pas=4; repaint(); pauza(1000); }
The last option of the application allows the user to open another window where the convex hull of a set of points using Jarvis’s match algorithm (Fig. 14). This window has the same elements as the Graham Scan. The application was created to facilitate the understanding of some basic concepts in computational geometry. With the help of the "Graphics2D" class, offered by the Java language, it was possible to achieve an application which simulates very realistically the necessary algorithms’ steps needed to determine the requirements of each option. The method of the class Desen2 which presents step-by-step the Jarvis algorithm is presented forwards: public void run() { infasuratoare=new Vector(); infasuratoare.add(P0); f.setLista(P0,2); repaint(); pauza(1000); crt=new Punct2D(P0); pozCrt=0;
Fig. 14 Jarvis Algorithm for (int i=0;i=1) { for (int i=0;i