Object-oriented modeling plays an important role in computer science, particularly ... namely a class diagram, in a graph that will be easier to ..... 101-116, 1999.
International Journal of Computer Applications (0975 – 8887) Volume 95– No.21, June 2014
Towards an Automatic Evaluation of UML Class Diagrams by Graph Transformation Anas Outair
Abdelouahid Lyhyaoui
Mariam Tanana
National School of Applied Science Tangier, Morocco
National School of Applied Science Tangier, Morocco
National School of Applied Science Tangier, Morocco
ABSTRACT Object-oriented modeling plays an important role in computer science, particularly in the context of software development projects. It is for this reason that the UML (Unified Modeling Language), and therefore the design of UML diagrams, is necessarily present in the majority of computer science’s courses in university. As the number of university students enrolled in such courses is growing, the evaluation of UML diagrams produced by students is often experienced by teachers as a difficult and tedious task. In this paper we propose a method for transforming these diagrams to UML graph in the sake of a better representation, and then assist the teacher during the evaluation process of these diagrams.
Keywords Learner assessment; UML Diagrams; Transformation of graphs;
1. INTRODUCTION UML is one of the most important courses in higher education; the objective of this course is to introduce to the students how UML diagrams are created from case studies. In this research work, we are interested in the evaluation of UML diagrams produced by the students. In this paper, we start by defining some methods and tools to evaluate the learner in general. Then we will present this working context, in particular UML diagrams. Later we explain after a method of transforming an UML diagram, namely a class diagram, in a graph that will be easier to handle and evaluate than the original one. Finally some conclusions and coming perspectives are drawn. The learning assessments occupy a very important place in the education. The knowledge acquired by the students can be tested by the teacher in the form of a:
Formative assessment or diagnostic testing is a range of formal and informal assessment procedures employed by teachers during the learning process in order to modify teaching and learning activities to improve student attainment [1]; Summative assessment is commonly used to refer to assessment of educational faculty with the object of measuring all teachers on the same criteria to determine the level of their performance [2].
Bloom's taxonomy identifies three main learning domains: cognitive, affective and psychomotor. The cognitive domain describes the knowledge and the development of the intellectual abilities and skills (knowledge and know-how), the affective domain describes the aptitudes or selfmanagement skills, and the psychomotor domain describes the physical and motor abilities. In what follows, we are
interested in the cognitive domain since it is the most requested at the time of the establishment of learning objectives in the educational system [3]. When a teacher wants to evaluate a learner, he begins by determining the aimed educational objective. Next, according to the cognitive level of this objective, he will choose one or several types of exercises. The higher the cognitive level to evaluate is, the more it is necessary to give freedom to the learner. The aim of this work is to evaluate the skills of the learner, which corresponds to the cognitive level « application » of Bloom‘s taxonomy. We are interested in tools adapted to this choice. Indeed, the main objective is to develop tools helping the teacher to realize an evaluation, which is the most objective possible, of the students’ know-how/ skills. The chosen field of application is the UML diagrams, where the implementation of case studies is necessary for a good understanding of the basic notions of the UML design and modeling. The students have to conceive these case studies. The teacher’s work will consist at evaluating the obtained results. It is a tedious task because the correction of an UML diagram created by a student is difficult to understand, especially if there are several possible solutions. Since UML does not provide the methodology for modeling, the students have difficulties during the construction of a class diagram. When students construct an UML diagram, which has several solutions, it might be presented in different ways and point of views. For this reason, this paper offer assistance to the teacher in the task of evaluating the UML diagrams produced by students. Firstly, we are interested in class diagrams because it is the most complicated part in the diagram design. In the following section, we will present the different view of a system model, and the categories of elements of class diagram.
2. DIAGRAMS OVERVIEW 2.1 UML Diagrams The Unified Modeling Language (UML) is a set of graphical notations based on a metamodel for specifying, visualizing and documenting object-oriented software systems. It defines a notation that represents the syntax of the language modeling and a meta-model which provides additional evidence to clarify the meaning of the ratings [4]. The UML diagrams represent two different views of a system mode [5]:
36
International Journal of Computer Applications (0975 – 8887) Volume 95– No.21, June 2014
Static view: emphasizes the static structure of the system using objects, attributes, operations and relationships. The structural view includes class diagrams and composite structure diagrams.
Dynamic view: emphasizes the dynamic behavior of the system by showing collaborations among objects and changes to the internal states of objects. This view includes sequence diagrams, activity diagrams and state machine diagrams.
2.2 Class Diagram
UML language organizes the elements of class diagrams into two broad categories [6]:
Classifier is a category of UML elements that have some common features, such as attributes and operations, and can be linked by relationships. Relationship is a general term covering the specific types of logical connection found on class diagrams. The figure 1 shows the types of relationships:
Each document is characterized by title, author, ISBN number and inventory; Only books are for borrowing. A book has more of an attribute on the state of the borrowing; A member can borrow or return back books. At any time, we can know which books are borrowed by a member; The date of returning back a borrowed book is set at the time of the borrowing. This date may be extended upon request; The borrowing is always performed by the librarian who works at the library. After identifying the borrower, they know if the borrowing is possible and if the borrower has priority;
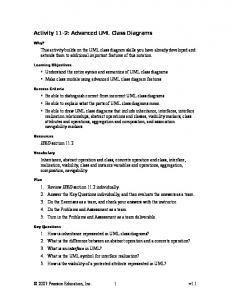
Figure 2 shows a class diagram of the teacher modeled from a text statement, this reference diagram is not optimal, there may be alternative solutions with semantic equivalence but structurally different. First of all the focus is on a single solution of teacher’s class diagram to find the differences with the class diagram produced by a single student, which is illustrated in Figure 3.
3. TYPESET TEXT 3.1 Normal or Body Text
Fig 2: Teacher class diagram
Fig 1: Different kinds of relationships
2.3 Assessment of differences between class diagrams We start by focusing on the evaluation of the class diagram, because it is the most used, and considered as the most important of object oriented modeling. To demonstrate this approach, an example model containing a teacher’s class diagram and a student’s class diagram, to detect all differences between them. Thereafter, we will illustrate the use of class diagrams with an example of a case study on «Library management” produced by teacher and student. Thus, we analyzed the operation of the library to get the list of rules and following assertions:
The library includes a set of documents and a set of members ; New documents are added regularly to the library by the librarian. They are either books or dictionaries.
Fig 3: Student class diagram The detected differences of modeling and representation are significant. The differences between the teacher and student class diagrams are expressed in the following list:
Class “Librarian” is not represented, nor its association relationships with class “ library” and class “member”;
Association class is not represented, nor its attributes, its operations and its association relationships with class “Library” and ‘Librarian’;
A composition relationship connects the classes "Library" and "Document" instead of an aggregation relationship, and its orientation is reversed;
37
International Journal of Computer Applications (0975 – 8887) Volume 95– No.21, June 2014
An association relationship "registered" is inserted between the classes "Member" and "Library", while it should be inserted to connect the class "Member" with the class "Librarian";
The direction of the inheritance relationship between the classes "Document" and "Book" is reversed;
The multiplicity of the association end "0..2" of the class "Book" is replaced by "1..*".
The differences were developed from a manual comparison; several differences have been found in class, attribute, method, relationship, orientation relationships and multiplicities. The differences can be expressed as insertion, omission, inversion and replacement. The student’s class diagram is incomplete; he omitted to represent some elements of the diagram. These omissions are for instance the absence of a class which implies that the attributes, operations and relations that connect them to other classes in the diagram are also absents. It may be that the student has omitted to represent attribute inherited by subclasses of the superclass, then these classes will also be incomplete. However, the insertion of an element or relationship in the diagram constructed by the student refers to the fact that he did not respect the case study, or that he made a mistake. Table 1 illustrates an example of general differences between the teacher’s class diagrams and the student’s class diagram. Table 1. The general differences between two class diagrams Differences noted by the teacher Omission {Librarian} Omission {works (Librarian Library)} Omission {registered (Librarian Member)} Omission {Borrow} Omission {do (Librarian Borrow)} Omission {know (Library Borrow) { have (Library Document) } REVERSE { have (Document Library) } { Dictionary Document} REVERSE { Document Dictionary) }
reason, we will introduce in the next section, a method that transform UML class diagram to an UML graph.
3. TRANSFORMATION OF UML DIAGRAMS INTO A GRAPH We have described some differences between two UML class diagrams analyzed during the design of a case study. In the discussed learning environment, the models developed by students during a modeling activity are class diagrams analysis level graphics. In this section, we examine some possible representations of the UML class diagram. We propose a correct graphical representation of this exercise. Then we focus on how UML class diagrams can be represented as graphs in particular to be saved and analyzed by computer systems. We will start with some basic definitions and notations on graphs that we will use later in this paper. Indeed, the graphs are often used to model objects in various scientific and engineering fields such as the treatment and recognition of images, information search and text documents, the representation of scientific data [7]. The purpose of these representations is to have an easier formalism to handle the initial representation of the object.
3.1 Graph theory 3.1.1 Multidigraph A multidigraph is a directed graph which is permitted to have multiple arcs, i.e., arcs with the same source and target nodes. A multidigraph G is an ordered pair G= (V, A) with:
feedback
V a set of vertices or nodes, A multiset of ordered pairs of called directed edges, arcs or arrows [8].
vertices
A labeled multidigraph G is a multigraph with labeled vertices and arcs [9]. Omission of class and elements associated with this class
Omission of association class and elements associated with this association class
Reversing the direction of a aggregation relationship
Reversing the direction of a generalization relationship
Those differences have been done manually, if we want to do it automatically or semi-automatically, it will be difficult with the graphic form of these diagrams. Thereafter, we would like to represent it in an easier and handle able format. Indeed, the class diagrams contain several links between classes and each class has several attributes or operations. Links can be of different types (combination of inheritance, aggregation, composition and simple association) and be labeled differently (role, multiplicity, and navigability) [8]. For this
3.1.2 Labeled graph A labeled graph is a directed graph such that vertices and edges are associated with labels. Without loss of generality, we shall assume that every vertex and edge is associated with at least one label: if some vertices (resp. edges) have no label, one can add an extra anonymous label that is associated with every vertex (resp. edge) [10]. More formally, given a finite set of vertex labels LV , and a finite set of edge labels LE, a labeled graph will be defined by a triple G =(V, RV , RE ) such that:
V is a finite set of vertices; RV ⊂ V x LV is the relation that associates vertices with labels, i.e., RV is the set of couples (vi , l) such that vertex vi has label l;
RE ⊂ V x V x LE is the relation that associates edges with labels, i.e., RE is the set of triples (vi , vj , l) such that edge (vi , vj) has label l. Note that from this edge relation RE, one can define the set E of edges.
3.2 Graphical representation The transformation of graphs was introduced to computer science in the late 60s [11]. The modification is done by graph transformation rules. Numerous studies on the transformation of graphs have been applied in many areas of computer science such as visual modeling [12], the modeling of distributed [13] systems, functional [14]. In particular, the transformation graphs can easily model the graph structure. It has become a modeling tool, often used in
38
International Journal of Computer Applications (0975 – 8887) Volume 95– No.21, June 2014 the case of complex systems that involve many communicating objects. Detailed individual applications processing approaches are represented in graphs [15]. Figure 4 shows an attributed class diagram with two classes connected by an association on the right-hand side, and the corresponding simplified version of that diagram on the lefthand side (multidigraph) [16]. The class names are represented by vertices, the attribute names are represented by edges, the attribute types are represented by nodes and the link between classes are represented by edge.
super classes to subclasses, they characterized by name and type. A class is associated with more association ends. Each end of an association has properties that specify its role, multiplicity. An association is composed of at least two association ends and may be named.
The advantage of this representation provides graphs with some vertices and edges. However, it has disadvantages:
A N-ary association cannot be represented in this formalism as an arc of a graph is binary; An association class cannot be shown because it is both a top and edge of the graph; Operations, attributes and end of association cannot be represented. An attribute can for example have a name, a type, visibility.
Fig 5: Metamodel of class diagram
4.2 Improvement of the UML metamodel The representation above is incomplete because several elements are not defined in this metamodel, as the visibility of attributes and operations, the type of association (simple association, aggregation, composition) and the association class. Based on the extracted UML metamodel of the figure 4, we can enhance this metamodel by adding:
Visibility at attribute element; Type of association and navigability at end association element; Association class element; Attribute element and operation element connected with association class element.
Fig 4: An attributed graph in two different notations As class diagrams are a little more complex than the graph structure, we will present in the next section a method of representing these diagrams before turning them into an UML labeled graph.
4. TRANSFORMATION OF CLASS DIAGRAM TO UML METAMODEL 4.1 Related work This section will present the transformation of UML class diagram. In addition, the advanced class diagrams features (such as interfaces, constraints, etc.) will be ignored. Moreover, The UML language lacks a formal mathematical methodology. Different works can be found to address this issue to provide a formal semantics of UML language. In [17] presents a number of concrete of transformations over the Unified Modeling Language. The work in [18] presents an elegant and simple semantics of UML class and object diagrams based on graph structures that are as close as possible to familiar notions in graph theory. An integrated semantics for UML class, object and state diagrams based on graph transformation in [19]. In [20] a translation UML models into graph transformation systems is presented. The meta-model in Figure 4 shows the main bases of class diagrams [20]. The corresponding class diagram elements (classes, attributes, operations, associations, ends association) exist at the whole range of this diagram. Each attribute and operation is connected to its class or one of its super classes contains. Thus, attributes and operations are inherited from
Fig 6: Improving metamodel class diagram Figure 6 shows the new metamodel that contains all elements of class diagram which we need. In the next section, we will apply the method of transformation of class diagram to an UML graph of the case study of library management, and we can save it in an XML format.
5. TRANSFORMATION OF CLASS DIAGRAM TO UML GRAPH In this section, we present the transformation of the class diagram of the case study “library management”. Based on the extract of the previous metamodel, we can transform a class diagram to an UML graph where all the elements and their direct links are made explicit by means of vertices and edges.
39
International Journal of Computer Applications (0975 – 8887) Volume 95– No.21, June 2014 The representation of the majority of elements (class, associations, attributes, and operation for association) is vertices of the graph. Edges are inheritances, and
relationships between various elements. A class (vertex) has attributes (vertices) that can be typed by classes. Associations (vertices) have association ends (vertices) which can be typed by classes (vertices). The Figure 6 shows the UML graph of library management. The graph representation clearly expresses links of their elements and of their characteristics in the UML
diagrams. Each edge connects several nodes and has a direction. Vertices and edges are characterized by labels representing their attributes and operations (name, visibility, type), their association ends (role, multiplicity, type of association, navigability). This representation is semantically equivalent with the class diagram, and naturally meets the requirements described in the UML metamodel.
Fig 7: Representation of class diagram in the form of an UML graph
6. CONCLUSION AND FUTURE WORK The objective of this work was to analyze the student productions as part of learning to help teachers in the evaluation process and more specifically in the context of class diagram construction activity. The contribution revealed in this work, is the proposal of a transformation method of class diagram into a graph. To demonstrate this approach, an example of a model with teacher's diagram and student's diagram for qualifying the correspondence with the taxonomy of differences. Compared to existing model transformation method, the proposed method has improved more precisely transformation using a previously defined UML metamodel. Then we did represent and save the UML graphs (with the extension. Uml2) in XMI format to respect the current standard UML 2.x.
The next goal is to compare the two UML graph, the comparison is akin to the models matching process. The matching consists at identifying relationships between several elements of graph, that is to say a set of mappings between two or more elements. Different techniques were tested in the areas of matching graphs, we want to explore such techniques to define an automatic or semi-automatic matching method, which takes as input graphs UML and returning as output a mapping of their matched patterns and their list of the differences.
7. REFERENCES [1] Cowie, Bronwen, and B. Bell, A model of formative assessment in science education. Assessment in Education: Principles, Policy & Practice, vol. 6, no 1, p. 101-116, 1999.
40
International Journal of Computer Applications (0975 – 8887) Volume 95– No.21, June 2014 [2] C. Hadji, L’évaluation démystifiée. ESF, 2 édition. Pages 126, 1999.
Conference on Graph Transformation, pages 445–449, London, UK, 2002. Springer-Verlag.
[3] Bloom, Taxonomy of educational objectives: The classification of educational goals. Handbook I, cognitive domain. Longman, New York, 1956.
[13] H. X. Lin. Graph transformation and designing parallel sparse matrix algorithms beyond data dependence analysis. Sci. Program., vol. 12, no. 2, pages 91–100, 2004.
[4] OMG, OMG Unified Modeling Language Specification, Version 1.5, March 2003, Object Management Group, Inc., Framingham, MA, , 2003. [5] Holt. J, UML for Systems Engineering: Watching the Wheels IET, Institution of Electrical Engineers, 2004, ISBN 0-86341-354-4. p.58. [6] OMG Unified Modeling Language (OMG UML) Superstructure, Version 2.3: May 2010. Retrieved 23 September 2010. [7] Conte. D., Foggia. P., Sansone. C. and Vento. M, Thirty years of graph matching in pattern recognition. International Journal of Pattern Recognition and Artificial Intelligence, 18(3):265–298, 2004. [8] Sorlin. S and Solnon. C, "Reactive tabu search for measuring graph similarity." Graph-Based Representations in Pattern Recognition. Springer Berlin Heidelberg, 172-182, 2005. [9] Diestel, Reinhard; Graph Theory, Springer; 2nd edition, ISBN 0-387-98976-5, February 18, 2000. [10] Champin. P. A and Solnon. C, Measuring the similarity of labeled graphs. In Case-Based Reasoning Research and Development (pp. 80-95). Springer Berlin Heidelberg, 2005. [11] Pfaltz. J. L and Rosenfeld. A,. "Web grammars." Proceedings of the 1st international joint conference on Artificial intelligence. Morgan Kaufmann Publishers Inc., 1969. [12] P. Bottoni & M. Minas. Workshop on Graph Transformation and Visual Modeling Techniques. In ICGT ’02 : Proceedings of the First International
IJCATM : www.ijcaonline.org
[14] M. Andries, G. Engels, A. Habel, B. Hoffmann, H.-J. Kreowski, S. Kuske, D. Plump, A. Schurr & G. Taentzer. Graph transformation for specification and programming.Science of Computer Programming, vol. 34, pages 1–54, 1999. [15] G. Rozenberg, editeur. Handbook of graph grammars and computing by graph transformation, volume 1: Foundations. World Scientific, Singapore, 1997. [16] R. Heckel, J.M. Kuster, G. Taentzer, Confluence of typed attributed graph transformation systems, in: A. Corradini, H. Ehrig, H.-J. Kreowski, G. Rozenberg (Eds.), Graph Transformation, First International Conference, ICGT 2002, Barcelona, Spain, October 7– 12, 2002, Proceedings, Lecture Notes in Computer Science, vol. 2505, Springer, Berlin, 2002, pp. 161–176. [17] Jon Whittle, Transformations and Software Modeling Languages: Automating Transformations in UML, 2002, (ISBN 978-3-540-44254-7). [18] RENSINK, Arend and KLEPPE, Anneke. On a graphbased semantics for uml class and object diagrams. Electronic Communications of the EASST, 2008, vol. 10. [19] KUSKE, Sabine, GOGOLLA, Martin, and KOLLMANN, Ralf, l. An integrated semantics for UML class, object and state diagrams based on graph transformation. In: Integrated Formal Methods. Springer Berlin Heidelberg, 2002. p. 11-28. [20] K. Hölscher, Paul Ziemann, Martin Gogolla, On translating UML models into graph transformation systems, Department of Computer Science, University of Bremen, Bremen, Germany Accepted 9 November 2005.
41