Hitchhiking is expected to produce linkage disequilibrium both in the presence and in ... model may not be able to explain the presence of a single haplotype at ...
Detecting Hitchhiking from Patterns of DNA Polymorphism
65
CHAPTER 6
Detecting Hitchhiking from Patterns of DNA Polymorphism Justin C. Fay and Chung-I Wu
T
he genetic basis of adaptive evolution has long escaped the grasp of evolutionary geneticists due to the difficulty of mapping an organism’s phenotype to its genotype. However, adaptive substitutions may also be identified by their effects on linked neutral variation. This has made it possible to test whether an adaptive substitution has recently occurred in a particular gene and whether such substitutions are common within an organism’s genome. Of critical importance is the power of tests that detect adaptive substitutions and our confidence in the evidence for such events. Adaptive substitution can be detected by their effects on levels and patterns of DNA polymorphism. With few exceptions all tests compare some feature of observed polymorphism data with that expected under a Wright-Fisher neutral model. This model assumes mutations arise in a diploid population of size N with probability µ per generation, mating is random, there is no selection, there is no population structure, population size is constant, there are nonoverlapping generations, and the population is at mutation-drift equilibrium.1 Although it is true that natural populations violate most of these assumptions, the neutral model is often sufficient to describe most features of polymorphism data obtained from natural populations. This is in part due to the fact that slight violations of these assumptions do not cause large deviations from the neutral expectation and in part because under neutrality nearly all features of polymorphism data are expected to be quite variable. In this chapter we describe how various aspects of polymorphism data can be used to detect the effect of positive selection on linked neutral variation, or the hitchhiking effect. We also compare these methods, with respect to their power to detect hitchhiking and their sensitivity to violations of the Wright-Fisher model.
Reduction in Levels of Variation The primary effect of positive selection on linked neutral variation is a reduction in heterozygosity (Fig. 1). In the absence of recombination, variation is steadily removed by hitchhiking or the spread of an advantageous allele through a population. Subsequent to hitchhiking variation is slowly regained by the drift of new mutations to detectable frequencies. When selection is strong the advantageous allele is fixed in approximately ln(2N)(2/s) generations, compared to a neutral allele which is expected to take 4N generations, where N is the effective population size and 1/2N is the initial frequency of the advantageous mutation.2 Subsequent to a hitchhiking event most variation is regained within 4N generations.3,4
Selective Sweep, edited by Dmitry Nurminsky. ©2005 Eurekah.com and Kluwer Academic/Plenum Publishers.
66
Selective Sweep
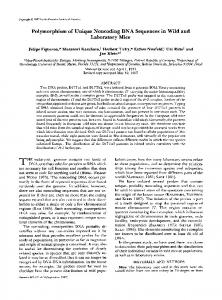
Figure 1. Heterozygosity as a function of c/s for the deterministic approximation of Maynard-Smith and Haigh,36 eq. 8 ≈1-e2c/s (solid line), the deterministic approximation of Stephan et al45 eq. 17 (dashed line), and for 104 coalescence simulations (circles). Simulation parameters are 2N = 108, s = 10-3, ε= 10-6, where ε is the initial frequency of the advantageous mutation.
In the presence of recombination, the reduction in heterozygosity is a function of the ratio of the rate of recombination to the selection coefficient, c/s, and the initial frequency of the advantageous mutation, assuming the spread of the advantageous mutation is deterministic.5 This assumption is justified when the frequency of an advantageous mutation is greater than ε but less than 1-ε, where ε is the frequency at which the probability the advantageous mutation is lost is nearly zero, i.e., (1-2s)2Nε≈e-4Nsε≈0 , where 1, 1+s and 1+2s are the fitnesses of genotypes aa, Aa and AA, respectively.6 Various approximations have been made to account for the hitchhiking dynamics below ε and above 1-ε,6-9 but if selection is strong, the stochastic phase of the hitchhiking event does not have much influence on the time to fixation.7 However, it should be noted that recombination events that occur when the advantageous mutation is rare can have a large effect on the reduction in heterozygosity at a nearby locus. Thus, even a slight change in the time spent between 1/2N and ε is expected to magnify or reduce the effects of recombination on hitchhiking.7 A reduction in heterozygosity can be used as evidence for hitchhiking. The HKA test10 detects a reduction in heterozygosity at one locus compared to a reference locus, and the test has been applied to many genes in Drosophila melanogaster.11 Although the test accounts for different mutation rates at different loci within the genome, the results can be difficult to interpret since the significance of the test varies depending on which “neutral” locus is used as a reference. The HKA test is also sensitive to population subdivision, which increases the variance in heterozygosity across the genome,12 and to purifying selection which is expected to reduce levels of variation as a function of the recombination rate and of the rate of deleterious mutations.13 More compelling arguments for hitchhiking can be made by showing a local reduction in variation along a chromosome (as shown in Fig. 1). This has been done for the Acp26Aa,14,15 Sod16,17 and Sdic18 genes in D. melanogaster. However, even under a neutral model, a local reduction in levels of variation may be observed due to the large evolutionary
Detecting Hitchhiking from Patterns of DNA Polymorphism
67
variance in the time to the most recent common ancestor. The difficulty lies in determining how large a region and how great of a reduction in levels of variation cannot be explained by a neutral model. Kim and Stephan19 have developed a maximum likelihood method to test for hitchhiking based on polymorphism sampled along a chromosome. The test is based on both a reduction in levels of variation and a skew in the frequency spectrum.
Skew in the Frequency Spectrum The effect of hitchhiking on the frequency spectrum depends on the ratio of the recombination rate to the selection coefficient, the initial frequency of the advantageous mutation, and most importantly on the time since the start (or end) of the hitchhiking event. During the spread of an advantageous mutation, neutral mutations are swept to either low or high frequency depending on their original linkage relationship with the advantageous mutation. In the absence of recombination, a partial hitchhiking event (where the advantageous mutation does not reach fixation), can be detected by a single mutation or haplotype present at a much higher frequency than expected under a neutral model (see below). If there is no recombination and hitchhiking is complete, all variation is removed from a locus. A skew in the frequency spectrum can also be produced as an indirect byproduct of removing all variation from a locus. Subsequent to hitchhiking, new mutations accumulate at low frequency in a population and it takes some time before they drift to intermediate or high frequencies. This skew in the frequency spectrum towards low frequency variation can be measured by Tajima’s D statistic.20 Tajima’s D is the difference between two estimators of the population parameter θ divided by the standard deviation of the difference. Under the Wright-Fisher model the expectation of θ is equal to 4Nµ, where N is effective population size and µ is the mutation rate. The two estimators are
(n − i ) n( n − 1)
n−1 2 S
θπ = ∑
n=1
ii
(1)
which is based on the average heterozygosity21 and n−1 n−1 1 θ W = ∑ Si ∑ n=1 n=1 i
−1
(2)
which is based on the number of segregating sites divided by a constant, which depends on the the sample size n.22 π is most sensitive to intermediate frequency variation, whereas w is most sensitive to rare (low or high frequency) variation. The reasoning is as follows: a single segregating sites at intermediate frequency adds 10×(20-10)/(20×19) = 0.26 to π whereas a low frequency variant adds much less: 1×(20-1)/380 = 0.05. In contrast, each segregating site contributes equally to w. Since most variation in a population is found at low frequencies w is easily influenced by changes in the number of low frequency variants. Under neutrality, the means of two estimators are expected to be equal to one another. Subsequent to a hitchhiking event that has removed all variation w is expected to be greater than π until new mutations reach intermediate frequency in a population. Simulation studies of hitchhiking events have shown that Tajima’s D has quite a bit of power to detect a strong hitchhiking event 0.2N generations subsequent to the fixation of an advantageous mutation.3 The advantage of this test is that no assumptions are made about how much variation is expected in a population. The disadvantage of this test, as well as all other tests that use polymorphism data, is that while recombination doesn’t affect the mean it does affect the variance of the frequency spectrum and of test statistics based on the frequency spectrum. Recombination decreases the variance since it enables different mutations within a sample to have different
68
Selective Sweep
Figure 2. Expected frequency spectrum of sites in a sample of 20 subsequent to a hitchhiking event for different c/s values. Parameters are 104 coalescence simulations, 2N = 108, s = 10-3, θ= 5, sample size is 20.
genealogies. While the rate of recombination can be either measured in the lab or estimated from polymorphism data, these estimates rely on a number of assumptions and often have large confidence intervals.23 The practical solution that is most often taken is to conservatively assume no recombination for the purpose of generation of the cutoff values for a test statistic, or to use a conservative estimate of the recombination rate, typically the lower bound estimate. A number of other tests, besides Tajima’s D, have been developed to detect hitchhiking based on a skew in the frequency spectrum. Fu and Li’s statistics DFL and D*FL, test for a difference between π and θ estimated from the number of singletons (those mutations found only once in a sample). For D*FL, an outgroup is used to distinguish whether the derived mutation is found once or n-1 times in a sample of n. To provide a general framework for comparisons between the observed frequency spectrum and the neutral expectation, Fu derived an estimate of θ for every frequency class in a sample; θi = iSi.24 Comparison of the frequency based tests showed that Tajima’s D has the most power to detect a hitchhiking event in the absence of recombination.25 In the presence of recombination, hitchhiking produces a skew in the frequency spectrum quite different from that in the absence of recombination. In the presence of recombination a neutral variant will increase or decrease in frequency depending on whether it belongs to the same haplotype as the advantageous mutation or not. For a deterministic hitchhiking event, the expected final frequency of a neutral variant depends on the ratio of the rate of recombination to the selection coefficient and on the initial frequency of the advantageous mutation.5 The end result is that subsequent to a strong hitchhiking event, neutral variation that has recombined into the advantageous haplotype is found at either high or low frequencies and thus forms a bipartite frequency spectrum (Fig. 2).15 High and low frequency variation refer to
Detecting Hitchhiking from Patterns of DNA Polymorphism
69
the frequency of the derived variant (or new mutation) which is distinguished from the ancestral variant using an outgroup. Subsequent to the hitchhiking event, high frequency variants are lost and new mutations at low frequency accumulate.26-28 The bipartite frequency spectrum produced in the presence of recombination can be detected by Tajima’s D statistic,15 or any other statistic that measures differences between rare and common variation. However, low frequency variation is easily influenced by changes in population size and by background selection (see below). On the other hand, an excess of high frequency as compared to common frequency variation cannot easily be produced by demographic scenarios (see below). H is a measure of high frequency variation and is based on the homozygosity of the derived variant. 2S i i 2 n=1 n ( n − 1) n−1
θH = ∑
(3)
The H test is the difference between π and H, and is therefore a test for an excess of high frequency as compared to intermediate frequency mutations.15 Because an outgroup must be used to distinguish between high and low frequency mutations, the probability of mis-inference must be incorporated into applications of the H test. The derived state can be mis-inferred if a reverse mutation occurs at a site. If all sites have the same mutation rate and thus the same probability of a reverse mutation, the probability of mis-inference can be estimated by d/3, where d is the rate of divergence corrected for multiple hits and 1/3 is the probability that a mutation is a reverse mutation, A to T, rather than A to G, when A and T are segregating.15 Differences in the rate of transitions and transversions or other mutational biases can also be incorporated.15 Both Tajima’s D and the H test have good power to detect hitchhiking in the presence of recombination (Fig. 3). In contrast to D the power of H drops rapidly after the hitchhiking event since high frequency variants as measured by H are readily lost due to drift.26-28 Tajima’s D retains power for much longer due to the influx of new low frequency variation during the recovery from a hitchhiking event (Fig. 3). Because variation is recovered first at low, then intermediate, and then high frequencies, a test for a lack of high frequency variation may retain the most power for the longest period of time subsequent to a hitchhiking event. The difference between H and W, HL, is a measure of high frequency compared to low frequency variation, and retains power for the longest period of time subsequent to hitchhiking (Fig. 4). This can be explained by H being the last of the three estimators of θ to reach equilibrium and W being the first to reach equilibrium. Using the expected reduction in heterozygosity in combination with the expected skew in the frequency spectrum in the presence of recombination, Kim and Stephan19 have implemented a maximum likelihood approach to simultaneously test for hitchhiking and to estimate both the location of the advantageous substitution and the strength of selection, given the recombination rate. Although this test appears more powerful than the tests based on different estimators of θ, it requires precise knowledge of the recombination rate and may be more sensitive to nonequilibrium conditions, since the null and the alternative hypotheses are more precisely specified. Yet, it should be noted that the robustness of all tests to violations of the assumptions of the Wright-Fisher model has not been well characterized (see below). In one of the first attempts to explicitly test selective versus demographic explanations, Galtier et al29 have used a maximum likelihood approach to distinguish selection from a population bottleneck using data from Drosophila for which multiple loci have been surveyed for polymorphism. The logic behind the test is that a population bottleneck is expected to reduce levels of variation and skew the frequency spectrum across all loci, whereas a hitchhiking event is expected to be specific to only a fraction of loci.
70
Selective Sweep
Figure 3. A) The expectation of different estimators of θ during and subsequent to hitchhiking. B) The power of the D and H statistics during and subsequent to hitchhiking. The simulation parameters are the same as in Figure 2 except c/s is fixed at 10-3. For each simulated hitchhiking event with at least one segregating site D and H were compared to critical values generated from 104 neutral coalescence simulations with a fixed number of segregating sites equal to that observed in the hitchhiking simulation.
Linkage Disequilibrium Hitchhiking is expected to produce linkage disequilibrium both in the presence and in the absence of recombination.30 During the spread of an advantageous mutation through a population, a haplotype of very tightly linked neutral variants will increase in frequency until fixation. In some instances a second haplotype may remain segregating at appreciable frequencies (>1%) by recombining onto the advantageous chromosome during the hitchhiking event. Farther away from the site under selection, recombination events allow one or more different haplotypes to recombine onto the advantageous chromosome and thus escape extinction. As the distance to the site under selection increases, so does the number of alleles that escape complete hitchhiking (Fig. 3 of ref. 15). If the rate of recombination is low enough so that there is no recombination within the sequence surveyed, but high enough so that variation remains segregating subsequent to hitchhiking, then a strong haplotype pattern may form where all variation is divided among only a few haplotypes. In the extreme case where only two haplotypes remain segregating, all variation may be in complete linkage disequilibrium. A neutral
Detecting Hitchhiking from Patterns of DNA Polymorphism
71
Figure 4. The power of D, H and HL as a function of time since hitchhiking. HL is the difference between W
and
H. The
simulation parameters are the same as those in Figure 3.
model may not be able to explain the presence of a single haplotype at intermediate or high frequency.16,31 In addition to hitchhiking with recombination, a single haplotype could reach high frequency (but not fixation) due to balancing selection, the loss of positive selection during a hitchhiking event, or interference with advantageous or deleterious mutations in the population.16,31 The degree to which hitchhiking produces linkage disequilibrium between two alleles can be measured by r (their correlation coefficient) and by D', the difference between the observed and expected (assuming independence) biallelic frequencies in a sample.32
r=
D′ =
D′ =
f AB − f A f B
(4)
f A f B (1 − f A )(1 − f B )
f AB − f A f B
[
forD ′ > 0
]
min f A f B , (1 − f A )(1 − f B ) f AB − f A f B
[
min f A (1 − f B ), (1 − f A ), f B
]
forD ′ < 0
(5)
(6)
where fA is the frequency of the major allele at the first locus, fB is the frequency of the major allele at the second locus and fAB is the frequency of the AB haplotype. Strong hitchhiking produces more linkage disequilibrium than expected in the absence of recombination, when
72
Selective Sweep
Figure 5. The average of D’ (A) and r (B) as a function (c1+c2)/s, where c1 is the rate of recombination between the selected locus and adjacent neutral locus and c2 is the rate of recombination between the two neutral loci. 4Nc2 = 0 (solid circles), 4Nc2 = 1 (cross), 4Nc2 = 10 (open circles), 4Nc2 = 100 (squares), samples size is 50, 2N = 108.
measured by r and D'.19,26,28 This is true even when some recombination is allowed between the two neutral markers during hitchhiking (Fig. 5). However, previous work has shown that linkage disequilibrium decays rapidly subsequent to hitchhiking.28 More work is necessary to distinguish linkage disequilibrium created by demographic effects or selection. A number of haplotype tests have been developed to detect a high frequency haplotype or a lack of haplotype diversity that may occur during or subsequent to a hitchhiking event. Hudson et al16 developed a test to determine the probability of observing a given number of segregating sites or fewer in a subset of sequences from a sample, and applied this to the Sod locus. The Fs test 25 is equal to ln(S/(1-S)), where S is the probability of having no fewer than k alleles in a sample given π.33 Depaulis and Veuille33 have proposed two tests for an excess of linkage disequilibrium (see also their chapter in this book). One is based on haplotype diversity, and another K, is based on the number of haplotypes, and both are conditioned on the number of segregating sites in a sample. K and Fs are only different in that they are conditioned on different estimators of θ.
Population Subdivision and Changes in Population Size The effect of hitchhiking on linked neutral variation in a structured population, or in one that has recently changed its size, is not easily understood. However, in most cases the qualitative dynamics of hitchhiking are expected to be the same; variation is removed from a population producing a skew in the frequency spectrum and a linkage disequilibrium. Hitchhiking in a structured population is particularly difficult to describe since it depends on the number of subpopulations, the migration rates between subpopulations, and the effective size of these subpopulations. When the number of emigrants is less than one per generation, it has been
Detecting Hitchhiking from Patterns of DNA Polymorphism
73
shown that hitchhiking causes population differentiation as a function of the strength of selection.34 The effect of hitchhiking in a two-dimensional model of isolation by distance has also been studied.8 More important than understanding how hitchhiking is affected by population structure or changes in population size, is how the assumption of a constant panmictic population affects current methods of detecting hitchhiking. If demographic forces produce patterns that resemble hitchhiking, then the rate of erroneously detecting a hitchhiking event (i.e., rate of false positives) may be high. If demographic forces produce a pattern opposite to that of hitchhiking, then the power of detecting hitchhiking (rate of true positives) may be low. For all of the above mentioned tests, the rate of true and false positives is affected by both population subdivision and changes in population size. This results both from the effect of demography on the expectation of statistics such as Tajima’s D, but also from the effect of demography on the variance in D. Selective forces are often distinguished from demographic forces by virtue of fact that the former is expected to be locus specific, while the latter is expected to affect the entire genome. However, if demography has a slight effect on the mean value of a test statistic or only affects the variance of a test statistic, it is likely to remain unnoticed as long as only a few loci across the genome are examined. Thus, it is important to know how changes in population size and population subdivision affect various tests used to detect hitchhiking. A change in population size affects levels of variation, the frequency spectrum, and linkage disequilibrium. An increase in population size causes an increase in levels of low frequency variation and results in a negative Tajima’s D value, whereas a decrease in population size causes a decrease in levels of low and high frequency variation and leads to positive Tajima’s D.35 The variance in Tajima’s D has been shown to decrease in an expanding population36 and is likely increased in a shrinking population. An increase in population size also causes a decrease in linkage disequilibrium as measured by the r statistic.37 Population structure affects patterns of variation in a much more complicated way. Tajima35 studied a simple model of two demes with balanced migration. In the case where samples are drawn from both subpopulations, the heterozygosity increases faster than the number of segregating sites as the rate of migration decreases, thereby producing positive Tajima’s D values. If samples are drawn from just one of the subpopulations, heterozygosity remains unchanged while the number of segregating sites decreases slightly with intermediate rates of migration, 4Nm ≈1, producing slightly negative Tajima’s D values. In contrast, with unbalanced migration where the rate of migration from one population is 19 times greater than from the other, the number of segregating sites increases faster than heterozygosity as rates of migration decrease, when samples are drawn from both populations. Wakeley12 found the variance in heterozygosity both within and between populations increases with the migration rate for a two subpopulation model with balanced migration. Population subdivision is also known to increases levels of linkage disequilibrium.38 Although few statistics have been tested for sensitivity to different population histories, there are obvious cases in which certain events in a population’s history would mimic hitchhiking. For Tajima’s D and Fu and Li’s DFL this would be a recent increase in population size, for the H test—the presence of a rare migrant from a distantly related population or species, and for the haplotype based tests—population subdivision or recent admixture. One case has been studied for the Tajima’s D and for the H test. For a two-subpopulation model with balanced migration where 50 alleles are sampled from a single subpopulation, Tajima’s D is significant in 6% of cases when 4Nm = 1 and in 9% of cases when 4Nm = 0.5, whereas the H test is significant in 14% and 19% of cases for 4Nm = 1 and 0.5, respectively.28 However, under most circumstances the D and H tests would not be applied to a sample from a single isolated population. When sample are drawn from a mixture of subpopulations, the D and the H statistics are likely conservative because subdivision tends to produce an excess of intermediate frequency variation as compared to low frequency variation.
74
Selective Sweep
The simplest way of distinguishing demographic from selective effects is by surveying other unlinked loci in the genome. Any demographic perturbation is expected to affect all loci, whereas selection is expected to be specific to only a few loci. Subtle demographic effects, such as an increase in the variance of a statistic, are the most worrisome since they may remain unnoticed in a survey of a small number of genes but may still affect the rate of false positives of a test. Multiple independent lines of evidence, such as a regional reduction in levels of variation in combination with a skew in the frequency spectrum should be used to rule out a demographic explanation.
Distinguishing Background Selection and Hitchhiking in Regions of Low Recombination One of the few genome wide patterns in polymorphism data that cannot be attributed to mutation and drift is the correlation between levels of variation and rates of recombination. This observation has now been made in numerous species, but it is still debated as to its cause.39 The observation cannot be explained by different mutation rates, because rates of recombination are not correlated with divergence between species. However, there is accumulating evidence for heterogeneity in levels of divergence between two species, suggesting mutation rates may vary across the genome.40 A question that has not been answered is the extent to which heterogeneity in levels of variation across the genome can be explained by mutational heterogeneities alone. The effect of regional differences in mutation rates across the genome must be accounted for in explaining low levels of variation in regions of low recombination. Both background selection and recurrent hitchhiking can produce reduced levels of variation in regions of low recombination. With a sufficiently high rate of deleterious mutations per cM, background or purifying selection against deleterious mutations removes linked neutral variation, essentially reducing a population’s effective size.13 With a sufficiently high rate of adaptive substitutions driven by sufficiently strong selection, recurrent hitchhiking events may also maintain low levels of variation across an entire region of low recombination.41 Tajima’s D statistic is often used to distinguish between background selection and hitchhiking.42 Simulation studies have shown that recurrent hitchhiking events in the presence of recombination produce an excess of low frequency variants and significantly negative D values.41 In contrast, simulation studies have shown that background selection produces little or no skew in the frequency spectrum if Ns is sufficiently large, where s is the strength of selection against deleterious mutations.13,33,43 When background selection does affect the frequency spectrum, Fu and Li’s D has the most power to detect it.25 Numerous polymorphism surveys were conducted in regions of low recombination with the aim of distinguishing background selection from hitchhiking by means of a skew in the frequency spectrum as measured by Tajima’s D.42-49 However, in many of these cases there was so little variation found that there was no power to detect a significant skew in the frequency spectrum. If selection is so weak that deleterious mutations reach detectable frequencies (>1%) in a population, these mutations and neutral mutations linked to them are expected to produce an excess of low frequency variation as compared to common variation. Studies of allozyme variation in humans and fruit flies indicate that a large proportion of low frequency amino acid variants are slightly deleterious and that they reach detectable frequencies in a population.50 By comparing the distribution of amino acid variation to synonymous variation, demographic explanations were ruled out and many of these deleterious mutations were shown to reach frequencies of 1-10% for both humans51 and D. melanogaster.52 Forward simulations of purifying selection show that mutations with 2Ns values as small as 6 can reduce levels of variation and produce negative D values in the absence of recombination.53 The same effect is found when deleterious mutations are gamma distributed and there is no recombination.54 Thus, at
Detecting Hitchhiking from Patterns of DNA Polymorphism
75
least in the absence of recombination, background selection may produce negative D values as long as a sufficient number of slightly deleterious mutations are present. The H test can be used to distinguish hitchhiking and background selection in regions of low recombination. The H statistic should not be affected by background selection, which only skews the frequency spectrum at low frequencies. In fact, in the presence of background selection hitchhiking may produce a larger excess of high frequency variants as compared to intermediate frequency variants than in the absence of background selection. The greater number of high frequency variants is the result of the excess of low frequency variants present prior to hitchhiking. It is these low frequency variants that are swept to high frequencies during hitchhiking. Thus, under the extreme example where only low frequency variants are present in a population, hitchhiking may produce only high frequency variants since all low frequency variants are either swept to high frequency or to frequencies too low to be detected. There are a number of regions where this has been observed. For example, the y-ac region located at the tip of the X chromosome of D. melanogaster shows three high frequency RFLP variants.15 Similarly, five olfactory receptor pseudogenes in a 450 kb region of the human genome contain predominantly high frequency variants.55 To distinguish background selection from hitchhiking the H test must have reasonable power to detect recurrent hitchhiking events. Recurrent hitchhiking is different from a single hitchhiking event since at the start of each hitchhiking event the population is not at equilibrium. In most instances the population is likely recovering from the last hitchhiking event and so should have an excess of low frequency variants. The next hitchhiking event is expected to sweep low frequency variation to high or lower frequencies. Although coalescence simulations show that the H test has little power to detect recurrent hitchhiking events, this has been studied only for very strong selection and infrequent hitchhiking events, thus imposing a limitation on the approach.28 Under these conditions, the power of detecting hitchhiking using the H test drops quickly subsequent to the fixation of the advantageous mutation. However, as the frequency of hitchhiking events increases, the neutral frequency spectrum may approach a U shaped distribution, which is the expected frequency distribution for mutations under positive selection.1 Finally, background selection and hitchhiking may be distinguished in a subdivided population if hitchhiking occurs exclusively or predominantly in only some of the subpopulations.56 Background selection is expected to have similar effects in all subpopulations, whereas hitchhiking may be subpopulation-specific. For example, the vermilion locus was shown to have significantly reduced levels of variation in two out of four subpopulations of D. ananassae.56
Conclusions and Future Directions Significant advances have been made in detection of positive selection using DNA polymorphism data. While a slew of new test statistics have been developed and shown to have power to detect hitchhiking, it is a standard practice to assume no recombination in a randomly mating Wright-Fisher population for determining the cutoff values for these tests. As genomic surveys of polymorphism become available, reliable estimates of the recombination rate and populations’ demographic history can be made,36,57 thus improving the use of existing tests and perhaps leading to the development of new ones. In the meantime, convincing evidence for hitchhiking must include multiple lines of evidence, such as a local reduction in levels of variation and a local skew in the frequency spectrum. Genomic surveys of polymorphism will provide some indication of the number and location of loci in the genome that have recently experienced a hitchhiking event, and will clarify the relative contributions of background selection and hitchhiking to the reduction in levels of variation in regions of low recombination. Examination of high frequency variation will be particularly helpful here, since low frequency variation is similarly influenced by both background selection and hitchhiking.
76
Selective Sweep
References 1. Ewens WJ. Mathematical population genetics. Springer-Verlag: 1979. 2. Kimura M, Ohta T. The average number of generations until extinction of an individual mutant gene in a finite population. Genetics 1969; 63(3):701-709. 3. Simonsen KL, Churchill GA, Aquadro CF. Properties of statistical tests of neutrality for DNA polymorphism data. Genetics 1995; 141(1):413-429. 4. Wiehe THE, Stephan W. Analysis of a genetic hitchhiking model, and its application to DNA polymorphism data from Drosophila melanogaster. Mol Biol Evol 1993; 10(4):842-854. 5. Maynard-Smith J, Haigh J. The hitch-hiking effect of a favourable gene. Genet Res 1974; 23(1):23-35. 6. Kaplan NL, Hudson RR, Langley CH. The “hitchhiking effect” revisited. Genetics 1989; 123(4):887-899. 7. Barton NH. The effect of hitch-hiking on neutral genealogies. Genet Res 1998; 72:123-133. 8. Barton NH. Genetic hitchhiking. Philos Trans R Soc Lond B Biol Sci 2000; 355(1403):1553-1562. 9. Stephan W, Wiehe THE, Lenz MW. The effect of stongly selected substitutions on neutral polymorphism: Analytical results based on diffusion theory. Theor Popul Biol 1992; 41:237-254. 10. Hudson RR, Kreitman M, Aguade M. A test of neutral molecular evolution based on nucleotide data. Genetics 1987; 116(1):153-159. 11. Moriyama EN, Powell JR. Intraspecific nuclear DNA variation in Drosophila. Mol Biol Evol 1996; 13(1):261-277. 12. Wakeley J. The variance of pairwise nucleotide differences in two populations with migration. Theor Popul Biol 1996; 49(1):39-57. 13. Charlesworth B, Morgan MT, Charlesworth D. The effect of deleterious mutations on neutral molecular variation. Genetics 1993; 134(4):1289-1303. 14. Aguade M, Miyashita N, Langley CH. Polymorphism and divergence in the Mst26A male accessory gland gene region in Drosophila. Genetics 1992; 132(3):755-770. 15. Fay JC, Wu C-I. Hitchhiking under positive Darwinian selection. Genetics 2000; 155(3):1405-1413. 16. Hudson RR, Bailey K, Skarecky D et al. Evidence for positive selection in the superoxide dismutase (Sod) region of Drosophila melanogaster. Genetics 1994; 136(4):1329-1340. 17. Hudson RR, Saez AG, Ayala FJ. DNA variation at the Sod locus of Drosophila melanogaster: An unfolding story of natural selection. Proc Natl Acad Sci USA 1997; 94(15):7725-7729. 18. Nurminsky D, Aguiar DD, Bustamante CD et al. Chromosomal effects of rapid gene evolution in Drosophila melanogaster. Science 2001; 291(5501):128-130. 19. Kim Y, Stephan W. Detecting a local signature of genetic hitchhiking along a recombining chromosome. Genetics 2002; 160(2):765-777. 20. Tajima F. The effect of change in population size on DNA polymorphism. Genetics 1989; 123(3):597-601. 21. Tajima F. Evolutionary relationship of DNA sequences in finite populations. Genetics 1983; 105(2):437-460. 22. Watterson GA. On the number of segregating sites in genetical models without recombination. Theor Popul Biol 1975; 7(2):256-276. 23. Andolfatto P, Przeworski M. A genome-wide departure from the standard neutral model in natural populations of Drosophila. Genetics 2000; 156(1):257-268. 24. Fu YX. Statistical properties of segregating sites. Theor Popul Biol 1995; 48(2):172-197. 25. Fu YX. Statistical tests of neutrality of mutations against population growth, hitchhiking and background selection. Genetics 1997; 147(2):915-925. 26. Fay JC. Detecting natural selection from patterns of DNA polymorphism and divergence. PhD thesis, University of Chicago; 2001. 27. Kim Y, Stephan W. Joint effects of genetic hitchhiking and background selection on neutral variation. Genetics 2000; 155(3):1415-1427. 28. Przeworski M. The signature of positive selection at randomly chosen Loci. Genetics 2002; 160(3):1179-1189. 29. Galtier N, Depaulis F, Barton NH. Detecting bottlenecks and selective sweeps from DNA sequence polymorphism. Genetics 2000; 155(2):981-987. 30. Thomson G. The effect of a selected locus on linked neutral loci. Genetics 1977; 85(4):753-788.
Detecting Hitchhiking from Patterns of DNA Polymorphism
77
31. Kirby DA, Stephan W. Haplotype test reveals departure from neutrality in a segment of the white gene of Drosophila melanogaster. Genetics 1995; 141(4):1483-1490. 32. Lewontin RC. The interaction of selection and linkage. I. General considerations heterotic models. Genetics 1964; 49:49-67. 33. Depaulis F, Veuille M. Neutrality tests based on the distribution of haplotypes under an infinite-site model. Mol Biol Evol 1998; 15(12):1788-1790. 34. Slatkin M, Wiehe T. Genetic hitch-hiking in a subdivided population. Genet Res 1998; 71(2):155-160. 35. Tajima F. Statistical method for testing the neutral mutation hypothesis by DNA polymorphism. Genetics 1989; 123(3):585-595. 36. Pluzhnikov A, DiRienzo A, Hudson RR. Inferences about human demography based on multilocus analyses of noncoding sequences. Genetics 2002; 161(3):1209-1218. 37. Pritchard JK, Przeworski M. Linkage disequilibrium in humans: Models and data. Am J Hum Genet 2001; 69(1):1-14. 38. Wall JD. Detecting ancient admixture in humans using sequence polymorphism data. Genetics 2000; 154(3):1271-1279. 39. Andolfatto P. Adaptive hitchhiking effects on genome variability. Curr Opin Genet Dev 2001; 11(6):635-641. 40. Williams EJ, Hurst LD. Is the synonymous substitution rate in mammals gene-specific? Mol Biol Evol 2002; 19(8):1395-1398. 41. Braverman JM, Hudson RR, Kaplan NL et al. The hitchhiking effect on the site frequency spectrum of DNA polymorphisms. Genetics 1995; 140(2):783-796. 42. Andolfatto P, Przeworski M. Regions of lower crossing over harbor more rare variants in African populations of Drosophila melanogaster. Genetics 2001; 158(2):657-665. 43. Charlesworth D, Charlesworth B, Morgan MT. The pattern of neutral molecular variation under the background selection model. Genetics 1995; 141(4):1619-1632. 44. Begun DJ, Aquadro CF. Evolution at the tip and base of the X chromosome in an African population of Drosophila melanogaster. Mol Biol Evol 1995; 12(3):382-390. 45. Berry AJ, Ajioka JW, Kreitman M. Lack of polymorphism on the Drosophila fourth chromosome resulting from selection. Genetics 1991; 129(4):1111-1117. 46. Hamblin MT, Aquadro CF. High nucleotide sequence variation in a region of low recombination in Drosophila simulans is consistent with the background selection model. Mol Biol Evol 1996; 13(8):1133-1140. 47. Jensen MA, Charlesworth B, Kreitman M. Patterns of genetic variation at a chromosome 4 locus of Drosophila melanogaster and D. simulans. Genetics 2002; 160(2):493-507. 48. Langley CH, Lazzaro BP, Phillips W et al. Linkage disequilibria and the site frequency spectra in the su(s) and su(w(a)) regions of the Drosophila melanogaster X chromosome. Genetics 2000; 156(4):1837-1852. 49. Wayne ML, Kreitman M. Reduced variation at concertina, a heterochromatic locus in Drosophila. Genet Res 1996; 68(2):101-108. 50. Ohta T. Statistical analyses of Drosophila and human protein polymorphism. Proc Natl Acad Sci USA 1975; 72:3194-3196. 51. Fay JC, Wyckoff GJ, Wu C-I. Positive and negative selection on the human genome. Genetics 2001; 158(3):1227-1234. 52. Fay JC, Wyckoff GJ, Wu C-I. Testing the neutral theory of molecular evolution with genomic data from Drosophila. Nature 2001; 415(6875):1024-1026. 53. Gordo I, Navarro A, Charlesworth B. Muller’s Ratchet and the Pattern of Variation at a Neutral Locus. Genetics 2002; 161(2):835-848. 54. Williamson S, Orive ME. The genealogy of a sequence subject to purifying selection at multiple sites. Mol Biol Evol 2002; 19(8):1376-1384. 55. Gilad Y, Segre D, Skorecki K et al. Dichotomy of single-nucleotide polymorphism haplotypes in olfactory receptor genes and pseudogenes. Nat Genet 2000; 26(2):221-224. 56. Stephan W, Xing L, Kirby DA et al. A test of the background selection hypothesis based on nucleotide data from Drosophila ananassae. Proc Natl Acad Sci USA 1998; 95(10):5649-5654. 57. Frisse L, Hudson RR, Bartoszewicz A et al. Gene conversion and different population histories may explain the contrast between polymorphism and linkage disequilibrium levels. Am J Hum Genet 2001; 69(4):831-843.