Detection of Drowsiness based on HOG features and SVM classifiers Leo Pauly, Deepa Sankar Division of Electronics Engineering School of Engineering Cochin University of Science and Technology Kochi -682022, Kerala, India
[email protected],
[email protected] Abstract—This paper presents an accurate method of drowsiness detection for the images obtained using low resolution consumer grade web cameras under normal lighting conditions. The drowsiness detection method uses Haar based cascade classifier for eye tracking and combination of Histogram of oriented gradient (HOG) features combined with Support Vector Machine (SVM) classifier for blink detection. Once the eye blinks are detected then the PERCLOS is calculated from it. If the PERCLOS value is greater than 6 seconds then the person is said to be drowsy. The presented system was validated by comparing the prediction of the system with that of a human rater. The system matched with the human observer with 91.6 % accuracy. Index Terms— Drowsiness detection, Eye tracking, blink detection, PERCLOS, Haar based cascade classifier, SVM, HOG feature
I. INTRODUCTION Drowsiness is an involuntary human physical activity. Webster’s Dictionary defines drowsiness as a feeling of being sleepy and lethargic [1]. Since drowsiness can be directly related to the human concentration and activeness, drowsiness detection has been applied in fields like in human behavioral analysis, fatigue detection, alertness level measurement etc. A lot of different methods have been proposed for drowsiness detection. These methods can be broadly divided into two categories: Intrusive methods and Non- Intrusive methods. Intrusive methods include the introduction of measuring apparatus on the human body, whereas in Nonintrusive methods no devices come in direct contact with human body. The methods such [2]-[7] are some of the examples of intrusive drowsiness detection methods and methods such as [8]-[12] are some of the non-intrusive methods used for drowsiness detection. But most of these methods face many challenges. The intrusive methods always require measuring devices to be in contact with human body and additional hardware devices. In non intrusive methods, high resolution cameras are required for capturing images. Even though, most of the methods give high accurate results in constrained lab environments, the performance of these systems comes down when used in real world conditions in an unconstrained environment. In this background, this paper presents a new method for drowsiness detection using consumer grade web cameras. It
uses a Haar based cascade classifier based method for eye tracking, Histogram of Oriented Gradients (HOG) and Support Vector machines (SVM) for blink detection. After blink detection the PERCLOS value is calculated. If the PERCLOS value is greater than 6000ms then the person is said to be drowsy. The presented system is very much user friendly, non intrusive and doesn’t require any specialized hardware. It performs well in uncontrolled lighting conditions under normal resolutions of an USB web camera. The prototype of the system was developed using MATLAB 2014a. The reliability of the system was verified by comparing its performance with the judgments of a human rater. The system has shown a 91.6% match with the judgments of that of a human rater. II. DEVELOPED SYSTEM The different steps involved in the algorithm of the developed system are as follows: 1. Capturing video frames using the web camera 2. Face detection and extraction 3. Eye region Extraction and Eye detection 4. Blink detection 5. PERCLOS Calculation 6. Drowsiness detection Each of these steps is explained in the following sections in detail. A. Capturing Image using the web camera In the first step, the video of the subject under test is captured using the web camera. The video captured is stored as a collection of frames (images). Each of these frames are extracted and processed separately. B. Detection and extraction of face image From the video frames captured by the web camera, the faces are extracted. For this, the face detection method of Haar based cascade classifiers proposed by Viola and Jones [13] is used.
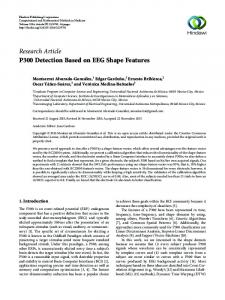
1) Haar features: The face detection method uses Haar features for face detection. Haar features are extracted by using a set of rectangular black and white windows. The black color has a weight of -1 and the white region has weight 0. The windows are first applied to the image and corresponding values are multiplied with the pixel intensities. Then these values are added together, and the Haar feature corresponding to the window used is obtained. But all the Haar features extracted are not required for successful detection of faces. Hence a boosting algorithm [14] is used to find the most important features that can be used for face detection. 2) Cascade classifiers: Once the Haar features are obtained then individual classifiers are built based on the values of each Haar feature. These individual classifiers are then arranged into a cascade classifier. A cascaded classifier is combination of several classifiers arranged in the different stages cascaded on after one another. The number of classifiers in each stage and their threshold values are determined by the boosting algorithm during the training of the classifiers with labeled face images. The cascade classifier used here has 22 stages and a total of 2135 features. 3) Face detection: The general structure of the cascade classifier is given in Fig 1. A certain number of features are checked at each stage of the cascade classifier. When a region of the image is taken it is first checked using the first stage of the cascade classifier. If the image region fails to pass the first stage it will be rejected as it does not contain a face else it will be passed to the next stage. If the face region satisfies all the stages then the region is classified to have a face in it. The advantage of using a cascade classifier is that it can reduce computational load as each stage need only a certain set of the features to be extracted rather than the entire set of 2135 features extracted together.
Fig 1: Geometric ratios of human face C. Eye Region Extraction and eye detection Once the face images are obtained the eye region is to be extracted. The regions containing eyes extracted using the geometrical properties of the human face. According to [15] there is geometrical ratio being followed in the arrangement of organs like eyes, nose, mouth etc. If d corresponds to the total length of the human face then the eye region lies between .2d to .6d from the top of the human face. The Fig 2 shows these geometrical proportionalities of the human face. This concept is used to extract the eye region from the human face. The
process is illustrated in detail in section III during the discussion of implementation.
Fig 2: Geometric ratios of human face Once the eye regions are obtained then the next step is to detection of eyes in those regions. The left and right eye regions are processed separately. Eye detection is performed using Haar based cascade classifier described in section II.B. Here a cascade classifier trained with eye images is used. The classifier classifies the eye region into portions that contains eye and those portions that do not contain an eye. Then the portions containing an eye are extracted and thus the eyes are detected. These eye images are then sent to the next stage for further processing. But this detection method fails when the eyes are closed. In such situations the eyes images are cut out from the positions of eyes in the extracted eye region from the preceding frame in the video sequence. D. Blink detection: Once the eyes are detected next stage is the blink detection. The presented system uses a Histograms of Oriented Gradients (HOG) as features and Support Vector Machines as binary classifiers for eye blink detection from the eye images. 1) HOG features: The HOG features [16] method was developed by Dalal and Trigs in 2005. It is a feature descriptor that is used for various object detection applications in the field of computer vision. The key idea of the HOG features is to group gradient magnitudes into bins in a histogram based on its orientation. HOG features are extracted from the eye images obtained in the previous section. For that the image is first resizes into 24x24 pixels. Then the image is divided into 4 blocks of size 16x16 pixels with each block overlapping half of the region covered by the preceding block. Each block has 4 cells of size 8x8 pixels. Next the gradients are computed for each pixel inside the cells using Sobel filters. These gradients magnitudes are then plotted in a histogram which has magnitudes on the yaxis and orientations in the x-axis. The x-axis is divided into 9 bins, each bin having a width of 20 degrees. The gradient magnitudes are then arranged into these 9-bin histograms based on their orientation. The value of each of these 9 bins corresponds to the feature values extracted from each cell of the image. Thus each cell of 64 pixels is represented using 9
feature values. Then these feature values of all the cells inside each block are concatenated to obtain the final feature descriptor. The Fig 3 shows the HOG features extracted from the open and closed eye images. A more detailed description of the HOG features can be seen in [16].
problem and it is solved using Lagrange multipliers αi (i = 1,...l). In case the data is not linearly separable then it is first mapped into another feature space where it is linearly separable using Kernel function. Then the equation becomes: n
f ( h) =
∑ α y V (h , h(i)) + b i
i
i
i =1
where V represents the Kernel function. In the presented system the SVM classifier uses a Gaussian Radial Basis function for mapping the data into another feature space. The classifiers are trained using 40 eye images each of open and closed eyes. Once the classifier is trained then the test images are classified applied to the classifier for classification. E. Measurement of PERCLOS PERCLOS [18] is a measure of the duration of time in which the eyes were closed. It is defined as the amount of time the eyelids remain closed in 1 min. PERCLOS (in seconds) is calculated in the presented system using the following equation: No of frames in which eyes are closed in one min x 60 Total number of frames in one minute
Fig 3: HOG features extracted from the open and closed eyes 2) SVM classifier: Support Vector Machines were initially developed by Vapnik and his team. It was later improved by other researchers. It is a statistical learning model used commonly for classification problems. A detailed description of the SVM is given in [17]. Let the data points of the eye images be represented by: (h1,y1), (h2,y2)..... (hn,yn) were hi represent the HOG feature vector representing the nth eye image and yn represent the class of the nth eye image. y can have two values 0 or a 1. 0 represents the closed eye image and 1 represents the open eye image. The basic idea of the HOG features is to find a hyper plane with the maximum margin that separates the two classes. In case of linearly separable data the hyper plane in terms of support vectors is given by: n
f ( h) =
∑ α y h (.)h(i) + b i
i i
i =1
were yi denotes the class of the data point hi and h(i) represents the support vector machines. This is a Lagrange optimization
F. Drowsiness Detection Once the PERCLOS value of the user is calculated next step is to detect whether the person in a drowsy state or not. Basic principle is that the eyes are closed for longer durations when the person is drowsy than when the person is in active state. Hence if the value of PERCLOS exceeds above a particular threshold then the person can be said to be in a drowsy state else the person can be said to be active. According to [19] the average blink duration of a human being is 100-400 ms and the number of blinks per second is 10-15 from [20]. From these values the time interval for which human eyes will be closed in 1 minute would be = 400 x 15 = 6000ms for a normal person when he is in the active state. So the threshold value for PERCLOS is estimated to be 6.00 seconds. If the PERCLOS duration exceeds this limit then the person is estimated to be in a drowsy state else he is said to be active. III. RESULTS & DISCUSSIONS A. Implementation In the presented system the video frames are captured using an ordinary CMOS web camera which has a resolution of 640×480 pixels and has a frame rate of 5ps. Since the captured video is as an array of video frames (images), each of these image frames are separated and processed individually. The Fig 4 shows a single video frame extracted from the video captured by the web camera.
(b)
Fig 4: Video frame captured by the web camera Then the face is detected from the image using Haar based cascade classifier described in section 2.2. The classifier classifies the frames into portions that contain a face and into that does not contain a face. The portion containing a face is extracted and thus the faces are detected. The Fig 5 shows the face detection algorithm working on the frame captured by the web camera.
Fig 5: Face detected from the frame using Haar based cascade classifier The geometrical properties of human face are computed, in the face image extracted from the video frame as mentioned in the section II.C. These geometrical ratios and extracted eye regions is shown in Fig 6(a) and Fig 6(b) respectively. This extracted eye region is then separated into two regions by cutting exactly at the center as shown in Fig 6(c) and sent to the next stages for further processing.
(a)
(c) After that just like the face detection is performed by the Haar based cascade classifiers, these are used for detection of eyes from the eye region as explained in section II.D. The Fig 7 shows the left and right eyes extracted from the two eye regions. These eye images are passed on to the next stage for further classification.
Fig 7: Eyes detected using Haar based cascade classifier applied on the eye region With the extraction of the eyes as shown in Fig 7 the eye tracking algorithm is completed. The eyes are tracked successfully from the video frame extracted from the video sequence. Next is the eye blink detection. For detecting the eye blinks the combination of HOG features and SVM classifier is used. 144 HOG features are extracted from each eye image. These feature values are applied to the trained SVM classifier which classifies the eye image into either open or closed classes. Next is the PERCLOS measurement. To measure the PERCLOS number of frames in which the eyes were detected to be blinked was calculated. Then it was divided by the number of frames in each minute. If the value is greater than 6 second then the person is said to be drowsy else he is termed as active. B. Validation For validating the efficiency of the method, twelve test videos of different durations and frame rates captured under normal lighting conditions of an ordinary room was used. The Fig 8 shows the sample frames from the test videos used.
Table 1: Comparison of predictions made by the developed and system and human rater
Fig 8: Sample frames from the test videos used Then the algorithm is applied on to the test videos and the PERCLOS value is calculated. From the PERCLOS value it is determined whether the subject is drowsy or not. Then the correctness of the prediction is validated by a human rater. The human rater was asked to rate the drowsiness level based on a sleepiness scale Karolinska Sleepiness Scale (KSS) [21]. For simplicity the KSS scale was further divided into 2 broad categories ‘Active’ and ‘Drowsy’ [22]. The Fig 9 shows the KSS scale and its two category classification.
Sub No: 1 2 3 4 5 6 7 8 9 10 11 12
Time (sec) 35 31 100 68 79 65 46 47 40 36 38 37
Resolutio n 640 x 480 320 x234 480 x 360 640 x 480 640 x 360 640 x 360 640 x 480 640 x 480 640 x 480 640 x 480 320 x 184 320 x 184
Fp s 30 25 15 10 15 15 30 30 30 30 30 30
PERCL OS (s) 26.71 15.11 18.71 1.09 3.05 17.48 9.09 27.72 2.74 39.37 27.41 4.02
Predicti on Drowsy Drowsy Drowsy Active Active Drowsy Drowsy Drowsy Active Drowsy Drowsy Active
Human rater 9 7 7 1 5 9 6 8 4 9 8 2
From the table it can be inferred that the presented system was successful in detecting human drowsiness. The predictions of the human rater and the system matched in 11 out of the 12 cases tested. The wrongly classified case is highlighted in the above table. Thus the system has an accuracy of 91.6% accuracy. VI.
Fig 9: Karolinska Sleepiness Scale divided into two clases The human rater views the videos and determines whether the subject is actually drowsy by rating based on the KSS scale provided in the form of a graphical scale. The Fig 10 shows the graphical scale used by the human rate. The results are tabulated in the following Table 1.
CONCLUSIONS AND FUTURE SCOPE
In this paper a drowsiness detection method on the images obtained using web cameras is presented. The system uses the Haar based cascade classifier for eye tacking and HOG-SVM combination for eye blink detection. After blink detection the PERCLOS value was calculated. If the PERCLOS value was greater than 6seconds the person was detected to be drowsy and else he was termed as active. The system was further validated by comparing results with the observations of a human rater. The system gave results with accuracy comparable to that of a human observer. The presented system performs well under the normal lighting conditions and normal resolutions. The method is non intrusive and hence user friendly. It doesn’t need any special hardware other than a normal web camera. This makes the system suitable to be implemented in desktop computers, mobile devices and so on. This method can be used in wide variety of applications like driver alertness measurement, liveliness detection, concentration measurement, measure of attentiveness etc. REFERENCES [1] Sandberg, David, et al. “The characteristics of sleepiness during real driving at night—a study of driving performance, physiology and subjective experience”, Sleep 34.no.10, pp.1317 2011. [2] Lin, C. T., Chang, C. J., Lin, B. S., Hung, S. H., Chao, C. F., & Wang, I. J. “A real-time wireless brain–computer interface
Fig 10: Graphical scale used by human rater
[3]
[4]
[5]
[6]
[7]
[8]
[9]
[10]
[11]
[12]
[13]
[14] [15]
[16]
[17]
system for drowsiness detection”, In IEEE Transactions on Biomedical Circuits and Systems, 4(4), 214-222, 2010. Lin, C. T., Chen, Y. C., Huang, T. Y., Chiu, T. T., Ko, L. W., Liang, S. F., ... & Duann, J. R. “Development of wireless brain computer interface with embedded multitask scheduling and its application on real-time driver's drowsiness detection and warning”, In IEEE Transactions on Biomedical Engineering, 55(5), 1582-1591, 2008. Picot, Antoine, Sylvie Charbonnier, and Alice Caplier. "On-line automatic detection of driver drowsiness using a single electroencephalographic channel”, In proceedings of 30th Annual International Conference of the Engineering in Medicine and Biology Society, 2008. EMBS, IEEE, 2008. Pal, Nikhil R., et al. “EEG-based subject-and sessionindependent drowsiness detection: an unsupervised approach”, EURASIP Journal on Advances in Signal Processing, 2008. Lin, Chin-Teng, et al. “EEG-based drowsiness estimation for safety driving using independent component analysis”, Circuits and Systems I: Regular Papers, IEEE Transactions on 52.12, pp 2726-2738, 2005. Sahayadhas, Arun, Kenneth Sundaraj, and Murugappan Murugappan. "Drowsiness detection during different times of day using multiple features." Australasian Physical & Engineering Sciences in Medicine 36.2, pp.243-250, 2013. Kurian, D., Johnson Joseph, P. L., Radhakrishnan, K., & Balakrishnan, A. “Drowsiness Detection using Photoplethysmography Signal. In Fourth International Conference on Advances in Computing and Communications (ICACC), pp. 73-76, IEEE, 2014. Patel, S. P., Patel, B. P., Sharma, M., Shukla, N., & Patel, H. M. “Detection of Drowsiness and Fatigue level of Driver”, In International Journal for Innovative Research in Science and Technology, 1(11), 133-138, 2015. Jo, J., Lee, S. J., Jung, H. G., Park, K. R., & Kim, J. “Visionbased method for detecting driver drowsiness and distraction in driver monitoring system”, Optical Engineering, 50(12), 2011. Dasgupta, A., George, A., Happy, S. L., & Routray, A. “A vision-based system for monitoring the loss of attention in automotive drivers”, In IEEE Transactions on Intelligent Transportation Systems, 14(4), 1825-1838, 2013. You, Chuang-Wen, et al. “CarSafe: a driver safety app that detects dangerous driving behavior using dual-cameras on smartphones”, In Proceedings of the 2012 ACM Conference on Ubiquitous Computing, ACM, 2012. Viola, Paul, and Michael Jones. “Rapid object detection using a boosted cascade of simple features”, In Proceedings of the 2001 IEEE Computer Society Conference on Computer Vision and Pattern Recognition (CVPR), Vol. 1. IEEE, 2001. Freund, Y., Schapire, R.E.: “A short introduction to boosting” J. Jap. Soci. Artif. Intell. 14(5), 771–780, 1999. Oguz, Ö. "The proportion of the face in younger adults using the thumb rule of Leonardo da Vinci." Surgical and Radiologic Anatomy 18.2, pp.111-114, 1996. Dalal, Navneet, and Bill Triggs. “Histograms of oriented gradients for human detection” In proceedings of IEEE Computer Society Conference on Computer Vision and Pattern Recognition (CVPR) 2005, vol. 1, pp. 886-893. IEEE, 2005. Cristianini, Nello, and John Shawe-Taylor. An introduction to support vector machines and other kernel-based learning methods. Cambridge university press, 2000.
[18] Wierwille, W. W. “Historical perspective on slow eyelid closure: Whence PERCLOS”, Ocular Measures of Driver Alertness, Technical Conference Proceedings. 1999. [19] Schiffman, H.R., Sensation and Perception. An Integrated Approach, New York: John Wiley and Sons, Inc., 2001 [20] https://www.ucl.ac.uk/media/library/blinking [21] Murray W Johns, “What is excessive day time sleeping?”, 2009. [22] Trutschel, Udo, et al. “PERCLOS: An alertness measure of the past” In Proceedings of the Sixth International Driving Symposium on Human Factors in Driver Assessment, Training and Vehicle Design. 2011.