2015 2nd International Conference on Signal Processing and Integrated Networks (SPIN)
Detection of Oil Spills Using Feature Extraction and Threshold Based Segmentation Techniques Garima Vyas1, Anupama Bhan2 , Divya Gupta3 Amity School Of Engineering and Technology, Amity University, Noida, India
[email protected] ,
[email protected] ,
[email protected]
Abstract— Satellite images can improve the possibilities for the detection of oil spills as they cover large areas and offer an economical and easier way of continuous coast areas patrolling. There are many common techniques to detect dark formations on the SAR images. This paper mainly focuses on method with spot feature extraction and global thresholding. The main approach used in this paper is detecting the dark spots, using local and global threshold algorithms. For each dark spot, a number of features are calculated in order to classify the slick as either oil or other possible geographical or natural components of water. The proposed threshold algorithm, initially analyzes the SAR images, and then assigns a probability to the dark spot to indicate whether it is an oil spill or look alike. Keywords—Local Thresholding, Oil Spills, Masking, Global Thresholding, Gamma Correction.
I.
physical and chemical properties. As these progresses, the oil threatens surface resources and a wide range of aquatic organisms, which are species with varied sensitivities to the harmful effects of contamination. The method developed by existing methods provides a comprehensive review of the use of Synthetic Aperture Radar images (SAR) for detection of oil spill and other discharges from ships into water bodies. The project summarizes the current state of the art, covering operational and research aspects of the developed and under development applications to detect oil spills. Satellite images can improve the possibilities for the detection of oil spills as they cover large areas and offer an economical and easier way of continuous coast areas patrolling. The paper focuses on the use of the manual and automatic approaches to distinguish oil spills from other natural phenomena and geographical topography. The most common techniques to detect dark formations on the SAR images has been discussed, and also the detailed method with spot feature extraction and global thresholding is implemented. Experiments are preformed on the MODIS ( Moderate Resolution Imaging Spectroradiometer) images which is a key instrument aboard the Terra and Aqua satellites. Terra MODIS and Aqua MODIS view the entire Earth's surface every one to two days, acquiring data in 36 spectral bands, or groups of wavelengths, with high detail of the geographical features, and their intensities.
INTRODUCTION
O
il spills, generally defined are spread of oil over water bodies due to man-made or natural causes, which endanger public health, drinking water, devastate natural resources, and disrupt the economy due to huge monetary losses. In an increasingly technological era, the world has become more dependent upon oilbased products to help us maintain our industries and automobiles. Non-petroleum oils, such as vegetable oils and animal fats, are increasingly consumed the world over. These oils can contain toxic components and have the capability to cause physical effects that are similar to petroleum oils. These toxic properties and harmful physical effects, spills of non-petroleum oils also pose threats to public health and the environment. Oil spilled into an aquatic environment, can harm organisms that live on or around the water surface and also underwater. Spilled oil can also damage the food chain, and also human food resources.
Solberg et al. [1] suggested an automatic statistical approach while Del Frate et al. [2] used a neural network classifier for oil spill detection. Espedal and Wahl [3] utilized wind history information to detect oil spills and spread demographics, Espedal et al. [4] focused on detection near offshore platforms and Fiscella et al. [5] used a probabilistic approach for detection and discrimination using feature extraction. The first reconnaissance study for the Mediterranean Sea using more than 1600 SAR images was performed by Pavlakis et al. [6]. The second wave of interest on the subject came some years later, with new techniques and methodologies, such as De Souza et al. [7] presented an intelligent system to extract features from oil slicks, Keramitsoglou et al. [8] an automatic system based on fuzzy logic, Topouzelis et al. presented an updated study on discrimination using neural networks.
The severity of the oil spill depends on a variety of factors. Natural conditions, such as water temperature and weather, affect the behavior of oil in aquatic environments. Various types of habitats have differing sensitivities to oil spills as well. Spilled oil immediately moves with the weather, breaking down and changing its
978-1-4799-5991-4/15/$31.00 ©2015 IEEE
579
2015 2nd International Conference on Signal Processing and Integrated Networks (SPIN)
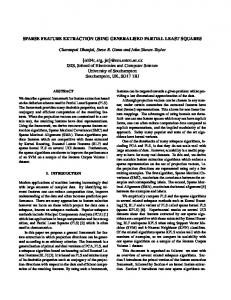
In this paper, thresholding along with gamma correction and masking is used for oil spill detection . This is done by calculating threshold values by sampling RGB content of SAR images, and thus determining and distinguishing oil from other geographical features on the satellite images, provides a clear picture and identified region of interest. The main approach to detect the dark spots, consists of local and global thresholding algorithms.[9], [10] For each dark spot, a number of features are calculated in order to classify the slick as either oil or other possible geographical or natural components of water. The proposed thresholding algorithm, initially analyzes the SAR images, and then assigns a probability to the dark spot to indicate whether it is an oil spill or look alike.
Figure 1: Algorithm for oil spill detection
the object of interest. During the thresholding process, individual pixels are marked as "object" pixels if their values are greater than some threshold values. i. The normal values of image pixels are between 0 and 250. ii. We use the value 255 to mark oil pixels. (using raster.setSample( x, y, a_color, 255) function ).
The rest of the paper is organized as follows: Section II deals with the methodology , section III displays the results whereas section IV summarizes the conclusion and future work.
II. METHODOLOGY Before an algorithm was designed to identify oil spill, it was necessary to know what makes oil spills different. It is known that ocean water appears blue, cloud is white; land covered by vegetation is green under natural light. When inspecting the images, it is found that colors are different for oil, water and the land.
Thresholds could be formulated as constants, linear or non-linear functions. Using the scatter plots Scatter plots are used in discovering threshold values or functions i. IF red color > 40 THEN pixel is oil ii. IF green < 3*(red – 20) THEN pixel is oil
The sample pixels were collected using a “pixel sampler”. For each mouse click, pixel values in red, green and blue are displayed on screen. The use of mouse listener allows user to click on image to “sample” on oil, water and land, etc.
The normal values of image pixels are between 0 and 250. We use the value 255 to mark oil pixels. Scatter plots created with sample pixels can help to discover the differences between oil and other geographical features. The scatter plots are used in determining functions for differentiating oil spills from water and other geographical features on the satellite images. Observations from multiples images can be used to generate accurate indexes to pin-point pixels which match specifications matching those of oil. The scatter plots then help determine functions for rationing and thresholding techniques.
Once enough sample pixels were collected for oil, land and water, their values were examined to discover the differences and determine a threshold value to integrate into an algorithm shown in Fig. 1. A) Isolation of Dark Spots Step I: Gamma Scaling and Gaussain Filtering:
Step III: Masking:
Gamma scaling is an important concept related to processing pixel intensities of an image. If gamma is less than 1, the mapping is weighted toward higher (brighter) output values. If gamma is greater than 1, the mapping is weighted toward lower (darker) output values. Gaussian filtering is very effective for removing Gaussian noise. The weights give higher significance to pixels near the edge (reduces edge blurring).They are linear low pass filters, computationally efficient (large filters are implemented using small 1D filters) and rotationally symmetric (perform the same in all directions).The degree of smoothing is controlled by ı (larger ı for more intensive smoothing).
A pixel’s value is computed from its old value and the values of pixels in its vicinity. A mask is a small matrix whose values are called weights. Each mask has an origin, which is usually one of its positions. The origins of symmetric masks are usually their center pixel position. For non-symmetric masks, any pixel location may be chosen as the origin (depending on the intended use). The application of a mask to an input image produces an output image of the same size as the input as shown in Fig 3. Implementing a mask: i) For each pixel in the input image, the mask is conceptually placed on top of the image with its origin lying on that pixel.
Step II: Local Thresholding Method Image thresholding is the simplest method in outlining 580
2015 2nd International Conference on Signal Processing and Integrated Networks (SPIN)
Table 1: Features Extracted and Range selected for Oil Spill Domain Classification
ii) The values of each input image pixel under the mask are multiplied by the values of the corresponding mask weights. iii) The results are summed together to yield a single output value that is placed in the output image at the location of the pixel being processed on the input
Features Extracted
Classification
Area
>=35
Max
52-185
Entropy
2.79-5.6
Mean
14.66-56.86
Standard Deviation
4.633-10.30
Smoothness
0.9477-0.9907
Step IV: Global Thresholding: Most global thresholding methods tries to find a threshold value using a criterion function by using the histogram of an image. But the proposed method is based on connectivity of the pixels rather than the intensity of image. Thresholds are found by otsu’s method to preserve connectivity within regions. Since connectivity is a local measure, and since it is measured throughout the entire image, this is a global thresholding method based on a local measure. The method has three general steps: i. Determination of the run length histogram at each thresholding value. ii. Determination of the sliding profile that is the conversion from the runs histogram to a smoothness and lack of flatness curve. iii. Determination of thresholds corresponding to the peaks of the sliding profile.
Range for
III.
EXPERIMENTAL RESULTS
The results show the experiment performed to detect the oil spill is conducted on the MODIS.2010115 image. The original image is shown in Fig. 2. Grayscale Image
The Otsu’s method suggests minimizing the weighted sum of within-class variances of the foreground and background pixels to establish an optimum threshold. The Otsu method gives satisfactory results when the numbers of pixels in each class are close to each other. The resultant image is shown in Fig. 4. B) Spot Feature calculation: The features which usually used for oil spill detection can be generally grouped in three major categories, features referring to the geometrical characteristics of oil spills (e.g. area, perimeter, complexity), features capturing the physical behaviour of oil spills (e.g. mean or max, standard deviation), and features referring to the oil spill context in the image (e.g. number of other dark formations in the image, etc). In this paper the features of interest are: a) Area, Centroid and Diameter b) Maximum Value c) Entropy d) Mean e) Standard Deviation f) Smoothness
Fig.2 : Original Grayscale Image To get better visual image, Contrast stretching is performed on the original gray scale image and improved image is shown in Fig. 3. Contrast Stretching
The oil spill pixels are classified on the basis of the first few features like area, mean and entropy. After the recognition of the oil spill pixels, their standard deviation and smoothness values were recorded. The range was formed by taking the mean of these values of the three images taken into consideration. Table I shows the list of features of interest and their respective calculated range. On the basis of this range only the classification is done.
Fig. 3 : Image after Contrast Stretching
581
2015 2nd International Conference on Signal Processing and Integrated Networks (SPIN)
The Otsu’s method is used for segmenting the image. In this method global thresholding is done. The Fig.7 is the segmented and labeled image. The Fig. 8 shows the Pseudo color segmented image. The colored blobs are labeled from top to bottom and then from left to right. There are 24 blobs present in the image
The scatter plots then help determine functions for rationing and thresholding techniques as shown in Fig. 4.
Labeled Image
Figure 4 . Scatter Plot with threshold values Gaussian filter is used to remove high frequency components of image and hence results into a smooth image shown in Fig. 5.
Fig. 7 : Segmented Image . Pseudo colored labeled image
Gaussian filtering
50 100 150 50
100
150
200
250
Fig. 8 : Pseudo Color Segmented Image The above mentioned features like area, entropy etc are calculated from set of these 24 blobs. The blobs are labeled as shown in Fig. 9 below. Table II shows the feature values for all 24 blobs.
Fig. 5 Gaussian filtered smooth Image Now on this smoothed image, Local thresholding is performed which gives a binary image as shown in Fig. 6 Binary image after threshold
Outlines
134 5 50
23
24
22 21 12 20 11 789 13 1618 19 14 17 6
100
150
2
1015 50
100
150
200
250
Fig. 9: Labeled Blobs
Fig. 6: Binary Image of MODIS.2010115
Table II : Feature Values for 24 Blobs used for Oil spill Detection Blob# 1 2 3 4 5 6 7
Mean Intensity 117.7 226.3 112.2 107.9 127.6 98.6 99.8
Area
Centroid
Diameter
32 516 43 7 203 5 5
5.2 6.2 15.6 20.4 46.6 57 70
3 174.5 8.1 1.7 5.7 155 131 582
Standard Deviation 26.5 70 28.3 24.5 28.5 26.9 24.5
Max
Smooth
Entropy
170 255 168 142 195 136 137
0.998582 0.999796 0.998756 0.998337 0.998774 0.998618 0.998334
4.750000 3.461344 5.100683 2.807355 6.283068 2.321928 2.321928
2015 2nd International Conference on Signal Processing and Integrated Networks (SPIN)
8 9 10 11 12 13 14 15 16 17 18 19 20 21 22 23 24
96.8 99.2 116.1 117.1 112.4 114 210 117.4 94.6 93.2 126.3 117.4 121.5 119.2 128.6 101 116.4
5 5 44 48 5 15 10451 5 8 19 46 5 20 44 14 8 5
73 76 97 103 116 120.5 206.6 123 124.5 137.8 148.3 144 167.8 179.2 190 213.5 252
128 125 187.9 117.9 113 137.9 149.8 185 134 149.5 137 149 117.1 94.4 92.6 52 69
33 25.2 33.3 34.8 25.4 30.1 35.4 22.3 31.5 43.3 33.6 18.4 31.4 18.3 13.5 29.8 32.8
136 137 183 175 139 154 255 140 136 155 188 138 197 142 148 135 160
0.999084 0.998432 0.999099 0.999176 0.998455 0.998897 0.999204 0.997989 0.998993 0.999468 0.999113 0.997044 0.998988 0.997025 0.994557 0.998877 0.999072
2.321928 1.921928 5.124093 5.334963 2.321928 3.773557 6.769728 2.321928 3.000000 4.247928 5.088779 2.321928 4.121928 4.635235 3.182006 3.000000 2.321928
REFERENCES
IV. CONCLUSION AND FUTURE WORK
[1] C. Brekke and A. H. S. Solberg "Oil spill detection by satellite remote sensing", Remote Sens. Environ., vol. 95, no. 1, pp.1 -13 2005
In this paper, SAR image is processed for real-time detection and tracking of oil spills. The developed methodology consists of image pre-processing, followed by pixel sampling and determination of threshold value for separation of look-alikes to oil spill extraction. The oil spill pixels are classified on the basis of the few features like Area, Centroid, Maximum Value Entropy, Mean, Standard Deviation and Smoothness.
[2] Bulgarelli B. “On MODIS Retrieval of Oil Spill Spectral Properties in the Marine Environment”, Geoscience and Remote Sensing Letters, IEEE, Vol-9, May 2012 [3] C. Hu , F. E. Karger , C. Taylor , D. Myhre , B. Murch , A. L. Odriozola and G. Godoy "MODIS detects oil spills in Lake Maracaibo, Venezuela", EOS Trans., AGU, vol. 84, no. 33, pp.313 -319 2003 [4] B. Bulgarelli and S. Djavidnia "On the use of MODIS data to detect oil spills: The Lebanon case", Proc. Oceans from Space Venice 2010, pp.55 -56 2010 [5] F. Carnesecchi , V. Byfield , P. Cipollini , G. Corsini and M. Diani "An optical model for the interpretation of remotely sensed multispectral images of oil spill", Proc. SPIE—Remote Sens. Ocean Sea Ice Large Water Regions, vol. 7105, pp.710 504 2008 [6] B. Fiscella , A. Giancaspro , F. Nirchio , P. Pavese and P. Trivero "Oil spill detection using marine SAR images", Int. J. Remote Sens., vol. 21, no. 18, pp.3561 -3566 2000 [7] H. A. Espedal and O. M. Johannessen "Detection of oil spills near offshore installations using synthetic aperture radar (SAR)", Int. J. Remote Sens., vol. 21, no. 11, pp.2141 -2144 2000 [8] R. Goodman "Overview and future trends in oil spill remote sensing", Spill Sci. Technol. Bull., vol. 1, no. 1, pp.11 -21 1994 [9] L. A. Kotova , H. A. Espedal and O. M. Johannessen "Oil spill detection using spaceborne SAR; a brief review", Proc. 27th Int. Symp. Remote Sens. Environ., pp.89 1998
Still there is scope for improvement as this semiautomatic detection system can be fully automated if conclusive patterns can be defined and fed into intelligent computer systems. Good scientific data is crucial to effectively respond to and manage oil spills. Effective management of these incidents relies on information about our marine environment. No matter how carefully an algorithm is designed for solving real-world problems, it may fail in some cases therefore it is important to keep improving the techniques with advancement in technology. Also with some changes the algorithms discussed in this paper can be used to detect harmful algal bloom from satellite imagery as well.
[10] A. Solberg , C. Brekke and P. Hus y "Oil spill detection in Radarsat and Envisat SAR images", IEEE Trans. Geosci. Remote Sens., Vol. 45, no. 3, pp.746 -755 2007
583