XIX IMEKO World Congress Fundamental and Applied Metrology September 6−11, 2009, Lisbon, Portugal
DETECTION OF SHORT TRANSIENTS AND INTERRUPTIONS USING THE HILBERT TRANSFORM M. Caciotta1, S. Giarnetti2, F. Leccese3, Z. Leonowicz4 1
Roma Tre University, Rome, Italy,
[email protected] Roma Tre University, Rome, Italy,
[email protected] 3 Roma Tre University, Rome, Italy,
[email protected] 4 Wroclaw University of Technology, Wroclaw, Poland,
[email protected] 2
Abstract − In electrical energy power networks, disturbances can cause problems in electronic devices so their monitoring is fundamental in Power Quality. In this paper we address the problem of disturbances estimation by using the Hilbert Transform (HT). It is employed as an effective technique for tracking the voltage waveforms in electrical distribution systems. The mathematical simplicity of the proposed technique, compared with the commonly used algorithms from the literature, renders them competitive candidate for the on-line tracking of disturbances. The accurate tracking of the HT facilitates its implementation for the control of disturbances mitigation devices. Simulation results are provided to verify the tracking capabilities of the algorithm and this has been tested under different conditions: voltage dip with phase jump, noise and frequency changes shows that the Hilbert Transform can be used as a valid methodology for this type of phenomena.
nominal voltage, at a point of electrical system, and lasting from half of the fundamental period to several seconds. The dips with durations of less than half a cycle are regarded as transients. The main characteristics of voltage dips are magnitude and duration, which correspond to the remaining bus voltage during the fault and the required time to clear the fault respectively. A voltage dip may be caused by switching operations associated with temporary disconnection of supply, the flow of heavy current associated with the start of large motor loads or the flow of fault currents or short circuits and earth faults. These lasts can be symmetrical (three phase) or non symmetrical (single-phase to ground, double-phase or double-phase-toground). The magnitude of a voltage dip at Point of Common Coupling (PCC) depends on the type of fault, the distance to the fault and the fault impedance [20]. Most of the voltage dips are the result of momentary distribution faults. The total dip event lasts generally less than 200 milliseconds with magnitude less than 50% of nominal voltage [20]. The effects can be extremely annoying to the customer and can include: extinction of discharge lamps, incorrect operation of devices; speed variations or stopping of motors; tripping of relays; computer system crashes or commutation failures in inverters. A possible solution against voltage sags can be the Dynamic Voltage Restorer (DVR) which the basic function is to inject a voltage in series with the voltage supply when a fault is detected at the PCC. The brief interruptions can be considered as voltage sags with 100% of amplitude. The cause may be a blown fuse or breaker opening and the effect can be an expensive shutdown. For instance, supply interruptions lasting up to few seconds may be costly in case of interruption of service or stoppage of machines in a production plant. These costs can quickly grow up with the plant resetting time that can be very long. The main protection of the customer against such events is the installation of uninterruptible power supplies [2]. Brief voltage increases (swells) are brief increases in r.m.s. voltage that sometimes accompany voltage sags. They appear on the un-faulted phases of a three phases circuit that has developed single-phase short circuit. Swells can upset electric controls and electric motor drives, particularly common adjustable-speed drives, which can trip because of
Keywords: power quality, Hilbert Transform, voltage dips, micro interruptions, transients. 1. INTRODUCTION Electric power quality has became an important part of power systems and electric machines analysis, studied from a wide number of points of view: technical and scientific summarized in [1,2,3], in the field of economy, of social sciences and also legal aspects of power quality [4,5,6,7,8,9,10,11,12] with the important perspective of the Perceived Power Quality [13,14,15]. The formulation of a strategy to know and solve power quality problems requires deep understanding of this complicated subject. For this purpose there are many electric parameters that help to describe the phenomena in question [16]. In this context, we consider disturbances as the temporary deviation of the steady state waveform caused by faults of brief duration or by sudden changes in the power system [2]. The disturbances considered by the International Electrotechnical Commission (IEC) include voltage dips, brief interruptions, voltage increases, and impulsive and oscillatory transients [17,18,19]. The firsts are defined by norms as a sudden reduction (between 10% and 90%) of the
ISBN 978-963-88410-0-1 © 2009 IMEKO
913
Thus ~ x (t ) is the convolution integral of x(t) and (1/πt), described as: ~ x (t) = x(t) ∗ (1/ πt) (2) Like Fourier transforms, Hilbert transforms are linear operators where
their built-in protective circuitry. Swells may also stress sensitive computer components and shorten their life. Possible solutions to limit this problem are, as in the case of sags, the use of uninterruptible power supplies and conditioners [21]. Voltage disturbances shorter than sags or swells are classified as transients and are caused by sudden changes in the power system [21]. According to their duration, transient overvoltages can be divided into switching surge (duration in the range of millisecond), and impulse spike (duration in the range of microseconds). Surges are high-energy pulses arising from power system switching disturbances, either directly or as a result of resonating circuits associated with switching devices. Protection against surges and impulses is normally achieved by surge-diverters and arc-gaps at high voltages and avalanche diodes at low voltages. In this article we focus the attention on disturbances which will gain more importance in the future because of the increase of electronic apparatus that can be particularly sensible to this kind of problems if not adequately protected. In fact there are two important aspects that should be taken into account: • •
H[a1x1(t) + a2x2(t)]= a1 H[x1(t)] + a2 H[x2(t)]
for any constant a1, a2 and any functions x1(t), x2(t). A useful point of view to understand and to compute the Hilbert Transform ~ x (t ) of x(t) is using the analytic signal z(t) associated with x(t), defined, as explained before, as z(t)= x(t)+ ~ x (t ) , that can be also defined as: (4) z(t) = A(t) ⋅ e jθ (t ) where A(t) is the envelope signal x(t) and θ(t) is the instantaneous phase of signal x(t). In terms of x(t) and ~ x (t ) , it is clear that: A(t) = [x2 (t) + ~ x (t)]1/ 2
⎡~ x (t) ⎤ ⎥ = 2πf0t ⎣ x(t) ⎦
θ (t) = tan−1 ⎢
The disturbance detection algorithm should be able to detect them as soon as possible, regardless of the nature of the voltage disturbance. At the same time, the disturbance estimation algorithm should have a good selective accuracy. In fact, fast detection algorithms may produce false trip operation of the mitigation equipment.
⎛ 1 ⎞ dθ (t) f0 = ⎜ ⎟ ⎝ 2π ⎠ dt
x(u)
(7)
Z(f) = F [z(t)] = F[x(t) + j ~ x (t ) ] = F [x(t)] + jF[ ~x (t ) ] =
~
X(f) + j X ( f )
(8)
The inverse Fourier transform of Z(f) yields: z(t) = F-1[Z(f)] = x(t) + j ~ x (t ) ~ where x (t ) = H[x(t)]= Im [z(t)] [22,23].
(9)
A Finite Impulse Response Filter (FIR) is designed to implement the HT. The HT-FIR filter can be realized in analogue or digital forms [25,26]. In this paper, the digital form of HT-FIR filter is adopted. A HT-FIR filter with odd symmetric coefficients is designed by the Parks-McClellan algorithm, which uses the Remez exchange algorithm and the Chebyshev approximation theory. The adopted method of design minimizes the maximum error between the desired frequency response and the actual frequency response. Filters that are designed in this way demonstrate an equiripple behaviour in their frequency response; hence, they are also known as equiripple filters.
The Hilbert Transform of a real-valued time domain signal x(t) is another real-valued time domain signal, denoted by ~ x (t ) , such that z(t) = x(t) + j ~ x (t ) is an analytic signal. From z(t), one can define a magnitude function A(t) and a phase function θ(t), where the first describes the envelope of the original function x(t) versus time, and θ(t) describes the instantaneous phase of x(t) versus time. The Hilbert transform of a real-valued function x(t) extending over the range -∞ < t < + ∞ is a real-valued function ~ x (t ) defined by:
∫ π (t − u) du
(6)
Let Z(f) be the Fourier transform of z(t), namely:
2. THEORY AND IMPLEMENTATION OF THE HILBERT TRANSFORM
∞
(5)
and the “instantaneous frequency” is given by:
In all cases, in power quality is necessary to detect not only the beginning and end of voltage sag but also to determine the sag depth and the associated phase angle jump. This paper is organized as follows: In Section 2, a description of Hilbert Transform methodology is proposed as an effective way for disturbance detection. The algorithm performance is tested under different real-like conditions in Section 3 where the influence of point on wave, phase jump, noise and fundamental grid frequency variation is discussed. Finally, main conclusions are detailed in Section 4.
~ x (t) = H[ x(t )] =
(3)
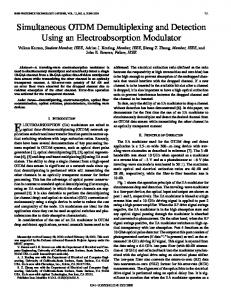
3. EXPERIMENTS AND RESULTS For experimental testing the performance of the HT algorithms, we used a synthesized signal realized in MATLAB able to generating short voltage disturbances of different magnitudes, duration and phase. The test signal is composed of a pure sinusoidal waveform with randomly distributed 100 short impulse
(1)
−∞
914
disturbances, as in Fig. 1. The corresponding HT of this signal is shown in Fig. 2.
2.1. Tests with noise and harmonic distortion
2.1. Preliminary tests
Fig. 1. Test signal composed of 100 periods added voltage transients randomly (shown partially).
Fig. 3. Test signal with noise SNR of 80 dB (upper plot) and small 3rd harmonic distortion of 3% of the sinusoidal waveform with one microdisturbance. The Hilbert Transform of the test signal with noise and harmonic distortion (lower plot).
Fig. 2. Test signal (upper plot) of the sinusoidal waveform with one microdisturbance. The Hilbert Transform of the test signal (lower plot).
Typical voltage or current signal in a power system contains multiple harmonic distortions. Mainly odd harmonic components are usually present. To test the influence of harmonics on the HT accuracy we analyze the signal as in Fig. 3, where increasing level of harmonic pollution is applied. The results are shown in Table 1. The HT algorithm is quite sensitive to higher harmonics, so adequate measurements must be taken to obtain correct results. In order to test the accuracy of proposed technique, we added the white Gaussian noise of various signal-to-noise ratio (SNR). To test the influence of noise on the HT accuracy we analyze the signal as in Fig. 4 and 5, where increasing level of noise is linearly added. Subsequently, we check how many of disturbances are correctly detected in many simulation runs. The results are shown in Table 2. HT algorithm fails to correctly detect disturbances at the SNR lower than 60 dB.
Fig. 4. Test signal with noise SNR of 60 dB (upper plot) and its Hilbert Transform (lower plot).
Fig. 5. Test signal with noise SNR of 40 dB (upper plot) and its Hilbert transform (lower plot).
915
Table 1. Accuracy of transients detection for various harmonic distortion of the waveform. 3rd Harmonics (%)
transient 35V
transients 100V
1%
100 %
100 %
5%
100 %
100 %
10 %
90 %
100 %
20 %
54 %
98 %
30 %
34 %
87 %
[8] J. Lamoree, J.C. Smith, P. Vinett, T. Duffy, M. Klein: “The Impact of Voltage Sags on Industrial Plant Loads,” First International Conference on Power Quality, PQA ’91, Paris, France. [9] G.L. Goedde, L.A. Kojovic, J.J. Woodworth: “Surge Arrester Characteristics That Provide Reliable Overvoltage Protection in Distribution and Low-Voltage Systems,” Conference Record, 2000 IEEE Power Engineering Society Summer Meeting, Vol. 4, 2000, pp. 2375–2380. [10] R.C. Dugan, L.E. Conrad: “Impact of Induction Furnace Interharmonics on Distribution Systems,” Proceedings of the 1999 IEEE Transmission and Distribution Conference, April 1999, pp. 791–796. [11] R.C. Dugan, T.E. McDermott: “Operating Conflicts for Distributed Generation on Distribution Systems,” IEEE IAS 2001 Rural Electric Power Conference Record, IEEE Catalog No. 01CH37214, Little Rock, Ark., May 2001, Paper No. 01-A3. [12] H.L. Willis, W.G. Scott: “Distributed Power Generation Planning and Evaluation,” Marcel Dekker, New York, 2000. [13] M. Caciotta, F. Leccese, T. Trifirò: “From Power Quality To Perceived Power Quality”, The IASTED International Conference on Energy and Power Systems EPS 2006, 29-31 March 2006, Chiang Mai, Thailand, Proceedings 526-119, pp. 94-102, ISBN CD: 0-88986-586-8. [14] F. Leccese: “The Perceived Power Quality Way as New Frontiers of Relationship between Customers and Producers”, 7th EEEIC International Workshop on Environment and Electrical Engineering (IEEE sponsored), May 5-11, 2008, Wroclaw-Cottbus, Poland, Proceedings pag. 55-58, ISBN: 978-3-940471-07-9. [15] F. Leccese: “A first analysis of Perceived Power Quality for domestic customers” will be presented to 12th IMEKO TC1 & TC7 Joint Symposium on Man Science & Measurement September, 3 – 5, 2008, Annecy, France, ISBN: 2-95164538-4. [16] IEC 61000-x-y (with x:1-6 and y:1-7) Electromagnetic Compatibility Guide,1984-1995. [17] IEC 61000-2-1: 1990, Electromagnetic Compatibility (EMC), Part 2: Environment, Section 1: Description of the Environment – for Low-Frequency Conducted Disturbances and Signalling in Public Power Supply Systems. [18] IEC 61000-2-2: 1990, Electromagnetic Compatibility (EMC), Part 2: Environment, Section 2: Compatibility Levels for Low-Frequency Conducted Disturbances and Signalling in Public Power Supply Systems. [19] IEEE c62.41: 1991, IEEE Recommended Practice on Surge Voltages in Low-Voltage AC Power Circuits. [20] M.H.J. Bollen, “Understanding Power Quality Problems: Voltage Sags and Interruptions”. New York: IEEE Press, 1999, vol. I. [21] UIE-DWG-2-92-D, UIE Guide to Measurements of Voltage Dips and Short Interruptions Occurring in Industrial Installations. [22] R. Bracewell: “The Fourier Transform and Its Applications,” McGraw-Hill, New York, 1965. [23] J.S. Bendat, A.G. Piersol: “Randaom Data – Analysis and Measurement Procedures, Second Edition,” John Wiley & Sons 1986 ISBN 0-471-04000-2. [24] T.W. Parks, C.S. Burrus: “Digital Filter Design,” New York:Wiley,1987. [25] MATLAB Help User’s Guide. [26] A.V. Oppenheim, R.W. Schafer: “Discrete-Time Signal Processing,” Prentice-Hall, 1989, pp. 256-266.
Table 2. Accuracy of the transients’ detection for various noise levels. Noise level SNR (dB)
transient 35V
transient 100V
100
100 %
100 %
90
100 %
100 %
80
100 %
100 %
70
100 %
100 %
60
100 %
40
83 %
100 % 98 %
20
26 %
61 %
4. CONCLUSIONS The necessity for the modern electronic apparatuses to limit the effects of disturbances is fundamental for their correct work so, the investigation of these parameters is extremely pressing. This paper has investigated short transients’ detection algorithm based on Hilbert transform. The performance of the HT-based estimation method is tested for noise and harmonic pollution sensitivity. REFERENCES [1]
[1] R.C. Dugan, M. F. McGranaghan, S. Santoso, H. W. Beaty, Electrical Power Systems Quality, Second Edition, McGraw-Hill, 2004,vol. I,ISBN: 0-0713-8622-X. [2] J. Arrillaga, N.R. Watson, S. Chen, Power System Quality Assessment, John Wiley & Sons, 2000, ISBN 0 471 98865 0. [3] E.F. Fuchs, M.A.S. Masoum, Power Quality in Power Systems and Electrical Machines, ISBN 978-0-12-369536-9. [4] F. Leccese: “Analysis of Power Quality Data on some Telecommunication Sites in Rome”, The Eight IASTED International Conference on Power and Energy Systems ~EuroPES 2008~, June 23-25, 2008, Corfù, Greece, Proceedings 608-086, pp. 62-67, ISBN CD: 978-0-88986729-1. [5] Glossary of terms and definitions concerning electric power transmission system access and wheeling, IEEE Power Engineering Society, 96, TP 110-0. [6] J.P.G. de Abreu, A.E. Emanuel: “The need to limit subharmonic injection”, 9th International Conference on Harmonics and Quality of Power, Vol. I, October 1-4, 2000, pp. 251-253. [7] J.F. Fuller, E.F. Fuchs, D.J. Roesler: “Influence of harmonics on power system distribution protection”, IEEE Transactions on Power Delivery, April 1988, Vol. TPWRD-3, No. 2,pp. 546-554.
916