ORIGINAL PAPER
DETECTION OF SPATIAL OUTLIERS IN RURAL COMMUNES OF PODLASIE PROVINCE (POLAND) ON THE BASIS OF SOCIO-ECONOMIC ATTRIBUTES DETEKCJA JEDNOSTEK NIETYPOWYCH W PRZESTRZENI WŚRÓD GMIN WIEJSKICH WOJEWÓDZTWA PODLASKIEGO NA PODSTAWIE ZMIENNYCH SOCJOEKONOMICZNYCH GOZDOWSKI Dariusz1*, ROSZKOWSKA-MĄDRA Barbara2 Department of Experimental Design and Bioinformatics, Warsaw University of Life Sciences, Nowoursynowska 159, 02-776 Warszawa, Poland 2 Division of Business Management, University of Białystok, 15-062 Białystok, Warszawska 63, Poland *corresponding author: Dariusz Gozdowski, Department of Experimental Design and Bioinformatics, Warsaw University of Life Sciences, Nowoursynowska 159, 02-776 Warszawa,
[email protected] phone: +48 (22) 59 32 730 1
ABSTRACT This work presents method of detecting spatial outliers between the rural communes of Podlasie Province (NorthEast Poland). The analyses were conducted using 8 variables which characterize socio-economic conditions of the communes in the year 2002. Statistical analyses were conducted using PCA for reduction of data set and LISA for detection of outliers. On the basis of the analyses 9 communes were classified as spatial outliers. Keywords: rural communes, spatial outliers, PCA, LISA, multivariate analysis STRESZCZENIE W niniejszej pracy przedstawiono metodę detekcji jednostek nietypowych w przestrzeni wśród gmin wiejskich województwa podlaskiego. Analizy zostały przeprowadzone przy wykorzystaniu 8 zmiennych charakteryzujących warunki socjo-ekonomiczne w gminach w roku 2002. Analizy statystyczne przeprowadzono przy wykorzystaniu analizy składowych głównych w celu redukcji zbioru danych oraz lokalnych wskaźników autokorelacji przestrzennej (LISA - local indicators of spatial autocorrelation). Na podstawie wykonanych analiz 9 gmin zostało zaklasyfikowano jako jednostki nietypowe w przestrzeni. Słowa kluczowe: gminy wiejskie, jednostki nietypowe w przestrzeni, PCA, LISA, analiza wielowymiarowa
Volume 11 (2010) No. 4 (409-414)
409
GOZDOWSKI Dariusz, ROSZKOWSKA-MĄDRA Barbara STRESZCZENIE SZCZEGÓŁOWE W niniejszej pracy przedstawiono metodę detekcji jednostek nietypowych w przestrzeni wśród gmin wiejskich województwa podlaskiego. Analizy zostały przeprowadzone przy wykorzystaniu 8 zmiennych charakteryzujących warunki socjo-ekonomiczne w gminach w roku 2002 tj.: wskaźnika waloryzacji rolniczej przestrzeni produkcyjnej, udziału osób z wyższym wykształceniem, dochodów gmin w przeliczeniu na 1 mieszkańca, liczby podmiotów gospodarczych w przeliczeniu na 1000 mieszkańców, średniej powierzchni gospodarstwa, obsady bydła na 100 ha, wartości produkcji rolniczej z 1 ha oraz udziału gospodarstw produkujących wyłącznie na samozaopatrzenie. Dane do analiz pochodziły z Powszechnego Spisu Rolnego z 2002 roku [5] Analizy statystyczne przeprowadzono przy wykorzystaniu analizy składowych głównych w celu redukcji zbioru danych. Na podstawie lokalnych wskaźników autokorelacji przestrzennej (LISA – local indicators of spatial autocorrelation) wyliczonych dla pierwszej składowej głównej (PC1) określono gminy nietypowe w przestrzeni (znacznie różniące się od gmin sąsiadujących). 9 gmin zostało zaklasyfikowanych jako jednostki nietypowe w przestrzeni, były to: Rudka, Sejny, Raczki, Puńsk, Janów, Zbójnia, Piątnica, Łomża oraz Brańsk. INTRODUCTION Identification of outliers is important in many different fields of science [6]. Spatial outliers are specific objects; these outliers are spatially referenced objects with values of non-spatial attributes significantly different from the values of their neighbours [9]. Detection of spatial outliers can be important in sociology, ecology, economy, agriculture etc. Methods for detecting spatial outliers very often base on geostatistical analyses. One group of such methods use local indicators of spatial association (LISA) such as local Moran’s I or Getis and Ord Gi [1, 11]. These methods use spatial autocorrelation as a measure of similarity to other objects. Negative local autocorrelation for particular object means that this object is not similar to neighbours. These methods afford us to detect spatial outliers on the base of one variable. It is not possible to find spatial outliers using these methods for multiple attributes. There are many different approaches used for detecting multivariate outliers [7]. One of these approaches is based on principal component analysis (PCA). The first principal components obtained in PCA explain most of the variance observed in data set
contained many variables. Application of LISA using the first principal component allows us to detect multivariate spatial outliers. In our survey we apply these two methods for detection of multivariate spatial outliers between rural communes1 of Podlasie District (North-East Poland). Multivariate analyses were conducted using 8 variables which characterize socio-economic and natural conditions of the communes. MATERIAL AND METHODS The following 8 variables were used for multivariate analyses: index of quality of agricultural space (X1), share of people with higher level of education (X2), incomes of commune per one inhabitant (X3), number of businesses per 1000 inhabitants (X4), average area of farm in ha (X5), cattle density per 100 ha (X6), value of agricultural production per 1 ha (X7) and percentage of farms which produce only for self-supply (X8). These variables were collected in the agricultural survey in 2002 [5]. These variables characterize socio-economic and natural conditions of rural communes in Podlasie District. Principal component analysis (PCA) was performed using Statistica 7.1 for all these variables after standardization to identify the multivariate diversity of the province [3]. The first principal component (PC1) were used for calculation of global [1] and local [2] Moran’s I coefficient [10] on the base of following equations:
[1]
[2]
where: N – number of observations, xi – value of variable
for i-th location, xj – value of variable for j-th location, – average value of variable, wij – weight between locations i and j. These weights for pairs of objects (communes) are reciprocals of Euclidean distances between centroids (geometrical centres) of these objects. For large number of observation range of values of Moran’s I is similar to Pearson coefficient of correlation. Values greater than 0
commune– the smallest administrative unit in Poland. It has a similar meaning as township in the U.S.
1
410
Journal of Central European Agriculture Vol 11 (2010) No 4
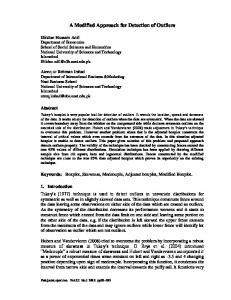
DETECTION OF SPATIAL OUTLIERS IN RURAL COMMUNES OF PODLASIE PROVINCE (POLAND) ON THE BASIS OF SOCIO-ECONOMIC ATTRIBUTES mean positive autocorrelation, while values less than 0 mean negative autocorrelation. Value equal to 0 or similar to 0 means random spatial distribution. When positive global autocorrelation exists it means that similar values of variable is observed for neighbouring objects. In such case on the base of local Moran’s I the communes which are significantly different than their neighbours we can detect (usually standardized Z value of I is used for this purpose). The calculations of spatial autocorrelation coefficients in this survey were conducted using ArcGIS 9.3 [10]. RESULTS Values and variability of examined variables was very different (Tab. 1), because of this principal component analysis was conducted on standardized values of the variables. The principal component analysis was conducted for multivariate evaluation of autocorrelation and values
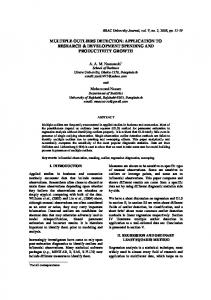
of local Moran’s I were calculated on the basis of the values of first principal component (PC1). Such a way of evaluation of spatial autocorrelation seems to be right approach because share of the first principal component in total variability is equal to c.a. 50%. The results of PCA analysis are presented in Table 2. Strong positive correlation exists between average area of farm in ha (X5), cattle density per 100 ha (X6) it means that communes which have high value of PC1 have higher values of these variables (these communes are marked white colour on the figure 1A). Strong negative correlation was observed between number of businesses per 1000 inhabitants (X4) and percentage of farms which produce only for selfsupply (X8). Communes which have low value of PC1 have higher value of these variables (these communes are marked dark grey or black colour in the figure 1A). As we can see in figure 1A which presents the values of PC1 positive spatial autocorrelation exists, because most communes which have similar value of PC1 are located in the same part of the province (communes located in the
Table 1. Mean values, standard deviation, coefficients of variability and range of examined variables Tabela 1. Warto�ci �rednie, odchylenia standardowe, wspó�czynniki zmienno�ci oraz zakres warto�ci badanych cech Mean SD CV Min Max X1 54.5 8.1 15% 36.2 76.1 X2 2.8 1.2 44% 0.9 8.4 438.4 233.4 53% 167.1 1620 X3 44.2 17.3 39% 14.4 112.5 X4 10.6 3.6 34% 2.1 17.8 X5 60.1 27.1 45% 4.4 130.7 X6 X7 1730.2 766.8 44% 464 5251 5.6 5.6 102% 0 39 X8 Table 2. Correlation coefficients between the first and the second principal components (PC1 and PC2) and total variability explained. Tabela 2. Wspó�czynniki korelacji mi�dzy pierwsz� i drug� sk�adowa g�ówn� (PC1 i PC2) oraz udzia� wyja�nianej zmienno�ci PC1 PC2 (48.7%) (18,5%) 0.44 0.64 X1 -0.70 0.40 X2 -0.58 0.34 X3 -0.77 0.38 X4 0.81 -0.22 X5 0.83 0.34 X6 0.52 0.70 X7 -0.81 -0.02 X8
J. Cent. Eur. Agric. (2010) 11:4, 409-414
411
GOZDOWSKI Dariusz, ROSZKOWSKA-MĄDRA Barbara
A
B
Figure 1. Values of the first principal component (A) and values of Z-score for local Moran’s I. Rys. 1. Wartości pierwszej składowej głównej (PC1) (A) oraz wartości statystyki Z dla lokalnego I Morana western part of the province have higher values of PC1 while communes located in eastern part of the province have lower values of PC1). Coefficient of global autocorrelation Moran’s I was equal to 0.55 (Z-score for this value is equal 7.2) it means that exists strong spatial autocorrelation between values of PC1 for communes of the province. In this case values of local Moran’s I autocorrelation coefficients can be useful in detection of spatial outliers. If the values of local Moran’s I are below 0 it means negative autocorrelation and we can suppose that these objects are spatial outliers. In this survey only for 9 communes negative local spatial autocorrelation was observed. In the figure 1B the values of Z-score for local Moran’s autocorrelation coefficient are presented. The lowest values of local Moran’s I was observed for Rudka and Sejny communes. Rudka had much higher value of PC1 than their neighbouring communes while Sejny had lower value of PC1 than neighbouring
412
communes. We can say that these communes are local outliers and are not similar to neighbours according many socio-economic and natural attributes. Other local outliers which have negative values of local Moran’s I (and negative values of Z-score) are following communes: Raczki, Puńsk, Janów, Zbójnia, Piątnica, Łomża and Brańsk. Most of these communes have lower values of PC1 (and consequently lower values of the traits correlated positively with PC1) than neighbouring communes. For some of the communes e.g. Łomża and Piątnica it can be explained by influence of nearness of big city (employment in industry and lower income from agricultural activity). The reasons of dissimilarity of these communes should be analysed in more detailed way. Why these communes are not similar (negatively or positively) and what are the reasons? Very often it is difficult to explain because it demands to take into consideration many different attributes (variables).
Journal of Central European Agriculture Vol 11 (2010) No 4
DETECTION OF SPATIAL OUTLIERS IN RURAL COMMUNES OF PODLASIE PROVINCE (POLAND) ON THE BASIS OF SOCIO-ECONOMIC ATTRIBUTES DISCUSSION AND CONCLUSIONS Spatial outliers detection is very important branch in spatial data mining. Increasing volume of spatial data gives us new information about phenomena in geographical space. Most of the existing spatial outlier detection methods focus on identifying single attribute outliers [2]. Many datasets which are collected for different regions or other spatial objects contains many non-spatial attributes (variables) and it is important to take into consideration all these attributes to detect spatial outliers. One of the methods which afford us to detect multivariate spatial outliers is reduction of the dataset to one variable e.g. using PCA (when the first principal component explain most of variability of the all dataset) and then conduct spatial analysis using LISA (Local Indicator of Spatial Autocorrelation) [1, 4]. This method is quite simple and we obtain results which are presented in clear way. One of the most important disadvantages is loose of information caused by reduction of data set to one variable. When PC1 explain only small percentage of total variability this method should not be used for outliers detection. Another condition which is necessary for effective outlier detection is the presence of global association [8]. Presence of global association can be evaluated using global spatial autocorrelation coefficient. In case of our research these two conditions were fulfilled, because share of PC1 in total variability was equal to about 50% and quite strong global spatial autocorrelation existed (global Moran’s I for PC1 was equal to 0.55). These two conditions very often do not exist, e.g. when data set contains very big number of variables. The method presented in this survey can be used for data set which counts no more than several attributes (non-spatial variables). For more complex data sets other methods are preferred e.g. distance-based methods [12]. The outlier detection usually is not the end of data analysis because very often we need to know why these detected outliers are not similar to neighbouring objects. In our research this second step was omitted because it demand more information about local circumstances and can not be limited only to attributes which were examined in the analyses.
J. Cent. Eur. Agric. (2010) 11:4, 409-414
REFERENCES [1] Anselin L., Local indicators of spatial associationLISA. Geographical Analysis (1995) 27: 93– 115 [2] Chen D., Lu C., Kou Y., Chen F., On detecting spatial outliers. Geoinformatica (2008) 12: 455–475 [3] Filipiak K., Wilkos S., Selected methods of multivariate analysis and their application in spatial research. IUNG Puławy, R (349) (in Polish), 1998. [4] Goovaertsa P., Jacqueza G., Marcus A., Geostatistical and local cluster analysis of high resolution hyperspectral imagery for detection of anomalies. Remote Sensing of Environment (2005) 95: 351–367 [5] GUS. National Agricultural Census 2002. GUS Central Statistical Office, 2003. (in Polish) [6] Hawkins D., Identification of outliers. Monographs on statistics and applied probability. Chapman & Hall, London , 1980. [7] Lalor G., Zhang C., Multivariate outlier detection and remediation in geochemical databases. The Science of The Total Environment, (2001) 281: 99-109. [8] Leung Y., Statistical test for local patterns of spatial association. Environment and Planning, (2003) 35: 725 -744. [9] Lu, C.-T. Chen, D. Kou, Y., Detecting spatial outliers with multiple attributes. Proceedings of 15th IEEE International Conference on Tools with Artificial Intelligence, (2003) 122-128. [10] Mitchell A.. The ESRI guide to GIS analysis. Vol.2 Spatial measurements and statistics. ESRI Press, Redlands, California, 2005. [11] Ord, K., Getis A.. Testing for local spatial autocorrelation in the presence of global autocorrelation. Journal of Regional Science, (2001) 41, 411-432 [12] Zhang Y., Meratnia N., Havinga P.. A taxonomy framework for unsupervised outlier detection techniques for multi-type data sets Technical Report TR-CTIT-0779, Enschede, November 2007.
413