Apr 8, 2018 - the saturated hydraulic conductivity for the fast-flow region was estimated starting from the Soil Block method data (plot-scale). Thus, the ...
DETERMINATION OF LATERAL PREFERENTIAL FLOW BY COMBINING PLOT- AND POINT-SCALE INFILTRATION EXPERIMENTS ON A HILLSLOPE European Geosciences Union General Assembly Wien | Austria | 8-13 April 2018
R. Marrosu1, S. Di Prima1, L. Lassabatere2, R. Angulo-Jaramillo2, M. Pirastru1 1
4
PROJECT
This study focuses on the identification of preferential flow at hillslope scale and the estimation of the saturated hydraulic conductivity for the fast-flow region, Ks,f, by infiltration experiments carried out at the different spatial scales of point- and plot-scale and at different soil depths. These information could help to establish the usability of each technique to determine the parameters describing the soil hydraulic properties of matrix and fast-flow regions. While Ks data obtained from the Beerkan method with BEST-algorithm and Modified Cube Method (point-scales) were used to characterized the matrix (Ks,m), the saturated hydraulic conductivity for the fast-flow region was estimated starting from the Soil Block method data (plot-scale). Thus, the combination of the Soil Block method with Beerkan infiltration runs and the analysis of experimental results with the dual permeability approach provided the identification and the quantification of dual permeability flow in the soil at the hillslope scale
2
7
CUBE METHOD
Horizontal and vertical saturated hydraulic conductivities of soil were determined by the Modified Cube Method (MCM; Beckwith et al., 2003), in order to get insights about the potential effect of anisotropic conditions on the comparison between Ks measurements In the laboratory, the horizontal Ks,h-MCM and vertical Ks,v-MCM conductivities, was measured on 20 randomly chosen cubes, 10 for each direction Constant-Head laboratory Permeameter (CHP) method (Klute and Dirksen, 1986)
11 cm wide by 11 cm long by 14 cm deep soil prisms
STUDY SITE
5
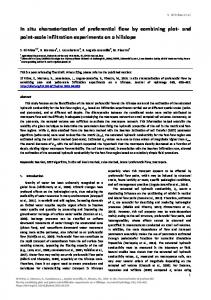
Figure 1. (a) Cumulative empirical frequency distributions of log-transformed saturated soil hydraulic conductivity, ln(Ks,BEST), determination by the BEST method at 0, 5, 10 and 20 cm depths; (b) ln(Ks-BEST) values vs. clay content (%). Pearson correlation coefficient, r, is also reported
IN-SITU SOIL BLOCK METHOD
Four soil blocks, with a volume varying from 0.100 to 0.163 m3, were obtained excavating around each soil block a 20 cm wide trench, then sealed by expandable polyurethane foam Study area is a steep slope side, located in the Baratz Lake basin, on Sardinia's north-west coast, Italy (40.69825 N, 8.2346 E; WGS84)
Table 1. Sample size, N, minimum, Min, maximum, Max, geometric mean, mG, standard deviation, SD, and coefficient of variation, CV (%), of the vertical, Ks,v-MCM (mm h-1), and horizontal, Ks,h-MCM (mm h-1), saturated soil hydraulic conductivities obtained by the constant-head laboratory permeameter method on soil cubes
mG(Ks,h-MCM) mG(Ks,v-MCM)
Hillside elevations ranges from 51 to 65 m a.s.l., with slope of ~30%
0.97
Soil is a Lithic Haploxerepts, about 0.3–0.4 m in depth Soil profile includes A, Bw and C horizons The C horizons consists of a altered Permian sandstone substratum that features very low permeability
3
Soil lateral transmissivity were investigated at three soil depths by imposing the water table depth (WTD) at 5 ,15 and 25 cm below soil surface
Statistic Ks,v-MCM Ks,h-MCM N Min Max mG SD CV
10 51.7 480.7 173.0 a 2.1 87.5
Figure 6. Impact of the fast-flow fraction, wf (-), on the saturated hydraulic conductivity for the fast-flow region, Ks,f (mm h-1), estimated at different water table depths (WTDs) for the four soil blocks (SBs). wf values ranging from 0.02 to 0.2
10 52.6 341.4 167.1 a 1.9 71.9
8
Darcy’s Law
C
A bs C 1 2 1 i s
1
1 ln
Cumulative infiltration (mm)
120
K S , 2 K w f K s , f 1 w f K s ,m
intercept (bs)
K s, f
40
0 0
1
DUAL-PERMEABILITY APPROACH
For dual permeability systems the global saturated hydraulic conductivity, KS,2K (L T–1), can be decoupled between the matrix and the fast-flow region contributions (Gerke and van Genuchten, 1993)
80
2
3 Time (h)
4
5
6
K S , 2 K 1 w f K s ,m wf
No anisotropy was detected, providing more confidence on the BEST method regarding the estimation of the matrix region also in the laterial direction and over the soil profile
Figure 2. Inflow (IF, open symbols) and outflow (OF, solid symbols) rates vs. time measured on the four soil blocks (SBs) at a water table depth (WTD) of 5 (blue rhombus), 15 (green circles) and 25 cm (red triangles)
On the basis of the determination from the BEST runs and the Soil Block method we can deduce the hydraulic conductivity of the fast-flow KS,f (L T–1)
slope (is)
Discrepancies between the considered measure scales were mainly attributed to macropore flow and the impossibility to adequately embody the macropore network on small sampled soil volumes. Conversely, at the plot-scale, the sampled volume was sufficient to activate the macropore network
Lateral saturated hydraulic conductivity estimation by means of Darcy equation
C is
K s BEST A r s i
q s K s SB T Z
6
BEST-steady algorithm (Bagarello et al., 2014)
Where wf is the void ratio occupied by the fast-flow region. Multiple scenarios were evaluated by setting the void ratio between 2 to 20%
CONCLUSIONS
For the studied hillslope the soil saturated hydraulic conductivity, evaluated both with the BEST method (Ks-BEST) and the Soil Blocks method (Ks-SB), clearly decreased with soil depth. It should be mainly due to decreased macropore network density over the soil profile
1
BEERKAN EXPERIMENT
A total of 40 ponding infiltration BEST runs (Lassabatere et al., 2006) were carried out at 0, 5, 10, 20 cm depths, 10 for each soil depth in randomly selected points of the slope The BEST-steady algorithm was chosen as it yields to a higher percentage of positive Ks values on the infiltration runs and allows simple calculation of Ks as compared to the other BEST algorithms
1
RESULTS
The study clearly proved the advantage of experimental protocols based on multi-scales experiments, yielding promising signs around the applicability of the Soil Block method (plot-scale) with the Beerkan infiltration runs (point-scale), for a plausible estimation of the saturated hydraulic conductivity for the matrix and the fast-flow region by a relatively simple field procedure
Table 2. Geometrical dimensions and estimated saturated hydraulic conductivity, Ks-SB (mm h–1), for the four Soil Blocks
Depth (cm) Length (cm) Width (cm) Volume (m3) SB 1 SB 2 SB 3 SB 4 mG
35.5 29.0 30.0 31.5
mean SD CV (%)
31.5 2.9 9.1
85 69 68 80 75.5 8.3 11.1
54.0 50.0 50.0 52.5 51.6 2.0 3.8
0.163 0.100 0.102 0.132 0.124 0.030 23.9
WTD5 1.4×10³ 2.2×10³ 1.1×10³ 7.2×10² 1.2×10³
Ks-SB WTD15 7.9×10² 1.2×10³ 3.1×10² 3.1×10² 5.5×10²
WTD25 5.1×10² 2.8×10³ 7.0×10¹ 1.5×10² 3.5×10²
1.6 48.6
2.0 76.3
5.0 345.8
Acknowledgements This work was supported by the progetto Legge 7 (LR72013UNICANIEDDA) “Impatti antropogenici e climatici sul ciclo idrogeologico a scala di bacino e di versante”
1
Agricultural Department, University of Sassari; Viale Italia 39, 07100 Sassari, Italy 2 Université de Lyon; UMR5023 Ecologie des Hydrosystèmes Naturels et Anthropisés; CNRS ; ENTPE ; Université Lyon 1; 3 rue Maurice Audin, 69518 Vaulx‐en‐Velin, France
\