Fragipan, Berks, Buchanan, Clarksburg, Animal Manure .... Chapter 2: Preferential Flow in Pastures on Benchmark soils in West Virginia Soils......27. Abstract.
Preferential Flow and Phosphorus Translocation In Benchmark Soils of West Virginia
Michael B. Harman A.A.S., B.S.Agr., Cert. P.A.
Thesis Submitted to The Davis College of Agriculture, Forestry, and Consumer Sciences at West Virginia University In partial fulfillment of the requirements for the degree of Master of Science in Plant and Soil Science James A. Thompson, Ph. D., Chair Louis McDonald, Jr., Ph. D. Eugenia M. Pena-Yewtukhiw, Ph. D Michael P. Strager, Ph. D Division of Plant and Soil Sciences Morgantown, West Virginia 2008
Keywords: Preferential Flow, Phosphorus Translocation, Soil Test Phosphorus, West Virginia Benchmark Soil Series, Fragipan, Berks, Buchanan, Clarksburg, Animal Manure
ABSTRACT Preferential Flow and Phosphorus Translocation in Benchmark Soils of West Virginia Michael B. Harman
Preferential flow is a mechanistic description of water movement in a soil profile where much of the soil matrix is bypassed during periods of rapid infiltration. The occurrence of preferential flow could lead to the movement of phosphorus (P) down through the soil profile. The objectives of this research were (i) to verify the presence of preferential flow in benchmark West Virginia soil series and (ii) measure soil test phosphorus (STP) levels within the preferential flow pathways and the surrounding soil matrix to determine the effects of preferential flow on phosphorus distribution within the soil profile. A non-reactive dye (Brilliant Blue FD&C) was applied in a ponding application to identify the preferential flow pathways in selected benchmark soil series in pasture management schemes with long-term historical applications of animal waste. The dye applications were excavated and digital images of the preferential flow pathways were taken. Soil samples from the stained (preferential flow paths) and unstained (surrounding soil matrix) portions of the soil profile were collected within each pedogenic horizon and analyzed for STP. All selected series, exhibited preferential flow. STP levels were statistically higher (p=64
Ap BA Bw C1 C2
Channery Silt Loam Very Channery Silty Clay Loam Extremely Channery Silty Clay Extremely Channery Silty Clay
20 50 70 85
GR SBK SBK MA
68.5 57.3 36.6 12.1
0.065 0.001 0.003
L2 P11 L2 P11 L2 P11 L2 P11
15 33 51 >51
Ap Bw C R
Channery Silt Loam Very Channery Silty Clay Loam Extremely Channery Silt Loam
20 45 88
PL - GR SBK SBK
42.5 7.6 10.5
0.000 0.284
L2 P12 L2 P12 L2 P12 L2 P12
10 28 38 >38
Ap Bw C R
Channery Silt Loam Very Channery Silty Clay Loam Extremely Channery Silt Loam
30 37 88
PL - GR SBK SBK
55.2 8.1 8.6 7.7
0.000 0.922 0.729
Structure GR-Granular, SBK-Subangular Blocky, Pl-Platy, PR-Prismatic, MA-Massive, COL-Columnar
66
Table 2. 2 Buchanan morphological data and horizon analysis Location / Plot Depth cm Horizon
Field texture
L1 P1 L1 P1 L1 P1 L1 P1 L1 P1 L1 P1
5 24 34 58 86 >86
A Ap Bt1 Bt2 Bx1 Bx2
Sandy Loam Sandy Loam Sandy Loam Sandy Clay Loam Sandy Loam Sandy Clay Loam
L1 P2 L1 P2 L1 P2 L1 P2 L1 P2
8 28 58 89 >89
A Ap BE Bx1 Bx2
Sandy Loam Sandy Loam Loamy Sand Sandy Loam Sandy Loam
L2 P13 L2 P13 L2 P13 L2 P13 L2 P13
8 24 51 76 >76
Ap1 Ap2 Bt Btx1 Btx2
Sandy Loam Sandy Loam Sandy Loam Sandy Clay Loam Sandy Loam
L2 P14 L2 P14 L2 P14 L2 P14 L2 P14 L2 P14
10 23 36 51 94 >94
Ap1 Ap2 Bt Btx1 Btx2 BCt
Sandy Loam Sandy Loam Sandy Loam Sandy Clay Loam Sandy Loam Sandy Loam
% Rock fragments
Structure
1 1
GR SBK SBK SBK PR - SBK PR - SBK
76.7 61.7 64.2 26.2 3.6 1.4
0.009 0.486 0.000 0.002 0.006
GR SBK SBK PR - SBK PR - SBK
69.4 63.6 13.8 2.2 0.8
0.363 0.000 0.004 0.050
PL PR - PL PR - SBK PR - SBK PR - SBK
82.5 64.8 29.7 16.9 7.2
0.008 0.000 0.002 0.058
PL - GR PR - SBK PR - SBK PR - SBK PR - SBK PR
79 58.9 37.4 15.7 13
0.008 0.000 0.003 0.490
1
% P Stained value
Structure GR-Granular, SBK-Subangular Blocky, Pl-Platy, PR-Prismatic, MA-Massive, COL-Columnar
67
Table 2. 3 Clarksburg morphological data and horizon analysis Location / Plot Depth cm Horizon
% Rock fragments
Field texture
L1 P6 L1 P6 L1 P6 L1 P6 L1 P6 L1 P6
5 13 25 43 69 >69
Ap1 Ap2 Bt1 Bt2 2Bt3 3Bt4
Silt Loam Silt Loam Clay Loam Clay Loam Channery Clay Clay
L1 P8 L1 P8 L1 P8 L1 P8 L1 P8
8 15 36 61 >61
Ap1 Ap2 Bt1 Bt2 Bt3
Silt Loam Silt Loam Clay Loam Clay Loam Clay
L2 P9 L2 P9 L2 P9 L2 P9
23 53 79 >79
A Bt1 Bt2 Bt3
L2 P10 L2 P10 L2 P10 L2 P10
23 53 94 >94
A Bt1 Bt2 Bt3
Structure
% Stained P value
GR PL - SBK MA - PL PR - SBK SBK - PL SBK
90.5 81.3 36.7 29 14.7 4.7
0.011 0.000 0.202 0.000 0.000
2 10 5 5 5
GR PL - SBK PR - SBK SBK SBK
93.1 79.6 32.7 5.7 2.6
0.000 0.000 0.000 0.035
Silt Loam Silty Clay Loam Clay Clay
2 5,3 5,2 2
GR SBK SBK SBK
67.2 21.9 10.5 5.5
0.000 0.000 0.065
Silt Loam Clay Loam Clay Clay
1 2 1,1 5
GR SBK SBK SBK - PL - SBK
74.9 47.9 14.1
0.000 0.000
27
Structure GR-Granular, SBK-Subangular Blocky, Pl-Platy, PR-Prismatic, MA-Massive, COL-Columnar
68
CHAPTER 3: PHOSPHORUS TRANSLOCATION IN PASTURES ON BENCHMARK SOILS IN WEST VIRGINIA
Abstract Safe, long-term application of phosphorus (P) from animal manure to satisfy crop nitrogen (N) demands is dependent on a soil’s ability to sorb any excess P. It is assumed the soil sorbs any excess P and as sorption capacity is filled, unsorbed phosphorus will move down parallel to the surface and be sorbed by the less saturated soil below. Preferential flow can bypass significant portions of the soil matrix invalidating this assumption. Consequently, the occurrence of preferential flow could lead to a deeper distribution of P in the soil profile. Three benchmark soil series common to pastures in West Virginia were selected for study. FD&C Blue # 1 dye was applied in a ponding fashion to identify active macropores. The applications sites were excavated and composite soil samples were collected from the stained and unstained matrix within each horizon. The soil samples were analyzed for phosphorus with Mehlich-1 extractions. Overall the P levels in the stained matrix samples were higher than the unstained samples at a statistically significant level. Generally the P levels declined with depth, in both the stained and unstained matrix samples. The implication of these findings on the long term management of P outlines a need for additional study to insure protection of the environment while maintaining agronomic productivity.
69
Introduction With preferential flow, percolating water bypasses portions of the porous matrix (Hendrickx and Flury, 2001). Pathways for preferential flow may include inter-aggregate pore spaces, earthworm burrows, gopher holes, shrink-swell cracks, decayed root channels, and other structures or conditions which generate a pathway more conducive to water movement (Nielsen et al., 1986). Many of these pathways maintain their integrity over time thus restricting saturation of the remaining soil matrix (Dekker et al., 2001). Preferential flow properties are variable within the profile and across the landscape (Strock, 2001). Furthermore, preferential flow occurs in many soil textures, structures (Wang et al., 1998), degrees of saturation (Hammermeister et al., 1982; Jardine et al., 1989; Wilson et al., 1997), depths, and textural interfaces in the soil profile (Heppell et al., 2000a, b). Elevated levels of P in the soil have been attributed to applications of animal manures as a fertilizer to satisfy N requirements. Historically, animal manures have been over-applied on some farms, particularly near confined animal feeding operations. Regionally high densities of food animal agriculture and N based manure applications could lead to elevated P saturation and an increased risk of water quality impairment (Beck et al., 2004). In eastern West Virginia, Grant, Hardy, and Pendleton Counties have robust food animal agriculture production and producers in these counties generate quantities of animal manures commensurate to their production levels. A better understanding of preferential flow and potential nutrient translocation within the
70
soils in this region could prove reduce P loss, and protecting the aquatic environment. In agricultural soils, preferential flow can be quite common (Petersen et al., 1997). Preferential flow has been shown to promote translocation of soil particles within the soil profile (Oygarden et al., 1997). No-till management practices lead to soils with more macropore pathways suitable for the preferential flow of water (Petersen et al., 1997). The increased macropore pathways in notill soils may be a result of the accumulation of water repellant organic matter, the establishment of stable surface connecting macropores, or both (Hallett et al., 2001). This combination likely increases the movement of water deeper into the soil profile. According to Akhtar et al. (2003), soil structure is a good indicator of the potential for preferential flow, and Kim et al. (2004) found correlations between the texture and the structure of soil horizons and the staining patterns used to identify preferential flow. Dye tracing experiments are commonly used to identify patterns of water movement within soil profiles (Morris and Mooney, 2004). Dye tracer experiments have been used to generate qualitative information about water movement in soil profiles (German-Heins and Flury, 2000; Weiler and Nae, 2003). The dye patterns from tracer experiments are often used to differentiate flow types as a part of an overall sampling strategy (Reichenberger et al., 2002). Most dye tracing experiments look at a scale of a few square meters. The potential impact of preferential flow on surface applied manure has far-reaching consequences. Many models of P interactions currently used in P
71
indexes indicate that P is not readily leached from most soils because it will be sorbed by the nearly inexhaustible sorption capacity of the subsurface soil horizons (Pepper et al., 1996). This model is dependent on a piston like movement of water and the consequent distribution of mobile P. Most models used to describe or simulate water movement through unsaturated soil, assume uniform, stable infiltration, which is uncommon in most field soils (Dekker et al., 2001). Preferential flow is one such exception to this assumption, and this may be of practical significance and should be examined. The National Agricultural Statistics Service reported in 2002 that for three counties in eastern West Virginia (Grant, Hardy, and Pendleton) there was 85% of the state’s broilers and other meat-type chicken sales, or approximately 77,419,965 chickens, and about 15% of the state’s cattle sales, or approximately 35,439 head (NASS, 2002). Much of the animal wastes in these three counties are applied as fertilizers on row crops and pastures (Basden et al., 1994). Row crop production has at least some capacity to remove soil P via the harvest, but pastures approximate a closed system where the only P export in an agronomic sense is in animal tissues moved from the farm. Of the total farm acres in Grant, Hardy, and Pendleton Counties, only 26% are cropland (NASS, 2002). Assuming that a majority of the animal manures is applied to hay and grass pastures, P retention could become very problematic. At the county level, if any counties in West Virginia are likely have a P retention problem it is most likely one of these counties.
72
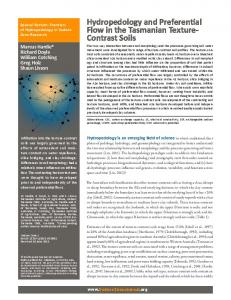
The objective of this research is to measure the soil test P levels in preferential flow pathways and the surrounding soil matrix, and determine if extractable P was greater near these flow paths, which may indicate P is moving within the preferential flow pathways. Hypothesis In pastures and grasslands of eastern West Virginia fertilized with animal manures, preferential flow has facilitated the translocation of P through the soil profile bypassing portions of the soil matrix, leading to the elevated P levels in the soil materials immediately surrounding the preferential pathways. Materials and Methods Experimental Design The experimental design was a three stage nested design (Fig. 3.1): location nested in series, investigative plots nested in location, and target applications nested in investigative plots (Dowdy et al., 2004). Field experiments were conducted at two locations per selected benchmark soil series. At each location, two investigative plots were identified for study. In each investigative plot, two target applications of dye were made. This produced 24 target applications, with eight for each series. The target applications were arranged so they were approximately five to six feet apart. Series and Location Selection Given the lack of published data on preferential flow in naturally drained pasture soils of West Virginia, the extent, taxonomic significance, and local importance of benchmark soils make them ideal for comparisons to other series.
73
As such, benchmark series were selected from the most common series under grass and hay management schemes in Grant, Hardy, and Pendleton Counties, the three West Virginia counties that produce 87% of the broiler sales and 15% of the cattle sales (NASS, 2002). The selection was made by combining published soils series map data and published land cover data to rank the abundance of series under the land uses of interest. The presence of important or unique soil morphological features (e.g., fragipans, shallow bedrock, high rock fragment content, and differences in mineralogy) was also considered so there would be diversity and contrast among the benchmark series selected. These series were selected based on availability of cooperative landowners. Specific locations for each series were chosen on farms which utilized primarily animal manure for fertilizers over the previous decade, and were currently used as hay or grass pasture fields. The specific plots within the locations were chosen based on topography (areas < 10% slope), with potential locations identified from published soil survey maps. These locations were excavated with an auger and compared to the official series description to determine if these locations was likely the series of interest. Three benchmark soils series that are of large extent in eastern West Virginia were selected for this study: Berks (Loamy-skeletal, mixed, active, mesic Dystrudepts), Buchanan (Fine-loamy, mixed, semiactive, mesic Aquic Fragiudults), and Clarksburg (Fine-loamy, mixed, superactive, mesic Oxyaquic Fragiudalfs) . Berks occurs to the greatest extent under grassland and hay pasture land uses in Grant, Hardy, and Pendleton counties and is characterized
74
by high rock fragments contents and moderately deep depths to bedrock. Buchanan and Clarksburg have fragipans but Clarksburg soils have relatively higher base saturations values associated with parent materials with more limestone influence. The Buchanan and Clarksburg series are less rocky than Berks, and are among the top 25 series in terms of extent under grassland and hay pasture land uses in Grant, Hardy, and Pendleton counties.
The
differences in soil morphological and chemical properties may influence water movement. Dye Application The positions of the investigative plots within a location were selected from locations with 51 0-15 15-33 33-51 0-10 10-28 28-38 0-10 10-28 28-38
Stained sample Unstained sample --------------- mg/Kg --------------1336.50 1480.50 943.50 349.50 252.30 65.80 1051.00 1430.00 688.00 464.55 266.40 253.60 6.34 295.55 1366.00 1468.50 1320.50 1274.00 928.50 1069.00 448.70 112.45 25.37 52.25 1106.00 1238.50 1126.00 422.70 959.00 99.65 160.50 23.63 96.55 21.63 36.10 3.66 13.48 3.68 8.40 7.43 90.95 40.99 13.24 13.14 10.40 7.76 96.55 62.85 11.87 17.29 14.34 4.88 94.25 47.40 26.01 3.96 9.18 5.17
112
Buchanan Buchanan STP Data Sample identification Horizon Plot app depth --- cm --Buchanan L1P1 1 0-5 Buchanan L1P1 1 5-24 Buchanan L1P1 1 24-34 Buchanan L1P1 1 34-58 Buchanan L1P1 1 58-86 Buchanan L1P1 1 >86 Buchanan L1P1 2 0-5 Buchanan L1P1 2 5-24 Buchanan L1P1 2 24-34 Buchanan L1P1 2 34-58 Buchanan L1P1 2 58-86 Buchanan L1P1 2 >86 Buchanan L1P2 1 0-8 Buchanan L1P2 1 8-28 Buchanan L1P2 1 28-58 Buchanan L1P2 1 58-89 Buchanan L1P2 1 >89 Buchanan L1P2 2 0-8 Buchanan L1P2 2 8-28 Buchanan L1P2 2 28-58 Buchanan L1P2 2 58-89 Buchanan L1P2 2 >89 Buchanan L2P13 1 0-8 Buchanan L2P13 1 8-24 Buchanan L2P13 1 24-51 Buchanan L2P13 1 51-76 Buchanan L2P13 1 >76 Buchanan L2P13 2 0-8 Buchanan L2P13 2 8-24 Buchanan L2P13 2 24-51 Buchanan L2P13 2 51-76 Buchanan L2P13 2 >76 Buchanan L2P14 1 0-10 Buchanan L2P14 1 10-23 Buchanan L2P14 1 23-36 Buchanan L2P14 1 36-51 Buchanan L2P14 1 51-94 Buchanan L2P14 1 >94 Buchanan L2P14 2 0-10
Mehlic-1 extractable P Stained sample Unstained sample --------------- mg/Kg --------------21.48 12.03 5.80 5.62 6.71 5.95 1.74 0.88 1.36 0.77 3.27 0.61 32.24 13.78 8.12 8.60 3.64 5.51 3.64 2.63 1.54 1.02 1.30 0.60 34.99 51.20 39.41 34.15 11.77 4.46 7.38 2.22 1.37 0.94 36.13 26.60 22.36 32.95 6.95 4.12 6.27 3.76 3.86 3.07 76.60 62.55 34.04 24.50 22.87 20.31 14.34 15.02 12.16 9.28 53.20 53.15 35.64 35.90 20.00 18.92 18.19 9.12 9.84 6.95 36.14 42.25 27.90 22.44 15.84 17.91 11.39 13.50 7.53 3.68 4.42 6.01 44.79 44.73
113
Buchanan STP Data Continued Buchanan L2P14 Buchanan L2P14 Buchanan L2P14 Buchanan L2P14 Buchanan L2P14
2 2 2 2 2
10-23 23-36 36-51 51-94 >94
30.43 24.21 20.53 5.52 4.30
114
24.35 22.05 17.32 4.52 3.22
Clarksburg Clarksburg STP Data Sample identification Horizon Plot app depth --- cm --Clarksburg L1P6 1 0-13 Clarksburg L1P6 1 13-25 Clarksburg L1P6 1 25-43 Clarksburg L1P6 1 43-69 Clarksburg L1P6 1 >69 Clarksburg L1P6 2 0-13 Clarksburg L1P6 2 13-25 Clarksburg L1P6 2 25-43 Clarksburg L1P6 2 43-69 Clarksburg L1P6 2 >69 Clarksburg L1P8 1 0-15 Clarksburg L1P8 1 15-36 Clarksburg L1P8 1 36-61 Clarksburg L1P8 1 >61 Clarksburg L1P8 2 0-15 Clarksburg L1P8 2 15-36 Clarksburg L1P8 2 36-61 Clarksburg L1P8 2 >61 Clarksburg L2P09 1 0-23 Clarksburg L2P09 1 23-53 Clarksburg L2P09 1 53-79 Clarksburg L2P09 1 >79 Clarksburg L2P09 2 0-23 Clarksburg L2P09 2 23-53 Clarksburg L2P09 2 53-79 Clarksburg L2P10 1 0-23 Clarksburg L2P10 1 23-53 Clarksburg L2P10 1 53-94 Clarksburg L2P10 2 0-23 Clarksburg L2P10 2 23-53 Clarksburg L2P10 2 53-94 Clarksburg L2P10 2 >94
115
Mehlic-1 extractable P Unstained Stained sample sample --------------- mg/Kg --------------325.45 340.10 42.57 13.03 14.75 5.26 5.30 0.72 3.29 0.51 259.50 237.00 51.40 5.49 31.70 4.89 19.98 0.94 11.69 0.81 287.35 259.40 27.49 5.45 2.63 3.03 1.91 0.68 323.65 289.00 26.89 19.45 5.72 1.56 1.21 0.63 33.01 28.22 2.33 1.23 0.70 0.36 0.57 0.48 7.97 13.89 0.40 0.40 0.39 0.52 86.35 97.75 0.62 0.25 0.43 0.25 35.19 23.90 3.89 1.67 0.25 0.54 0.38 0.52
Appendix 3 ANOVA Output P results The SAS System
10:02 Friday, October 5,
2007 290 The GLM Procedure Class Level Information Class
Levels
Values
series
3
Berks Buchanan Clarksburg
location
2
L1 L2
plot
2
1 2
application
2
1 2
trt
2
S U
Number of Observations Read Number of Observations Used
222 210
The SAS System
10:02 Friday, October 5,
2007 291 The GLM Procedure Dependent Variable: p
Source
DF
Sum of Squares
Mean Square
F Value
Pr > F
Model
10
15007643.64
1500764.36
48.64
F
2 3 2 1 1 1
5610900.304 6326622.664 24945.915 46322.368 30119.760 2968732.626
2805450.152 2108874.221 12472.958 46322.368 30119.760 2968732.626
90.92 68.34 0.40 1.50 0.98 96.21
|t| Pr >= |M| Pr >= |S|
0 -21 -1047.5
1.0000 0.0046 0.2357
Tests for Normality Test
--Statistic---
-----p Value------
Shapiro-Wilk Kolmogorov-Smirnov Cramer-von Mises Anderson-Darling
W D W-Sq A-Sq
Pr Pr Pr Pr
0.967503 0.108384 0.453473 2.460916
< > > >
W D W-Sq A-Sq