Paper 1089-2017
Developing a Predictive Model of Physician Attribution of Patient Satisfaction Surveys Ingrid C. Wurpts, Ken Ferrell, and Joseph Colorafi, Dignity Health
ABSTRACT For all healthcare systems, considerable attention and resources are directed at gauging and improving patient satisfaction. Dignity Health has made considerable efforts in improving most areas of patient satisfaction. However, improving metrics around physician interaction with patients has been challenging. Failure to improve these publicly reported scores can result in reimbursement penalties, damage to Dignity's brand and an increased risk of patient harm. One possible way to improve these scores is to better identify the physicians that present the best opportunity for positive change. Currently, the survey tool mandated by the Centers for Medicare and Medicaid Services (CMS), the Hospital Consumer Assessment of Healthcare Providers and Systems (HCAHPS), has three questions centered on patient experience with providers, specifically concerning listening, respect, and clarity of conversation. For purposes of relating patient satisfaction scores to physicians, Dignity Health has assigned scores based on the attending physician at discharge. By conducting a manual record review, it was determined that this method rarely corresponds to the manual review (PPV = 20.7%, 95% CI: 9.9% -38.4%). Using a variety of SAS® tools and predictive modeling programs, we developed a logistic regression model that had better agreement with chart abstractors (PPV = 75.9%, 95% CI: 57.9% - 87.8%). By attributing providers based on this predictive model, opportunities for improvement can be more accurately targeted, resulting in improved patient satisfaction and outcomes while protecting fiscal health.
INTRODUCTION This paper describes how the GLMSELECT procedure can be used to develop a parsimonious and generalizable regression model. We describe how to use PROC GLMSELECT and related code with a real example from healthcare analytics. The Hospital Consumer Assessment of Healthcare Providers and Systems (HCAHPS, pronounced Hcaps) is a CMS-mandated survey sent out to a random sample of patients after a hospital stay. Three of the 29 items on the HCAHPS ask the patients how well the doctors treated them with respect, listened to them, and explained things to them, scored on a 1-4 scale. One method to increase HCAHPS physician communication scores would be to look at how each physician scores on the surveys returned by their patients, and target the low-scoring physicians for some type of communication-improvement intervention. However, even during a brief inpatient visit, a patient may see many different physicians. The challenge becomes How do we know which physicians should be given credit for which surveys? The current method of physician attribution is to use attending physician at time of discharge. However, is there good rationale that the communication skills of the attending physician at time of discharge would influence how patients would answer the HCAHPS questions? We attempted to answer that question by first conducting a manual chart review of several patients and then determining if a statistical model could accurately predict the attributing physician better than the current method. We first performed a small pilot study with 29 medical service line encounters JanuaryMarch 2016. We sent those cases to a set of clinicians to review and rate which physician(s) they believed would have a significant impact on how patients would respond to the three physician communication questions. Within each encounter, physicians rated as “attributable physician” by abstractors were given a value of 1, and the other physicians a value of 0. Next, we used LASSO regression to determine which predictor variables from the clinical data could provide the best predictive mode. With promising results from the pilot study, we improved the model by sampling another 155 encounters across medical, surgical, and obstetrics service lines and training the model on this larger data set.
BUILDING THE MODEL 1
Not only were we interested in building an accurate predictive model, but we wanted to develop a model that could be implemented in the Dignity Health Enterprise Data Warehouse to determine attributable physician across all inpatient encounters. Our data set contained 1,545 physicians across 155 encounters, which is a relatively small sample size with which to use data mining techniques to develop a generalizable model. So, we used LASSO regression k-fold cross validation for predictor selection, as well as model averaging to ensure that our final model was not overfit to the training data. The model was trained on 1,021 physicians across 100 encounters and validated on 524 physicians across 55 encounters.
PREPARING THE TRAINING DATASET Potential predictors for the model were created from the electronic health record (EHR) data. Any information in the EHR that was indicative of a physician’s interaction with the patient was included. Our final analysis included 26 predictor variables taken from the EHR. The SURVEYSELECT procedure can be used to split the data into training and validation sets, roughly 2:1. In order to take into account the nested nature of the data, you can specify a sampling unit. We used the financial information number (FIN, which is unique across encounters) as the sampling unit. The sample size (SAMPSIZE = 100) then randomly selects 100 FINs. This information is contained in the SELECTED variable from the OUT= data set. Two data sets are then created based on the 100 selected encounters (training data) and 55 unselected encounters (validation data).
proc surveyselect data=hcahps out=train_validate method=srs sampsize=100 seed=987654 noprint outall; samplingunit FIN; run; data train; set train_validate; if selected = 1; run; data validate; set train_validate; if selected = 0; run; LASSO REGRESSION AND SCORING Although PROC GLMSELECT does not support logistic regression with LASSO variable selection, we found that treating our binary outcome as continuous still provided us with a well-performing model (see Friedman, Hastie, & Tibshirani, 2001). We originally intended to train the model to detect one primary physician per encounter, but our clinical abstractors often indicated that up to three physicians were equally responsible for patient communication for one encounter. We therefore trained the model to predict the primary physicians (up to three in one encounter) via a binary variable called “primary.” The PROC GLMSELECT code for building the regression model and also scoring the validation data is shown below:
proc glmselect data=train model primary = predA| predB| predC |predD |predE| predG |predH |predJ |predK |predL |predM |predN |predO |predP |predQ |predR |predS |predT |predU |predV |predW |predX |predY @2 /selection = lasso(choose=cv stop=cv ) stats = all cvMethod = INDEX(FIN) cvDetails = all
2
details = all stb; modelaverage tables=(EffectSelectPct(all) ParmEst(all)) refit(minpct=50 nsamples=1000) alpha=0.1; output out=train_out; score data=validate out=validate_out; run; quit; All two-way interactions among predictor variables are allowed via the @2 in the model statement. You can specifiy LASSO regression and predictor selection based on cross-validation via the selection = lasso(choose=cv stop=cv) statement, and cross-validation folds are determined via cvMethod = INDEX(FIN) so that there are 100 cross-validation folds based on 100 unique FINs in the data set. With our relatively small sample size, we wanted to ensure that the final model was parsimonious yet robust, so we use model averaging to perform the LASSO regression with cross-validation as described in the MODELAVERAGE statement on 100 bootstrap samples from the data. The final model is selected to include only those effects which appeared in at least 50 percent of the models, and that model is refit with 1000 bootstrap samples to provide the final coefficients. Predicted probabilities from the final model are saved to the TRAIN_OUT data set using the OUTPUT statement. The final model is used to score the validation data set and save the results to a new table using the SCORE statement.
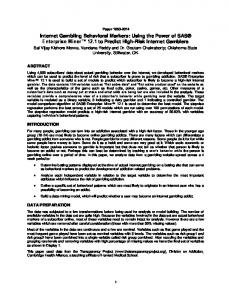
RESULTS You can request to see the Effect Selection Percentage in the MODELAVERAGE statement tables=(EffectSelectPct(all). We can see that there are four effects that occur in over 50% of the models. Effect predB predB*predE predB*predF predE*predG predB*predD predH predF*predH predI predF*predI predJ predB*predJ predG*predA predF*Res predZ predD*predZ predY predB*predY predF*predY predH*predY predD*predY predB*predX predF*predX predW predB*predW
Effect Selection Percentage Selection Percentage 3.00 1.00 3.00 2.00 2.00 1.00 1.00 3.00 1.00 13.00 4.00 3.00 2.00 2.00 1.00 11.00 42.00 1.00 1.00 1.00 3.00 1.00 6.00 2.00
3
predD predG predY*predD predD*predC predJ*predC predK*predC predY*predC predK predB*predK predC*predK predH*predK predX*predK predW*predK predV*predK predK*predD predC*predK predL predB*predL predD*predL predX*predL predC*predL predH*predM
1.00 2.00 80.00 1.00 1.00 2.00 100.0 93.00 6.00 1.00 1.00 1.00 4.00 21.00 4.00 1.00 15.00 2.00 3.00 79.00 1.00
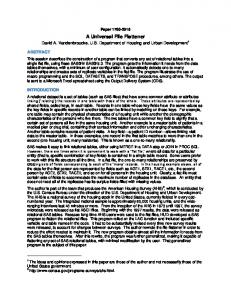
Output 1. Output from the MODELAVERAGE Statement The final model includes four effects that occur in the LASSO regression of at least 50 percent of the 100 bootstrap models. The model with these four effects is then refit to 1000 bootstrap resamples and the mean estimate across all 1000 samples is given via the refit(minpct=50 nsamples=1000) statement. Standard deviations, medians, and 5th and 95th percentiles are provided as well. You can see that the estimates do not vary widely across models, which indicates that the final mean estimates of the coefficients are stable. The GLMSELECT Procedure Refit Model Averaging Results Effects: Intercept predK predB*predK predD*predC predC*predL Average Parameter Estimates Parameter
Intercept predD*predC predK predB*predK predC*predL
Mean Estimate Standard Deviation
-0.012672 0.063256 0.305929 0.253052 0.074705
0.004919 0.013101 0.065426 0.090659 0.017375
5% -0.020378 0.041578 0.201972 0.108725 0.048202
Estimate Quantiles
Median -0.012848 0.063094 0.302251 0.250794 0.073859
95% -0.004496 0.084844 0.415444 0.396755 0.105193
Output 2. Output from the MODELAVERAGE Statement
ASSESSING MODEL PERFORMANCE As mentioned above, the goal of this analysis is to provide a single attributable physician for each inpatient encounter. In order to do so, we select the physician with the maximum predicted probability for each encounter, and compare this choice to the clinical abstractors’ top choice(s). We also compare the current method, attending physician at discharge, to the clinical abstractors’ top choice(s). You can select the maximum predicted physician within each encounter using the MEANS procedure. From PROC GLMSELECT, we specify that an output data set be created (output out=train_out) which will contain the predicted probabilities in the variable P_PRIMARY; 4
proc means data=train_out max noprint; class FIN; var p_primary; output out=train_out_w_max max=max; run; This code creates a new data set TRAIN_OUT_W_MAX that selects the maximum value for P_PRIMARY for each FIN. This gives us our attributable physician. The positive predictive value (PPV) indicates the performance of the model in detecting true positives, i.e., the probability that the physician selected by the model was selected by the clinical abstractors. Algorithm PPV = 89/100 = 89%, 95% CI[82%, 95%] Attending PPV = 65/100 = 65%, 95% CI[55%, 74%] This means that out of 100 encounters, the model corrected selected one of the top physicians 89% of the time, whereas the attending was one of the top physicians only 65% of the time. You can also estimate model performance on the scored validation data set which is created by score
data=validate out=validate_out. Based on the scored validation data: Algorithm PPV = 44/55 = 80% [67%, 90%] Attending PPV = 33/55 = 60% [46%, 73%] The PPV for the algorithm decreases somewhat in the validation data, but the relatively high PPV indicates that the model still has good predictive validity with new data.
CONCLUSION We have shown how PROC GLMSELECT can be used to select predictor variables for a LASSO regression model, using k-fold cross-validation that accounts for real groups in the data. We also showed how model averaging can be used to estimate the model on many bootstrap data sets and select predictors that appear in the majority of the models. This application of data mining techniques was used to develop a scoring algorithm that will be implemented in the Enterprise Data Warehouse at Dignity Health to provide better physician attribution.
REFERENCES Friedman, J., Hastie, T., & Tibshirani, R. (2001). The elements of statistical learning (Vol. 1). Springer, Berlin: Springer series in statistics.
ACKNOWLEDGMENTS Thanks to our clinical abstractors for helping us obtain our training data set.
CONTACT INFORMATION Your comments and questions are valued and encouraged. Contact the author at: Ingrid C. Wurpts, PhD Dignity Health 602-217-1708
[email protected]
5