Radiotherapy and Oncology xxx (2016) xxx–xxx
Contents lists available at ScienceDirect
Radiotherapy and Oncology journal homepage: www.thegreenjournal.com
Original article
Distributed learning: Developing a predictive model based on data from multiple hospitals without data leaving the hospital – A real life proof of concept Arthur Jochems a,⇑,1, Timo M. Deist a,b,1, Johan van Soest a,b, Michael Eble c, Paul Bulens d, Philippe Coucke e, Wim Dries f, Philippe Lambin a,b,1, Andre Dekker a,1 a
Department of Radiation Oncology (MAASTRO Clinic), Maastricht; b GROW – School for Oncology and Developmental Biology, Maastricht University Medical Centre, The Netherlands; Klinik für Strahlentherapie (University clinic Aachen), Germany; d Department of Radiation Oncology (Jessa Hospital), Hasselt, The Netherlands; e Departement de Physique Medicale (CHU de Liège), Belgium; and f Catharina-Hospital Eindhoven, The Netherlands
c
a r t i c l e
i n f o
Article history: Received 24 February 2016 Received in revised form 25 August 2016 Accepted 3 October 2016 Available online xxxx Keywords: Bayesian networks Distributed learning Privacy preserving data-mining Dyspnea Machine learning
a b s t r a c t Purpose: One of the major hurdles in enabling personalized medicine is obtaining sufficient patient data to feed into predictive models. Combining data originating from multiple hospitals is difficult because of ethical, legal, political, and administrative barriers associated with data sharing. In order to avoid these issues, a distributed learning approach can be used. Distributed learning is defined as learning from data without the data leaving the hospital. Patients and methods: Clinical data from 287 lung cancer patients, treated with curative intent with chemoradiation (CRT) or radiotherapy (RT) alone were collected from and stored in 5 different medical institutes (123 patients at MAASTRO (Netherlands, Dutch), 24 at Jessa (Belgium, Dutch), 34 at Liege (Belgium, Dutch and French), 48 at Aachen (Germany, German) and 58 at Eindhoven (Netherlands, Dutch)). A Bayesian network model is adapted for distributed learning (watch the animation: http://youtu.be/ nQpqMIuHyOk). The model predicts dyspnea, which is a common side effect after radiotherapy treatment of lung cancer. Results: We show that it is possible to use the distributed learning approach to train a Bayesian network model on patient data originating from multiple hospitals without these data leaving the individual hospital. The AUC of the model is 0.61 (95%CI, 0.51–0.70) on a 5-fold cross-validation and ranges from 0.59 to 0.71 on external validation sets. Conclusion: Distributed learning can allow the learning of predictive models on data originating from multiple hospitals while avoiding many of the data sharing barriers. Furthermore, the distributed learning approach can be used to extract and employ knowledge from routine patient data from multiple hospitals while being compliant to the various national and European privacy laws. Ó 2016 The Author(s). Published by Elsevier Ireland Ltd. Radiotherapy and Oncology xxx (2016) xxx–xxx This is an open access article under the CC BY-NC-ND license (http://creativecommons.org/licenses/by-ncnd/4.0/).
Learning from large volumes of patient data can greatly increase our capacity to generate and test hypotheses about healthcare [1– 3]. To capture and use the knowledge contained in large volumes of patient data, predictive models are essential [1,4,5]. Predictive models can be trained on large volumes of data, of patients who have been treated in the past, to make predictions about survival
⇑ Corresponding author at: Department of Radiation Oncology, Maastricht University (MAASTRO Clinic), Doctor Tanslaan 12, Maastricht 6229 ET, The Netherlands. E-mail address:
[email protected] (A. Jochems). 1 Authors have contributed equally to this publication.
and side-effects of treatment for a patient that has yet to be treated [6–8]. A number of challenges arise when one attempts to train models from routine care patient data. First, model performance is roughly proportional to the number of patients trained on. Patient data are readily available at different hospitals, but unfortunately, sharing these data between hospitals is hampered by ethical, administrative, legal, and political barriers [9]. If these data cannot be shared, models can only be trained on local data with the consequence that performance is limited and external validation (e.g. reproducibility and generalizability) is not possible. External model validation is a prerequisite when developing high quality
http://dx.doi.org/10.1016/j.radonc.2016.10.002 0167-8140/Ó 2016 The Author(s). Published by Elsevier Ireland Ltd. This is an open access article under the CC BY-NC-ND license (http://creativecommons.org/licenses/by-nc-nd/4.0/).
Please cite this article in press as: Jochems A et al. Distributed learning: Developing a predictive model based on data from multiple hospitals without data leaving the hospital – A real life proof of concept. Radiother Oncol (2016), http://dx.doi.org/10.1016/j.radonc.2016.10.002
2
Distributed learning: learning from multiple hospitals without data leaving the hospital
(e.g. TRIPOD Type 3 or 4) models [10]. In order to circumvent the hurdles associated with sharing data from multiple hospitals, a distributed learning approach may be used. In this approach, many of the barriers regarding data sharing are solved by sending the model training application to the hospitals. The model is trained at the hospitals and then the model is sent back to a central location, rather than centralizing the data. At the central location, the models trained individually at the hospitals are integrated into a single model. Therefore, patient data never leave the hospital and are obscured to the researcher while data are available to the learning application. A second problem that arises when using data originating from routine clinical practice is data quality, with missing data being the most common problem. Incomplete patient data require many models (logistic regression, support vector machines etc.) to either estimate the missing values or to leave out the patient altogether before model training and/or validation can take place. This impedes model performance [6]. This problem can be avoided by the use of Bayesian networks. The mathematical foundations of Bayesian network models allow effective handling of missing data. We have previously shown that in datasets that have a lot of missing values, a Bayesian network outperforms a support vector machine in terms of discriminative power [6]. Existing techniques to enable distributed learning exist for a number of machine learning algorithms. Some of these techniques focus on horizontal distribution of data, meaning that each center has the same variables but different subjects [11,12]. Other algorithms focus on vertically distributed data, meaning that the data centers each hold different parts of the data for the same subject [13,14]. For Bayesian networks, algorithms exist for learning both the network structure [15–18] and conditional probability tables (CPTs) [19,20]. However, these existing solutions are either tailored to vertically partitioned data or assume the data contains only binary variables. In this study we learn a Bayesian network model on horizontally partitioned data located at 5 different hospitals using distributed learning, without data leaving the hospital. Our proposed method enables the usage of discretized variables with an arbitrary number of levels. Furthermore, we propose a method by which discretization of continuous variables can take place in a distributed setting. The model predicts dyspnea, a common side effect after radiotherapy of lung cancer [21,22]. Dyspnea is a symptom of radiation-induced lung toxicity, which is developed in 10%20% of all lung cancer patients treated with radio(chemo)therapy [23]. Our hypothesis is that clinical and treatment parameters, originating from retrospective clinical data from multiple hospitals, can be used to predict patient outcome above the chance level. Furthermore, we expect that we can achieve a similar performance using a model learned from distributed data as we have previously obtained using a centralized approach [24]. Finally, we expect that the results of the distributed algorithm are a close approximation of the results of the centralized algorithm when learned on the same data. Patients and methods Data Clinical data from 287 lung cancer patients, treated with curative intent with chemoradiation (CRT) or radiotherapy (RT) alone were collected and stored in 5 different medical institutes (123 patients at MAASTRO (Netherlands, Dutch), 24 at Jessa (Belgium, Dutch), 34 at Liege (Belgium, Dutch and French), 48 at Aachen (Germany, German) and 58 at Eindhoven (Netherlands, Dutch)). Although these present only a fraction of the data available at these
institutions, this study aims to be a proof of principle for distributed learning for which these limited numbers are sufficient. None of the patients received stereotactic body radiotherapy. Patients were treated for their primary lung tumor and were not diagnosed with another tumor in the 5 years before treatment. Out of these 287 patients, 268 patients had post-treatment dyspnea recorded (PGrade 2 according to the CTCv3.0) and were included in the analysis (123 patients at Maastro, 14 at Jessa, 33 at Liege, 42 at Aachen and 56 at Eindhoven). The patient details can be found in Table 1. Distributed learning infrastructure Data were placed in a triplestore in subject-predicate-object manner (e.g. Patient # 1 – has post-therapy dyspnea – Grade 3) [25]. In each hospital, data were extracted from the local data sources and then mapped to codes and stored in the local triplestore using an ontology (NCI Thesaurus) [26]. This mapping to codes results in triples which are independent of language and can be accessed by applications using the same query in each hospital. Data stored in this way are said to be Linked Data [27] or Semantically Interoperable [28]. A number of open source software packages were used to implement the infrastructure at each hospital to enable learning. Data were queried and extracted from the electronical medical records using Pentaho (version 6.0.1.0) [29]. Patient identifiers were stored in a secured separate database and an associated ‘deidentified’ key was generated for use by the system. Deidentified patient data was stored in a PostgreSQL database (version 1.22.1) before conversion to triples using D2RQ took place [30]. Triples were stored in a Sesame server triplestore (version 2.7.7) [31]. Each hospital had its own triplestore with data installed and these triplestores can be queried using SPARQL [32], the query language of the semantic web. Querying of the portals was mediated by the Varian learning portal, a web portal developed by Varian medical systems (Palo Alto, CA). In the Varian learning portal, the researcher can upload his or her model application for learning. The Varian learning portal transmits the model application and validation results back and forth between the central location and the hospitals (Fig. 2). Bayesian network A Bayesian network model was developed to predict dyspnea. The model used tumor location (right lower lobe, right middle lobe, right hilus), lung function tests (forced expiratory volume in 1 s, in %, adjusted for age and gender; measured prior to medication), pretreatment dyspnea, cardiac comorbidity, (Non-hypertension cardiac disorder (at baseline), for which treatment at a cardiology department has been given) and timing of chemo (no chemo, sequential or concurrent) to make predictions. Variable selection was based on an earlier study [24]. The network structure of this model was pre-specified by experts and can be found in Fig. 1. The model’s performance was expressed as the Area Under the Curve (AUC) of the Receiver Operating Characteristic Curve (ROC). The maximum value of the AUC is 1.0; indicating a prediction model that perfectly discriminates patients with and without toxicity. A value of 0.5 indicates that patients are only correctly discriminated in 50% of the cases, e.g., as good as chance. A Bayesian network is a probabilistic graphical model that represents a set of variables and their dependencies in a directed acyclic graph (DAG). Within the DAG, variables are depicted as nodes and statistical dependencies are represented as directed edges. The joint probability of variables X1, . . ., Xn, can be decomposed into a product form of conditional probability distributions:
Please cite this article in press as: Jochems A et al. Distributed learning: Developing a predictive model based on data from multiple hospitals without data leaving the hospital – A real life proof of concept. Radiother Oncol (2016), http://dx.doi.org/10.1016/j.radonc.2016.10.002
3
A. Jochems et al. / Radiotherapy and Oncology xxx (2016) xxx–xxx Table 1 Overview of patient characteristics per hospital. Jessa
UK Aachen
Chulg
Eindhoven
Maastro
Number of patients
24
48
34
58
123
Neoplasm Lung Carcinoma Non-Small Cell Lung Carcinoma Small Cell Lung Carcinoma Missing
10 (42%) 9 (37%) 5 (21%) 0 (0%)
2 (4%) 30 (63%) 16 (33%) 0 (0%)
0 (0%) 27 (80%) 7 (20%) 0 (0%)
1 (2%) 40 (69%) 17 (29%) 0 (0%)
6 (5%) 91 (74%) 26 (21%) 0 (0%)
Dyspnea score (pre-treatment) CTCAE Grade < 2 CTCAE Grade P 2 Missing
6 (25%) 8 (33%) 10 (42%)
36 (76%) 6 (12%) 6 (12%)
20 (59%) 13 (38%) 1 (3%)
50 (86%) 6 (10%) 2 (3%)
119 (97%) 4 (3%) 0 (0%)
Dyspnea score (post-treatment) CTCAE Grade < 2 CTCAE Grade P 2 Missing
8 (33%) 6 (25%) 10 (42%)
36 (76%) 6 (12%) 6 (12%)
20 (59%) 13 (38%) 1 (3%)
50 (86%) 6 (10%) 2 (3%)
89 (72%) 34 (28%) 0 (0%)
Gender Female Male Missing
6 (25%) 18 (75%) 0 (0%)
14 (29.2%) 34 (70.8%) 0 (0%)
13 (38%) 21 (62%) 0 (0%)
25 (43%) 33 (57%) 0 (0%)
46 (37%) 77 (63%) 0 (0%)
Chemo timing None Sequential Concurrent Missing
6 (25%) 4 (18%) 13 (53%) 1 (4%)
2 (4%) 4 (8%) 28 (59%) 14 (29%)
0 (0%) 3 (8%) 31 (91%) 0 (0%)
6 (10%) 25 (43%) 27 (47%) 0 (0%)
16 (13%) 22 (18%) 84 (69%) 0 (0%)
FEV1Percentage Missing
82 (±22) 4 (16%)
68 (±20) 23 (48%)
72 (±22) 0 (0%)
81 (±25) 21 (37%)
78 (±22) 0 (0%)
ECOG performance status 1 2 3 4 5 Missing
7 (29%) 10 (42%) 1 (4%) 0 (0%) 0 (0%) 6 (25%)
0 (0%) 0 (0%) 0 (0%) 0 (0%) 0 (0%) 48 (100%)
9 (26%) 22 (65%) 2 (6%) 0 (0%) 0 (0%) 1 (3%)
23 (40%) 29 (50%) 6 (10%) 0 (0%) 0 (0%) 0 (0%)
34 (28%) 68 (55%) 16 (13%) 4 (3%) 1 (1%) 0 (0%)
FEV1 Percentage: forced expiratory volume in 1 s, in %, adjusted for age and gender; measured prior to medication. CTCAE: Common Terminology Criteria for Adverse Events. ECOG: Eastern Cooperative Oncology Group.
A
B
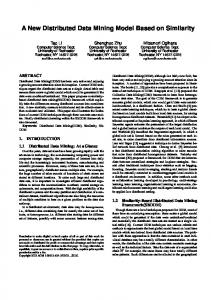
Fig. 1. Network structure of the Bayesian network model. The underlined node, Dyspnea, is the prediction variable. FEV1: forced expiratory volume in 1 s, in %, adjusted for age and gender. (A) Network structure determined by experts. (B) Network structure computed by structure learning algorithm.
PðXÞ ¼
n Y
PðX i jPaðX i ÞÞ
i¼1
in which Pa(Xi) indicates the parents of Xi in the network. We have determined the DAG dependencies based on expert knowledge. The conditional probability tables associated with each variable have been computed using the expectation maximization (EM) algorithm [33]. All continuous variables were discretized using a method described by Kuschner and colleagues [34].
To evaluate the effect of network structure on model performance, we have compared performance of three different network structures by validating on the Eindhoven dataset. In addition to the expert defined structure, we have used the same structure without chemo timing to investigate the effect of chemotherapy use on dyspnea. To explore the effects of using a data-driven approach to determine the network structure, we have used the path condition (PC) algorithm to determine the network structure [35] based on the largest dataset (Maastro).
Please cite this article in press as: Jochems A et al. Distributed learning: Developing a predictive model based on data from multiple hospitals without data leaving the hospital – A real life proof of concept. Radiother Oncol (2016), http://dx.doi.org/10.1016/j.radonc.2016.10.002
4
Distributed learning: learning from multiple hospitals without data leaving the hospital
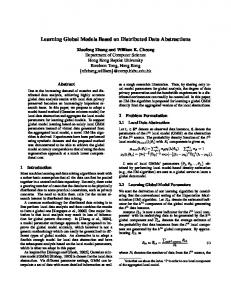
Fig. 2. Schematic overview of the distributed learning algorithm. In the first step, locally found bin boundaries are sent back to the central location. Here, a weighted average is computed on these boundaries, and these are sent back to the sites. In the second step, conditional probability tables are learned at each hospital. These probability tables are sent back to the central location, at which they are averaged in proportion to the number of patients at each hospital. The averaged conditional probability tables are sent back to the sites. In the last step, the model is validated on the data and the predicted probabilities of the model are sent back to the central location.
Distributed learning In order to realize distributed learning, existing techniques for learning Bayesian networks had to be adapted. A schematic overview of the procedure can be observed in Fig. 2. First, continuous variables were discretized in three bins according to the method described by Kuschner and colleagues [34]. Locally computed bin boundaries were transmitted to a central location. At the central location, the bin boundaries were averaged. Each site contributed to the average in proportion to the number of patients that were located on that site. The averaged bin boundaries were transmitted
back to the hospitals. In the second step, the CPTs were obtained by learning locally from each hospital. The CPTs were sent to the central location, where they were combined by weighted averaging. Individual table entries were weighted in proportion to the number of patients available at the hospital. The weighted CPTs, which comprise the global model, were sent back to each site to be validated. In the third step, the model was validated using the data available on the site. The predicted probabilities of the model and corresponding actual outcomes were transmitted back to the central location.
Please cite this article in press as: Jochems A et al. Distributed learning: Developing a predictive model based on data from multiple hospitals without data leaving the hospital – A real life proof of concept. Radiother Oncol (2016), http://dx.doi.org/10.1016/j.radonc.2016.10.002
5
0.8 Sensitivity 0.4 0.6 0.2 0.0 1.0
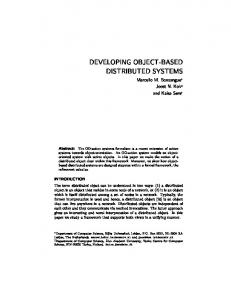
Results A Bayesian network structure was defined based on expert domain knowledge and can be found in Fig. 1A. The results of the 5-fold cross-validation can be found in Fig. 3. The AUC of the model was 0.61 (95% CI: 0.51–0.70). Subsequently, we learned the model on all data, except for the data of a single hospital. The model is subsequently validated on the last hospital, yielding an ROC curve for every center. The result of this experiment can be observed in Fig. 4. The AUC of the model validated on the Maastro dataset is 0.59 (95% CI: 0.49–0.69). The AUC of the model validated on the Jessa dataset is 0.66 (95% CI: 0.36–0.95). The AUC of the model validated on the Liege dataset is 0.69 (95% CI: 0.53–0.84). The AUC of the model validated on the Aachen dataset is 0.63 (95% CI: 0.36–0.90). The AUC of the model validated on the Eindhoven dataset is 0.71 (95% CI: 0.41– 1). The CPTs of the learned model can be seen in Table 2. We compared the performance of models learned in a distributed fashion to models learned locally on the same data for
0.6 0.4 Specificity
0.2
0.0
Sensitivity 0.4 0.6
0.8
1.0
Fig. 3. Receiver operator characteristic on a 5-fold cross-validation. The Bayesian network uses chemo timing (no chemo, sequential or concurrent), tumor location (right lower lobe, right hilus, right upper lobe), forced expiratory volume in 1 s, in %, adjusted for age and gender; measured prior to medication, pre-treatment dyspnea, baseline dyspnea score (CTCAE grade < 2) and cardiac comorbidity (Non-hypertension cardiac disorder (at baseline)) to classify acute dyspnea.
Maastro (AUC = 0.59) Jessa (AUC = 0.66) Eindhoven (AUC = 0.71) Liege (AUC = 0.69) Aachen (AUC = 0.63)
0.2
Statistical analysis Data preprocessing was done in Matlab (MathWorks, Natick, MA, USA) The Bayesian network model was programed in Java using the open-source jSmile framework of the Dynamic Systems Laboratory of Pittsburg University [36] and made freely available for academic purposes by BayesFusion, LLC (http://www.bayesfusion.com/). Analysis of ROC curves was done in R, version 3.1.3 (R foundation for statistical computing, Vienna, Austria) using the pROC [37] and cvAUC [38] packages. Comparison of ROC curves and computation of confidence intervals of AUC values was done using the method described by DeLong and colleagues [39].
0.8
0.0
We conducted a 5-fold cross-validation of the model. Crossvalidation was done by algorithmically selecting 80% of all patients at random at each hospital and using this 80% for learning the model (steps 1 and 2 in Fig. 2). The models learned at individual hospitals were combined at a central location. The combined model was subsequently sent back to each hospital to be validated on the remaining 20% of patients on each site. This was repeated 5 times. In order to assess the overall performance of the technique used, we did an additional experiment with the network structure as described in Fig. 1. In this experiment, we learned the network on all data, except for the data of a single center (steps 1 and 2 in Fig. 2). The model is subsequently validated on that last center, yielding an ROC curve (step 3 in Fig. 2). The learning and validation steps were repeated so the model could be validated on each center. To evaluate the feasibility of learning high quality models from larger volumes of data and higher numbers of hospitals using the method presented in this study, additional computational analyses were done. First, datasets of 1000, 10,000 and 100,000 patients were created by taking random samples from the data available at MAASTRO clinic. These data were partitioned in 10 to 100 subsets to simulate the different hospitals. The algorithm proposed in this study was used on these partitions and performance of the distributed algorithm model was compared to the model learned locally. Both models were validated on the data used to train the models. Model performance was evaluated using average difference in probabilities in the CPTs and difference in AUC between the distributed model and non-distributed model. To evaluate the performance of the algorithm under varying levels of missing data, the experiment was repeated with 0%, 20% and 40% randomly set missing data elements in the training data. In all participating hospitals, internal review board approval was obtained.
1.0
A. Jochems et al. / Radiotherapy and Oncology xxx (2016) xxx–xxx
1.0
0.8
0.6 0.4 Specificity
0.2
0.0
Fig. 4. Receiver operator characteristic curves for the model trained on all but one hospital and validated on the remaining hospital.
either 1000, 10,000 or 10,000 patients partitioned over 10 to 100 subsets with 0, 20% and 40% randomly missing data. The results of this analysis can be observed in Fig. 5. The average difference of percentages in the CPTs between the distributed model and local model averaged over all levels of degradation and all numbers of hospitals is 1.6% (±0.7%) for dataset size of 100,000. The average difference in terms of AUC between the distributed model and local model averaged over all levels of degradation and all numbers of hospitals is 0.002 (±0.002) for dataset size of 100,000. We compared the performance of the model for 3 different network structures. First, the expert defined network structure (Fig. 1A) was compared to the same structure without chemo timing. The AUC of the model is higher without chemo timing (AUC = 0.75, 95% CI: 0.53–0.97 versus 0.71 95% CI: 0.42–1), however, this difference is not significant (P = 0.84). We have used a data-driven approach to determine the network structure (Fig. 1B). The performance of the model using this structure is lower (AUC = 0.66, 95% CI: 0.36–0.96). However, this difference is not significant for the expert defined structure (P = 0.8), nor is it for the expert defined structure without chemo timing (P = 0.37). Discussion In this study, we developed and implemented a distributed learning approach for Bayesian networks using data from 5
Please cite this article in press as: Jochems A et al. Distributed learning: Developing a predictive model based on data from multiple hospitals without data leaving the hospital – A real life proof of concept. Radiother Oncol (2016), http://dx.doi.org/10.1016/j.radonc.2016.10.002
6
Distributed learning: learning from multiple hospitals without data leaving the hospital
Table 2 Conditional probability tables of the final model. Associated structure can be observed in Fig. 1. An additional table is added for Dyspnea given the same structure as observed in Fig. 1A, without chemo timing. FEV 1 Location
Hilar Area of the Right Lung
Upper Lobe of the Right Lung
Lower Lobe of the Right Lung
Cardiac comorbidity
No
Yes
No
Yes
No
Yes
Low (80)
32% 8% 61%
27% 16% 57%
14% 10% 76%
21% 21% 58%
23% 19% 58%
8% 41% 51%
Dyspnea PGrade 2
Baseline dyspnea
Fig. 5. Comparison of distributed learning versus local learning. Datasets were created by random sampling from the MAASTRO clinic data (N = 123). The first column shows the average difference in percentages of the conditional probability tables for the global and distributed model. The second column shows the difference in AUC for the global and distributed model. Rows depict the levels of artificially introduced random missing data (0%, 20%, 40%, respectively).
7
Most of these studies focus on learning the Bayesian network structure. Our work is an important addition to these existing studies, as our proposed method deals with the learning of the CPTs, rather than learning the network structure. Meng and colleagues propose a method by which distributed CPT learning can be done on horizontally distributed data [20]. However, their algorithm assumes all variables are binary valued. This is a restriction that is detrimental to model performance. Our approach enables learning from discretized variables of any number of levels and included determining the optimal bins of such discretization. Other CPT learning methods have been proposed [19,45], however, these algorithms focus on vertically partitioned data. Our algorithm provides a solution for horizontally partitioned data. Although that it can be observed from Fig. 5 that the models learned from distributed data have near-equivalent performance in comparison to that of models learned locally, a number of issues could arise in the future using our variable discretization approach. For example, a site with a low volume of patients may yield bin boundaries that are not representative due to overfitting. Additionally, bin boundaries cannot be computed in a hospital if there are no events available for the outcome in the data of that hospital. A number of solutions exist for problems with variable discretization. First, the experimenter can reject the bin boundaries computed in hospitals if they seem clinically implausible. Bin boundaries computed at the remaining sites may be combined to yet come to an acceptable global solution. Second, the binning strategy suggested in this paper may be replaced by setting bin boundaries manually based on locally learned data or observations in the literature. Privacy preservation is of vital importance when learning from medical data, as patient privacy and confidentiality of the physician are at risk [46]. In our approach, no data are transmitted between hospitals, other than the average bin information and model parameters. This information is an aggregate statistic and does not convey individual patient data, as long as there are multiple patients stored at each hospital. The hospitals communicate with the central location, but again only aggregate statistics relevant to the model are sent back and forth. If we consider the central location to be a trusted source, our algorithm is privacy preserving. Care must be taken that a sufficient number of patients are available at each site, so that none can be identified on the basis of the aggregate statistics. Model comparison
Distributed learning using regression and SVMs Techniques for distributed privacy-preserving linear, log-linear and logistic regression have already been proposed. Our method has an advantage over the earlier proposed methods. Bayesian networks do not require separate imputation methods to handle missing data. They circumvent this problem by Bayesian statistics which is important as hospital datasets often contain numerous missing values as we demonstrated in previous work [43]. The capacity to handle missing values properly is therefore crucial. As the goal of distributed learning is to learn from large numbers of patient data, using a method that is relatively fast is essential. Our algorithm finished learning from the 268 patients in less than 5 min. The bottleneck of the system was transmission of models back and forth between the central location and the hospitals, which accounted for over 80% of the time. Distributed learning in Bayesian networks Numerous algorithms for distributed learning for Bayesian networks have been proposed, for both horizontally and vertically distributed data with various levels of privacy protection [11–14,30].
Previously, our group has developed a model for radiationinduced lung toxicity based on single site data [47]. The previous model performed with an AUC of 0.67 on an external validation set. The model in this study performs better in some hospitals (Eindhoven, Liege) and worse in others (Maastro, Aachen, Jessa). Both studies were done on a limited number of patients (268 in this study versus 259 in the previous study [47]). This in turn results in large confidence intervals mentioned in the results section. It can be observed from the CPTs in Table 2 that baseline dyspnea greatly modulates the post-RT dyspnea score. The model predicts an 84% chance of dyspnea in the event that a patient has Pgrade 2 baseline dyspnea and concurrent chemotherapy, whereas a 24% chance of Pgrade 2 post-RT dyspnea is predicted for patients with