An web application has been developed, indicated as. âNeighborhood Energy .... telephone center costs by enabling the user to create automatic tickets in the ...
Developing a Web Application for Monitoring and Management of Smart Grid Neighborhoods Stamatis Karnouskos, Per Goncalves da Silva, and Dejan Ili´c SAP Research, Karlsruhe, Germany Email: {stamatis.karnouskos, per.goncalves.da.silva, dejan.ilic}@sap.com
ERP
SCM
CRM
Enterprise Applications
NOBEL Project Energy Services
Enterprise Services (IEM)
Brokerage Agent System
REST
Neighborhood Energy Management (NOEM)
User Management
Info Services
REST
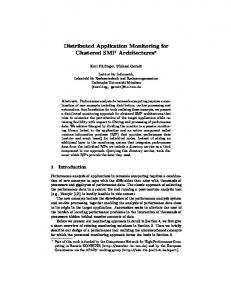
The emerging Smart Grid [1] empowered by modern IT technologies [2] is promising a more versatile and intelligent network of collaborating actors that will eventually lead to better utilization of its resources, better management and of course will enable us to achieve goals such as energy efficiency. Real-time monitoring and management are expected to be the key issues that need to be tackled. As the complexity increases, new tools tapping into the new infrastructure and its services should provide better ways to manage it. As a result numerous projects are launched in Europe [3] and worldwide. The NOBEL project (www.ict-nobel.eu) targeted the better management of Smart Grid neighborhoods (as depicted in Figure 1) by using a common energy services platform named enterprise Integration and Energy Management system (IEM) [4] to interconnect the prosumers (producers and/or consumers of energy) as well as various other stakeholders. IEM can be accessed only via Internet provided services via multiple channels such web and mobile. We have already designed and implemented several energy services [4] in IEM such as: (i) Energy Monitoring, (ii) Energy Prediction, (iii) Management, (iv) Energy Optimization, (v) Billing, (vi) Energy Trading (Brokerage) and (vii) other value-added services. Typically, such services can be mashed up in order to provide key functionalities for applications such as an energy portal, mobile applications, and also a district monitoring and management center. An web application has been developed, indicated as “Neighborhood Energy Management” in Figure 1, and called NOEM. The application communicates over Representational State Transfer (REST) style calls with the IEM, from which it
Marketplace
REST Energy Management System
IoT Data Capturing and Processing
Concentrator
Public Lighting Management
IoT Data Capturing and Processing
Citizen Energy Info
REST REST service based communication over wired/wireless links (IPv4/Pv6)
I. I NTRODUCTION
Billing Monitoring
Asset Management
REST
Abstract—Significant effort is invested towards creating innovative applications for the emerging Smart Grid. However, many of these efforts use the old modus operandi of the energy domain providers i.e. offer of a monolithic application residing on proprietary or provider-only data, with little thought about crossapplication collaboration and information exchange. However, the future of Smart Grid applications resides on sophisticated multi-channel applications that can rely on multi-source data and Internet provided basic services that can be easily customized for the specific end-user groups. Such a web application for monitoring and managing a Smart Grid neighborhood, where real-time energy monitoring, prediction and management of energy trading takes place, has been realized and piloted. We present here some of the key functionalities, as well as an assessment of the application and its design decisions.
Smart Grid Neighborhood
Smart City - Public Infrastructure
Figure 1. Overview of the NOBEL project approach
acquires all relevant information and depicts them to the enduser. NOEM has been greatly influenced from the outcome of a prosumer survey [5] we conducted where some features were identified. Both IEM and NOEM have been extensively tested and used operationally in the second half of 2012 as part of the NOBEL project trial which took part in the city of Alginet in Spain. Data in 15 min resolution of approximately 5000 meters were streamed over the period of several months to the IEM, while the IEM services were making available several functionalities ranging from traditional energy monitoring up to futuristic energy trading. NOEM was made available to the local electricity Distribution System Operator (DSO) in order to manage the Smart Grid neighborhood and get a glimpse of potential future functionalities such as managing energy trading at local level. However, we consider that other stakeholders present in the Smart Grid era [6] such as Energy Service Companies (ESCOs) as well as the envisioned adhoc prosumer groups [7] or even standalone prosumers might benefit from part of the functionalities provided by the NOEM. II. M ONITORING AND M ANAGEMENT WITH NOEM The NOEM application design and its functionalities were developed in order to provide a tool to monitor as well as manage Smart Grid neighborhoods. Some challenges faced were coupled with the need to be able to visualize realtime monitoring of various key indicators including energy production & consumption, prediction of energy usage, CO2 , energy trading volume, brokerage market management activities, energy optimization, customer communication etc. just to
name a few. The NOEM provides several functionalities that depend on the IEM services. It acts as a demonstrator of the real IEM capabilities while it targets mostly the administrator of the envisioned neighborhood infrastructure. The NOEM web application can be loaded by any web browser and is divided into eight functional areas: Overview, Monitoring, Management, Prediction, Brokerage, Optimization, Billing and Customer communication. Each functional area is accessible through its own tab, with the exception of the customer communication, which is accessible by clicking on the envelope icon located on top of the tabs. Most of the functional areas follow a simple pattern with an asset navigator on the left hand side, and the operational area on the righthand side. The asset navigator allows the user to choose assets like: device, customer, group, etc. while the operational area displays the types of operations the user can effectuate on the asset. For instance, in the “Monitoring” tab, the user can select a device and view its current and historical demand/supply. Overview: The “Overview” tab gives a high level view of the energy production and consumption by aggregating all device measurements. It also provides some additional information about the generation mix used to produce the electricity in the grid. The overview can also provide historical values by using the “start time” and “end time” dates located on top of the overview chart. Its usefulness is to provide a high level view for the Smart Grid neighborhood with the main KPIs at place.
Figure 2. The “Overview” tab showing total demand, CO2 and energy mix
Monitoring: The primary motivation of the monitoring view is to provide a high resolution report on energy production and consumption of the prosumer. The energy monitoring of NOEM also includes alarms (event monitoring) and notification capabilities. The navigator is in a tree format and can be used to select a particular group, customer, or device to be viewed; in addition search-as-you-type functionality has also been embedded to ease searching of specific customers, ids, meters etc. The NOEM application calls the relevant IEM services to present the required data. It provides the capability of monitoring the total demand reported by all the meters (Figure 2) as well as the demand and supply reported by individual meters. Furthermore, additional metering data, that
is, voltage, active power, reactive power, frequency, current and power factor, can be viewed. This data can be queries for specific time periods using the available controls. NOEM also allows users to set thresholds for devices, customers, and groups in the form of power (W) or energy (kWh). If the customer’s, devices, or group’s consumption exceed the threshold, an alarm could be sent to the user.
Figure 3. The “Monitoring” tab showing a customer’s daily demand profile
Energy Brokerage: Energy trading is one of the key parts of NOEM as it is used also during the pilot to monitor and manage user’s energy trades. The brokerage view in NOEM allows operators to manage several aspect of the participants in the NOBEL electricity marketplace [8]. Functionalities include monitoring of all market activities, overview of all market orders in a time frame, or in a particular time slot, visualization of information such as the trading price and total volume for selected time slots (in time window), as well as the last price curve and volume curve for each time slot. Operators also use this to control several aspects of the market itself e.g. the market participation for customers based on their capability of participation, or even disabling/invalidating customer activities e.g. trades. Additionally, market operators can manage the brokerage agents used by the participants for automatic trading. The “Market” view (Figure 4) allows the user to view current and historical market prices and traded volume. The “Order Book” view allows the user to inspect the order book (the current buy and sell orders) for a particular trading timeslot. Similarly the “Transactions” view enables a full list of transactions that occurred in the timeslot including info on price, quantity, transaction time, buyer participant id, seller participant id, the buy order id, and the sell order id. The “Market Participants” view allows the user to select a customer (or multiple customers) and enroll into or remove them from the market. The “Agents” view shows a table with all of the automated trading agents in the IEM along with information about the customer on whose behalf they are trading and the management capabilities for that agent. User and Asset Management: The “Management” tab is used for SCRUD (Search, Create, Read, Update Delete)
Figure 5. Modifying the demand prediction of a customer
Figure 4. The “Market” view depicting traded volume and prices
operations on groups, customers, users, and devices. Additionally, security aspects such as roles and permissions can also be managed here. Once a particular asset is selected, all of its information will be displayed, Devices also have location information attached to them; this enables the operator to view the device’s location on a map with some asset information integrated. A key aspect is also the support for the creation of dynamic groups (of assets, users etc.) used for monitoring purposes or realization of the envisioned prosumer virtual power plants (pVPPs) [7]. Prediction: NOEM enables users to update the demand or supply prediction for individual customers, devices, or groups. Prediction can be used by the customers and operators to help with their electricity planning and trading activities. The “Prediction” tab is used in a similar way as the “Monitoring” tab. A group, customer, or device is selected and the standard time controls are used to specify the period over which to predict that asset’s consumption, production, or aggregation. Once a prediction is made, the table on the right-hand (Figure 5) side can be used to correct any prediction errors e.g. based on human intelligence. Billing: NOEM offers a real-time billing view for utility customers. Operators can introduce and assign new tariffs (possibly energy pattern optimized) to their customers, what can be also considered as contracting a customer. Since NOBEL realizes a neighborhood electricity marketplace, market transactions are also reflected in the unified bill, containing energy provider charges and market activity results i.e. money earned or to be paid based on sells/buys on the marketplace. In this way NOEM offers a tool to avoid the “bill-shock” at the end of a longer period and gives better control to the customers as any time they can be aware of their current bill and make their plan for the future. Optimization: Using the available infrastructure, flexibility
management may offer additional business advantages. Although energy may be traded directly on a marketplace, in some cases direct bilateral negotiation may also take part. Some generic functionality towards this has been realized [9]. The “Optimization” tab allows users to negotiate with third parties in order to get them to behave in a particular way. For instance, if a retailer has bought too much energy in a period, and has no way of on-selling it, it could engage with the public lighting system and pay it to turn on or increase lamp brightness in order to avoid potentially more expensive penalty fees [9]. Here users can be enrolled as demand response participants. Once a participant is selected, the user can request the participant’s initial offer for either consumption, or production. That is, what the participant is willing/able to do to increase production or consumption, and how much it would cost to behave in this way. The user can then update the behavior curve, and submit this as a counteroffer to the participant. The participant can then counter with another offer. This negotiation continues until the user accepts a participant’s offer. Customer Communication: The NOEM front-end application depends on the interaction with the information services from the IEM. Operators are able to directly interact with the customers and capable of messaging groups or individual customers. In our prototype the customer communication button allows the sending of text messages which are depicted on the mobile device or as e-mail. The bilateral direct communication of customers and operators has the ability to eliminate telephone center costs by enabling the user to create automatic tickets in the provider’s system as well as receive customized offers. III. NOEM D EVELOPMENT I SSUES A. Framework selection The NOEM application makes use of the REST services provided by the IEM, which use Google Protocol Buffers (GPB) messaging format. One of the main design decisions is NOEM should not rely on local dependencies with the IEM, and that for instance it could be hosted on a different machine. Therefore, the NOEM would only have access to the API
offered by the IEM services, and it could not use any backchannels, for instance, direct access to the database storing the IEMs data etc. No reliably maintained JavaScript library for GBP could be found, as such, the decision was made to implement the NOEM using a J2EE (Java Enterprise Edition) framework, as opposed to creating a webpage using HTML or HTML5 with JavaScript to make the service calls to the IEM. By using an enterprise application framework, the server could handle the service calls through a REST library and the messages could be de/serialized using the official GPB library supplied by Google. Thus leaving the framework in charge of the business logic and rendering. Given the requirements for the NOEM application, e.g. charting and geolocation, the chosen framework would need to easily support all required functionalities either natively or through third party libraries built for the chosen framework. Additionally, it would need to facilitate development by natively supporting widgets such as trees, tables, lists, text fields, text areas, pop-up windows, and so on. Furthermore, it would need to easily support localization, to allow the user to choose between different languages. While several frameworks were looked at as possible candidates, two stood out: Eclipse RAP (Remote Application Platform: www.eclipse.org/rap) and Apache Wicket (wicket.apache.org). Eclipse RAP is based on Eclipse RCP (Rich Client Platform). A RAP application can be thought of as RCP application that is deployed on a server and accessed through a web browser. The general look-and-feel is the same, and in fact, a RAP application can be converted in to an RCP application with minor modifications. Meaning that, should there be a need, a desktop version of the NOEM application could be created. However, after our initial tests, it was found that there was a steep learning curve associated with the platform, and that even simple tasks were quite hard to achieve and involved many lines of code. Additionally, at least at the time, there were not many third party libraries for RAP that easily supported Google Maps (for the geolocation) and charting. What was found was either cumbersome to use, or visually unappealing or lacking in features. Apache Wicket, provides a fairly simple framework. Views are implemented as HTML files, and the matching elements, with their business logic, is developed directly in Java. The UI aspect of Wicket is closely related to Java Swing (Java’s desktop GUI framework), in which we already had some experience. Furthermore, there were many third party libraries to choose from, which add additional functionality in an easy to integrate and use manner. For these reasons, Apache Wicket was chosen as the underlying framework for the implementation of the NOEM application. B. Implementation Architecturally, the NOEM application is separated into different areas: Data Access Objects (DAO), model objects, custom widgets and tabs as depicted in Figure 6. The DAO layer is responsible for making the calls to the IEM services
and translating the responses into the model objects used by the application. The model objects contain the information to be presented to the user by the widgets. A few reusable custom widgets were created, generally in the form of a collection of standard widgets. For instance, the navigation widget used in many of the functional areas of the NOEM application combine a tree widget with a set of buttons at the top.
Figure 6. NOEM implementation layers
A tab represents a functional area in the NOEM (e.g. Overview, Monitoring, and Management). Each tab aggregates the functionality directed at a particular task. For instance, the “Monitoring” tab has all the necessary controls for selecting a particular customer/device/group and browsing their current and historical energy demand/supply, as well as the other measurements supplied by the meters (e.g., voltage, active power, and reactive power). The tab panel was implemented as a wicket object called AjaxTabbedPanel. This means that the user can switch between tabs without the feeling that the whole page is being reloaded. In hindsight, this was a poor design decision. While it was good for user experience, it meant that the whole application is basically one page. This made analyzing the access logs very difficult, as each tab does not have its own distinguishable URL. The custom navigation widget relied mainly the tree view, which presented a hierarchical view of the devices, customers, and groups. Ultimately, this was also a bad UI decision. Given the large numbers of devices and customers (around 5000), presenting all of these entities became very time consuming, as the server response (on the NOEM side) consisted of a large number of entities encoded in HTML (for rendering in the browser), which took a long time to download and render. In order to mitigate this, the server settings were changed to compress the responses (minimizing the download time). Additionally, a cache layer was created on the NOEM, making it faster for it to server the browser with the necessary content, by not having to go to the IEM for every request. This increased the complexity of the NOEM since the cache needed to be managed. It might have been better to adopt a different UI approach, and also augmenting the relevant IEM services with paging. This way, a small number of entities could be requested and rendered. As more are needed, the pagination on the IEM services could be used to request the next set of entities. The DAO layer was separated into interfaces and their implementation. In this way, the NOEM application could be easily modified to be used with different methods of acquiring the data, for instance, a DAO implementation for getting the data directly from the database could be created, or it could be adapted to be used with a completely different set of
web-services (as long as they could supply the same type data). For the current implementation, the Jersey Client API (jersey.java.net) was used for the communication between the NOEM and the IEM. The Jersey Client API is tailor made for communicating with REST services, and simplified this process immensely. The NOEM development process was generally smooth, and at the end the code base consisted of approx. 26,000 source lines of code. Because the UI is organized hierarchically (like HTML), it can sometimes be difficult to get the widget information it needs, because it needs to traverse several layers of the hierarchy before reaching the relevant UI element. This sometimes leads to unnecessary message passing between objects that can complicate the implementation, and more importantly the maintenance and bug fixing effort. The main third party libraries used where wiqueryhighcharts (github.com/hielkehoeve/wiquery-highcharts) and wicketstuff’s Google Maps V2 (github.com/wicketstuff/core/ wiki). The wiquery-highcharts is a charting plug-in based on the Highcharts library (www.highcharts.com) that provides easy integration of Highcharts charts into Wicket application. The provided charts are visually appealing. However, the plugin, did not provide full support for all Highchart features, such as adding a second y-axis (for multiple time series of different units). In contrast, integration into the project was fairly easy and displaying and updating the charts was also straightforward. Wicketstuff’s Google Maps V2 plugin provides Wicket with support for the Google Maps API. This plug-in was a challenge to get working, and ultimately we only managed to get it to work in the Firefox browser. At the time however, it was the only available Google Maps plug-in that we could find. To conclude, given the requirements for the NOEM application and the limitations imposed by the IEM services, namely GPB, Wicket was probably the right framework. However, there were some questionable decisions regarding the UI components used that led to an increase in complexity. Wicket is a widely used framework for web applications, thus it has a big community and many projects augmenting its functionality. While using external plug-ins sometimes led to problems in their successful integration in the project, these problems were overcome and they provided most of the required functionality. However, ultimately, it would have been better if the IEM services supported plain standard messaging formats just as JSON and XML. This way, the NOEM application could have been developed as a web-page, with all the service calls being done by the browser itself through JavaScript and AJAX. Additionally, a wider selection of APIs would be available for use (in terms of charting, maps, and perhaps others), making the development somewhat easier. IV. T RIAL P ERFORMANCE AND U SAGE NOEM was live in the city of Alginet, Spain, in 2012 where it was used in monitoring and managing data from approx. 5000 users. Although this was a parallel setup to the existing infrastructure (for research purposes), live access to the data
generated was possible and hence several functionalities could be tested. The NOEM application visualizes data retrieved from the IEM through its REST service API. The retrieved data must then be deserialized, processed and formatted for presentation on the browser. In order to evaluate the response time of the NOEM, the response times for requests directed at the NOEM were extracted from the access log file to produce a “response time duration curve” that shows the percentage of requests for which the response times were above a particular threshold. Requests to the NOEM application cover everything from retrieving data from the IEM, to browser requests for any other element responsible for presenting the retrieved data and other UI elements, for instance, images, JavaScript files, CSS files, and HTML files. Some of these might maybe very quick to serve and might skew the response time duration curve. As it can be seen in Figure 7, the NOEM generally performed well with roughly less than 5% of response times being above 1 sec. Generally variability on response time can be expected as some of the requests can be quite resource and computationally intensive, such as requesting interpolated time-series data for long time periods (e.g., 3 months) or large number of groups (e.g., 1000 customers). The longest recorded response time was of about 5 min (300975 ms). This was unusually high, with the next highest being about 1.5 min (88747 ms), and occurred while trying to login to the NOEM. Given the duration of the response time, we think it is likely the login attempt occurred while the server was starting up and the server probably tried to handle the request while waiting for the NOEM sub-components to start-up.
Figure 7. Response time duration curve for NOEM requests (log scale)
From the usage perspective, we wanted also to see which functionalities were mostly used in NOEM. In order to extract the tab usage statistics, it was necessary to extract from the access log the IEM service categories (e.g. monitoring, management, optimization, etc.) that were called by the NOEM. It was not possible to look at the requests made to the NOEM directly, as due to the usage of the AjaxTabbedPanel, the URLs generated by Wicket for the NOEM application generally unintelligible. However, by looking at the IEM service calls made by the NOEM, a suitable estimation can be made, since each tab basically groups the functionality offered by a particular IEM service category. For instance, the “Overview” and “Monitoring” tabs make use of the monitoring services; the “Management” tab makes use of the management services, etc. The results are depicted in Figure 8, where the number of requests by service category and type of request are shown.
The type of request refers to the CRUD operation the request targeted.
Figure 8. Overall NOEM usage by function and data operation (log scale)
As it can be seen, acquisition operations had the highest request counts across all service categories, particularly monitoring (i.e. viewing current and historical customer demand data), and management (i.e. viewing customer/device/group information). All other operations had fairly low request counts. This is possibly due to the fact that inserting customer and device information, which would likely yield the highest count amongst creation requests, was done outside the NOEM using dedicated custom tools (since manually entering the information for over 5000 customers, and their devices, would be too cumbersome). The usability of the NOEM was also evaluated during the trial, more specifically each tab (i.e., overview, monitoring, management, prediction, brokerage, optimization, billing, customer contact) functionality was assessed for (i) usefulness and (ii) perceived speed. All tabs got the highest rating for speed with exception of the prediction which heavily relied on massive data analysis and hence could be quicker if more optimizations and potentially a dedicated high performance server were in place. For usefulness most functions were rated as excellent (overview, monitoring, billing and customer contact), while the newer functionalities such as management, prediction, brokerage and optimization got average values. The later however was partially biased as one should get a deep understanding of the theoretical aspects e.g. of the market, before proceeding with the operational part of brokering or energy optimization. Understandably also the management functions although rated as useful, in a real system they are expected to be integrated with existing systems and not as a new system that requires a steep learning curve. Concluding, it is crucial to co-innovate and closely collaborate with endusers when new innovative functionalities are developed, in order to assure that end-user concerns are integrated in userfriendly functionalities which will lower the learning curve and enhance the user experience. V. C ONCLUSIONS Developing a web application for the market-enabled Smart Grid neighborhood has been a interesting experiment where we had to balance among real-world requirements, needs of futuristic functionalities such as energy trading, technologydriven decisions, user-friendliness and the wish to use open source technologies. Developing Smart Grid web applications
made evident the need to rely on common energy services provided by the infrastructure or other stakeholders that will enable the developers to focus on offering sophisticated functionalities rather than implementing the whole value chain. This is more critical if one considers smart city wide monitoring, management and value added services e.g. as envisioned within the SmartKYE (www.SmartKYE.eu) project. Hence aspects such as interoperability, and standardized data exchange formats are a must [10]. As most of the devices used for visualization will be mobile ones, special considerations need to be made when developing applications for them in order to get proper performance [11]. ACKNOWLEDGMENT The authors would like to thank for their support the European Commission, and the partners of the EU FP7 projects SmartKYE (www.SmartKYE.eu) and NOBEL (www. ict-nobel.eu) for the fruitful discussions. R EFERENCES [1] X. Yu, C. Cecati, T. Dillon, and M. Sim˜oes, “The new frontier of smart grids,” Industrial Electronics Magazine, IEEE, vol. 5, no. 3, pp. 49–63, Sep. 2011. [2] R. Katz, D. Culler, S. Sanders, S. Alspaugh, Y. Chen, S. DawsonHaggerty, P. Dutta, M. He, X. Jiang, L. Keys, A. Krioukov, K. Lutz, J. Ortiz, P. Mohan, E. Reutzel, J. Taneja, J. Hsu, and S. Shankar, “An information-centric energy infrastructure: The berkeley view,” Sustainable Computing: Informatics and Systems, 2011. [3] V. Giordano, A. Meletiou, C. F. Covrig, A. Mengolini, M. Ardelean, G. Fulli, M. S. Jim´enez, and C. Filiou, “Smart Grid projects in Europe: Lessons learned and current developments 2012 update,” Joint Research Center of the European Commission, JRC79219, 2013. [4] S. Karnouskos, P. Goncalves Da Silva, and D. Ilic, “Energy services for the smart grid city,” in 6th IEEE International Conference on Digital Ecosystem Technologies – Complex Environment Engineering (IEEE DEST-CEE), Campione d’Italia, Italy, Jun. 2012. [5] P. Goncalves Da Silva, S. Karnouskos, and D. Ilic, “A survey towards understanding residential prosumers in smart grid neighbourhoods,” in The third IEEE PES Innovative Smart Grid Technologies (ISGT) Europe, Berlin, Germany, 14–17 Oct. 2012. [6] European Commission, “SmartGrids SRA 2035 – Strategic Research Agenda: Update of the SmartGrids SRA 2007 for the needs by the year 2035,” European Technology Platform SmartGrids, European Commission, Tech. Rep., Mar. 2012. [Online]. Available: http://www.smartgrids.eu/documents/sra2035.pdf [7] S. Karnouskos, “Demand side management via prosumer interactions in a smart city energy marketplace,” in IEEE International Conference on Innovative Smart Grid Technologies (ISGT 2011), Manchester, UK, Dec. 5–7 2011. [8] D. Ilic, P. Goncalves Da Silva, S. Karnouskos, and M. Griesemer, “An energy market for trading electricity in smart grid neighbourhoods,” in 6th IEEE International Conference on Digital Ecosystem Technologies – Complex Environment Engineering (IEEE DEST-CEE), Campione d’Italia, Italy, Jun. 2012. [9] S. Karnouskos, D. Ilic, and P. Goncalves Da Silva, “Using flexible energy infrastructures for demand response in a smart grid city,” in The third IEEE PES Innovative Smart Grid Technologies (ISGT) Europe, Berlin, Germany, 14–17 Oct. 2012. [10] J. Bryson and P. D. Gallagher, “NIST framework and roadmap for smart grid interoperability standards, release 2.0,” National Institute of Standards and Technology (NIST), Tech. Rep. NIST Special Publication 1108R2, Feb. 2012. [Online]. Available: http://www.nist.gov/smartgrid/ upload/NIST Framework Release 2-0 corr.pdf [11] N. C. Zakas, “The evolution of web development for mobile devices,” Queue, vol. 11, no. 2, pp. 30:30–30:39, Feb. 2013.