Developing an Evolutionary Neural Network Model for Stock Index Forecasting Esmaeil Hadavandi1, Arash Ghanbari2, and Salman Abbasian-Naghneh3,* 1
Department of Industrial Engineering, Sharif University of Technology, Tehran, Iran, P.O. Box: 11365-9466 2 Department of Industrial Engineering, College of Engineering, University of Tehran, Tehran, Iran P.O. Box 11155-4563 3 Department of Mathematics, Islamic Azad University, Najafabad Branch, Najafabad, Iran
[email protected],
[email protected],
[email protected],
[email protected]
Abstract. The past few years have witnessed a growing rate of attraction in adoption of Artificial Intelligence (AI) techniques and combining them to improve forecasting accuracy in different fields. Besides, stock market forecasting has always been a subject of interest for most investors and professional analysts. Stock market forecasting is a tough problem because of the uncertainties involved in the movement of the market. This paper proposes a hybrid artificial intelligence model for stock exchange index forecasting, the model is a combination of genetic algorithms and feedforward neural networks. Actually it evolves neural network weights by using genetic algorithms. We also employ preprocessing methods for improving accuracy of the proposed model. We test capability of the proposed method by applying it to forecast Tehran Stock Exchange Prices Indexes (TEPIX) which is used in literature, and compare the results with previous forecasting methods and Back-propagation neural network (BPNN). Results show that the proposed approach is able to cope with the fluctuation of stock market values and it also yields good forecasting accuracy. So it can be considered as a suitable tool to deal with stock market forecasting problems. Keywords: Stock Market Forecasting, Genetic Algorithm, Artificial Neural Networks, Evolutionary Neural Network.
1
Introduction
Stock market forecasting is a tough problem. This is primarily because of the uncertainties involved in the movement of the market. Many factors interact in the stock market including political events, general economic conditions, and traders’ expectations. So, stock price time-series data is characterized by nonlinearities, *
Corresponding author.
D.-S. Huang et al. (Eds.): ICIC 2010, CCIS 93, pp. 407–415, 2010. © Springer-Verlag Berlin Heidelberg 2010
408
E. Hadavandi, A. Ghanbari, and S. Abbasian-Naghneh
discontinuities, and high-frequency multi-polynomial components and predicting market price movements is quite difficult. Artificial intelligence that computerizes human reasoning has been widely used in many areas including financial time series forecasting. AI-based techniques are becoming more and more widespread. These techniques such as artificial neural networks (ANNs), fuzzy logic, genetic algorithms (Gas), are being developed and deployed worldwide in myriad applications, main reasons behind this issue are: their accuracy, symbolic reasoning, flexibility and explanation capabilities [1]. Nowadays, more and more effort has been focused on AI models to stock market prediction and using AI models or combining several models has become a common practice to improve forecasting accuracy and the literature on this topic has expanded dramatically. [2] Hadavandi et al. [3] presented an integrated approach based on genetic fuzzy systems (GFS) and artificial neural networks (ANN) for constructing a stock price forecasting expert system. They used stepwise regression analysis to determine factors which have most influence on stock prices, then divided the raw data into k clusters by means of self-organizing map (SOM) neural networks. Finally, all clusters will be fed into independent GFS models with the ability of rule base extraction and data base tuning. Results show that the proposed approach outperforms other methods such as ANN and ARIMA. Chang et al. [4] used a Takagi–Sugeno–Kang (TSK) type Fuzzy Rule Based System (FRBS) for stock price prediction. They used simulated annealing (SA) for training the best parameters of fuzzy systems. They found that the forecasted results from TSK fuzzy rule based model were much better than those of back propagation network (BPN) or multiple regressions. Esfahanipour and Aghamiri [5] used NeuroFuzzy Inference System adopted on a TSK type Fuzzy Rule Based System for stock price prediction. The TSK fuzzy model applies the technical index as the input variables and used Fuzzy C-Mean clustering for identifying number of rules. Proposed model is tested on the Tehran Stock Exchange Indexes (TEPIX) and Taiwan stock Exchange index (TSE). Results showed that the proposed model can effectively improve the forecasting performance and outperforms other models. ANNs is One of the strongest AI models can learn the complex nature of the relationship between inputs and outputs. In developing a feedforward neural network model for forecasting tasks, specifying its architecture in terms of the number of input, hidden, and output neurons and weight training are an important task. Among the literatures regarding using the ANNs as the forecasting tool, most of them focus on Back-propagation Neural Network. Yet, there are two shortcomings of BP: first, Although BP has some successful applications, the algorithm often gets trapped in a local minimum of the error function and is incapable of finding a global minimum if the error function is multimodal and/or non-differentiable. [6], second, it has been found that BP does not perform well with networks with more than two or three hidden layer. [7] .These problems and others have prompted research into employing evolutionary techniques to find the best set of network weights. Evolutionary techniques have several obvious advantages over BP: genetic algorithms and other evolutionary approaches are able to find global minima in complex, multimodal spaces, they do not require a differentiable error function and they are more flexible, allowing the fitness evaluation to be changed to take into account extra factors that are not easy to incorporate in the BP algorithm. [8]. There are many researchers have used GA for learning of neural networks and the results showed that GA had better
Developing an Evolutionary Neural Network Model for Stock Index Forecasting
409
performance compared to BP. [9,10]. This paper proposed an evolutionary neural network (ENN) model for stock exchange index forecasting that combined genetic algorithms and feedforward neural network model and evolving neural network weights by Using genetic algorithms. Also we used preprocessing methods such as stepwise regression analysis (SRA) for input selection and data transformation to improve forecasting accuracy of the proposed method. We test capability of the proposed method by applying it to forecasting Tehran Stock Exchange Prices Indexes (TEPIX) that used by Esfahanipour and Aghamiri [5] as case study.
2 2.1
Methodology Variables Selection by Stepwise Regression Analysis
Variable selection is the process of selecting an optimum subset of input variables from the set of potentially useful variables which may be available in a given problem. In recent years some researcher have used SRA for input variable selection in the field of stock market forecasting and they’ve obtained very promising results [6,7]. So, in this paper we adopt stepwise regression to analyze and select variables, and as its consequence improve the forecasting accuracy of the system. Stepwise regression method determines the set of independent factors that most closely determine the dependent variable. This task is carried out by means of the repetition of a variable selection. At each of these steps, a single variable is either entered or removed from the model. For each step, simple regression is performed using the previously included independent variables and one of the excluded variables. 2.2
Artificial Neural Networks (ANNs)
ANNs consists of an inter-connection of a number of neurons. There are many varieties of connections under study, however, here we will discuss only one type of network which is called multilayer perceptron (MLP). In this network the data flows forward to the output continuously without any feedback. We have used a typical three-layer feed forward model for forecasting stock exchange. The input nodes are the technical indexes, while the output provides the forecast for the stock exchange index. Hidden nodes with appropriate nonlinear transfer functions are used to process the information received by the input nodes. The model can be written as Eq. (1). (1) where m is the number of input nodes, n is the number of hidden nodes in 1’th hidden layer and s is the number of hidden nodes in 2’th hidden layer, f is a sigmoid transfer function such as the logistic, , and g is hyperbolic tangent (tanh),
,{
, k=0,1,…,s}, {
, j=0,1,…,n} is a vector of
weights from the 2’th hidden layer to output nodes and 1’th hidden layer to 2’th hidden layer nodes respectively. { ,i=1,2,…,m; j=0,1,…n} are weights from the
410
E. Hadavandi, A. Ghanbari, and S. Abbasian-Naghneh
input to 1’th hidden layer nodes, , , , are weights of arcs leading from the bias terms that have values always equal to 1. The MLP’s most popular learning rule is the error back-propagation algorithm. Back-propagation learning is a kind of supervised learning introduced by Werbos (1974) [11] and later developed by Rumelhart and McClelland (1986) [12]. At the beginning of the learning stage all weights in the network are initialized to small random values. The algorithm uses a learning set, which consists of input–desired output pattern pairs. Each input–output pair is obtained by the offline processing of historical data. These pairs are used to adjust the weights in the network to minimize the sum-squared error (SSE), which measures the difference between the real and the desired values over, all output neurons and all learning patterns. After computing SSE, the back-propagation step computes the corrections to be applied to the weights. The attraction of MLP has been explained by the ability of the network to learn complex relationships between input and output patterns, which would be difficult to model with conventional algorithmic methods. The disadvantage of ANN is that because the network finds out how to solve the problem by itself, its operation can be unpredictable. In this paper the effort is made to identify the best-fitted network for the desired model according to the characteristics of the problem and ANN features. [13] 2.3
Genetic Algorithm
Genetic Algorithms are inspired by biological systems’ improved fitness through evolution [14]. Using the GAs, each individual in the population needs to be described in a chromosome representation. A chromosome is made up of a sequence of genes from a certain alphabet. An alphabet could consist of binary digits, continues values, integers, symbols, matrices, etc. The representation method determines how the problem is structured in the GA and determines the genetic operators that are used. In this work, a chromosome is represented by a vector of continues values, as it has been shown that natural representations are more efficient and produce better solutions. In this case, the chromosome length is the vector length of the solution which is coefficients of our model. In GA, search starts with an initial set of random solutions known as population. Each chromosome of population is evaluated using some measure of fitness function which represents a measure of the success of the chromosome. Based on the value of the fitness functions, a set of chromosomes is selected for breeding. In order to simulate a new generation, genetic operators such as crossover and mutation are applied. According to the fitness value, parents and offsprings are selected, while rejecting some of them so as to keep the population size constant for new generation. The cycle of evaluation–selection–reproduction is continued until an optimal or a near-optimal solution is found. Selection attempts to apply pressure upon the population in a manner similar to that of natural selection found in biological systems. Poorer performing individuals (evaluated by a fitness function) are weeded out and better performing, or fitter, individuals have a greater than average chance of promoting the information they contain to the next generation. Crossover allows solutions to exchange information in a way similar to that used by a natural organism undergoing reproduction. This operator randomly chooses a
Developing an Evolutionary Neural Network Model for Stock Index Forecasting
411
locus and exchanges the subsequences before and after that locus between two chromosomes to create two offspring. Mutation is used to randomly change (flip) the value of single bits within individual strings to keep the diversity of a population and help a genetic algorithm to get out of a local optimum. It is typically used sparingly [15]. 2.4
The Proposed Evolutionary Neural Networks
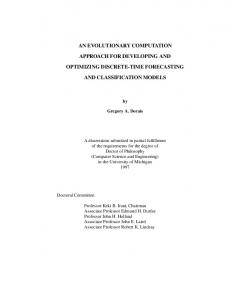
In this section, we apply GAs to evolve the weights between neurons in different layers in the neural network. Steps for evolving of connection weights is described below: Step1-Encoding Each gene presents the weight between two neurons in different layers. A chromosome is constructed from a series of genes as shown in Fig 1. In this Figure, for a normal feedforward neural network that has 3 neurons in input layer, 2 neurons in hidden layer and 1 neuron in output layer , the first gene in the chromosome is the The Second gene is the weight weight between neuron 1 and neuron 4, i.e. between neuron 1 and neuron 5, i.e. and so on. We use real number form to represent the connection weights.
Fig. 1. Chromosome encoding
Step 2. Generate the initial population ) is generated randomly. Each of Initial weights are The initial population ( randomly generated between -1 and 1. Step 3 - Calculating the fitness values As regards the fitness function, it is based on the root mean squared error (RMSE) over a training data set, which is represented by the following expression: 1
(2)
is the actual value and is the output value of ith training data obtained Where is from the neural network using the weights coded in jth chromosome ( ) and the number of training data.
412
E. Hadavandi, A. Ghanbari, and S. Abbasian-Naghneh
Step 4 – Selection mechanism We use truncation selection scheme for selection procedure. In truncation selection individuals are sorted according to their fitness. Only the best individuals are selected for parents. The truncation threshold indicates the proportion of the population to be selected as parents. Then we use binary tournament selection scheme for selection parents for generating new offsprings by use of genetic operators. In binary tournament selection, two members of the population are selected at random and their fitness compared and the best one according to fitness value will be chosen to one parent. Also another parents selected with the same procedure. Step 5 - Genetic operators We use two-point crossover [16] and one point mutation [16] for genetic operators. Step 6 – Replacement The current population is replaced by the newly generated offsprings, which forms the next generation. Step 7 - Stopping criteria If the number of generations equals to the maximum generation number, then stop; otherwise go to step 3.
3
Empirical Results
In this section we implement the proposed evolutionary neural network model by using TEPIX data that used by Esfahanipour and Aghamiri [7] as case study. Tehran Stock Exchange has evolved into an exciting and growing marketplace where individual and institutional investor trade securities of over 420 companies. TEPIX is a weighted market value all share prices appearing on the Tehran Stock Exchange Price Board. TEPIX calculation method is as follows: ∑ ∑
(3)
Where and represent share price of company , respectively at time and at the close of trading on March 21st,1990; and shows the total number of shares. We used seven technical indexes as input variables. Technical indexes are calculated from the stock price’s time series, trading volumes and time which are following a set of formula. Basically, the input technical indexes can be classified as index TEPIX movement or particular stock price variations, such as Nine days stochastic line (KD), Six days relative strength index (RSI), moving average convergence and divergence (MACD), Six days moving average (MA6), Six days bias (BIAS6), 13 days psychological line (PSY) and Volume [5]. Data for TEPIX has used from April 20, 2006 to January 31, 2009 contain 863 records and the first 694 records will be training data and the rest of the data, i.e., 169 records will be test data. 3.1
Constructing BPNN and ENN Model for TEPIX Forecasting
In the first stage, we normalized data over range [-0.9,0.9], then we used stepwise regression [17] to eliminate low impact factors and choose the most influential ones
Developing an Evolutionary Neural Network Model for Stock Index Forecasting
413
out of mentioned factors. The criterion for adding or removing is determined by F-test statistic value and decreasing the sum of squared error. After the entrance of first variable to the model, the variable number is increased step by step; once it is removed from this model, it will never enter the model again. Before selecting variables, the critical point, level of significant and the values of Fe (F-to-enter) and Fr (F-to- remove) have to be determined first. Then the partial F value of each step has to be calculated and compared to Fe and Fr; If F > Fe, it is considered to add variables to the model; otherwise, if F < Fr, the variables are removed from model [17].The statistical software SPSS 17.0 was used to applying stepwise regression analysis in this research considering 3.84 and 2.71. The outcomes of this stage are MA6 and BIAS6 indexes. In the second stage, we constructed the proposed ENN model and ANN trained with back-propagation algorithm (BPNN) using Matlab Software [18]. To meet the best network architecture with least error, different feature of parameters such as transfer functions types, number of hidden layers, number of nodes for each layer and suitable features of genetic algorithm has been examined.
Table 1. Tuned features of ENN model ENN-Optimum Features Training
Network Architecture (input-hidden-output) Transfer Function
Method Population Size Crossover Rate Mutation Rate
GA 80 0.8 0.08
Truncation Threshold # Iterations
0.2 2000
2-4-4-1 Sigmoid-Sigmoid-Tanh
Table 2. Tuned features of BPNN model BPNN-Optimum Features Training
Network Architecture (input-hidden-output) Transfer Function
Method Learning Rate Momentum Rate # of Iterations
BP 0.15 0.8 2000
2-4-4-1 Sigmoid-Sigmoid-Tanh
414
E. Hadavandi, A. Ghanbari, and S. Abbasian-Naghneh
Best obtained features of ENN and BPNN models after tuning process are detailed in Tables 1 and Table 2 respectively. At the last stage stock index forecasting will be done by means of test data. 3.2
Performance Analysis of ENN Model
For the purpose of evaluating forecasting accuracy of the proposed ENN model, we will compare outputs of this model with the model proposed by Esfahanipour and Aghamiri [7] and BPNN by a common evaluation statistic called MAPE: MAPE
100
1 N
|Y
P|
4
Y
Where Y is the actual value and P is the forecasted value of ith test data obtained from the models and N is the number of test data. Summary of ENN evaluations in comparison with the other methods is shown in Table 3. Regarding to Table 3, our proposed model has improved the forecasting accuracy of TEPIX. Namely, ENN has made 71% and 28% improvement in the obtained MAPE for the hybrid method that proposed by Esfahanipour and Aghamiri [7] and BPNN model respectively, so this shows that it can be considered as a promising alternative for stock market forecasting problems. Table 3. ENN evolutions vs other methods
4
Method
MAPE(%)
Hybrid of fuzzy clustering and TSK fuzzy system [7] ANN trained with back-propagation (BPNN) ENN(Proposed model)
2.4 0.97 0.69
Conclusions
This paper presented an evolutionary neural network (ENN) model for stock market forecasting by combining genetic algorithms and feedforward neural networks. The hybrid model evolves neural network weights by means of genetic algorithms. We used data preprocessing methods such as stepwise regression (for input selection) and data transformation (to improve forecasting accuracy of ENN). Experimental results showed that the proposed approach is able to cope with the fluctuations of stock market values and it also yields good prediction accuracy in case of TEPIX forecasting. So, it can be considered as effective approach to forecast the stock market time series.
Developing an Evolutionary Neural Network Model for Stock Index Forecasting
415
References 1. Metaxiotis, K., Kagiannas, A., Askounis, D., Psarras, J.: Artificial intelligence in short term electric load forecasting: a state-of-the-art survey for the researcher. Energy Conversion and Management 44, 1525–1534 (2003) 2. Khashei, M., Bijaria, M., Ardali, G.: Improvement of Auto-Regressive Integrated Moving Average models using Fuzzy logic and Artificial Neural Networks (ANNs). Neurocomputing 72(4-6), 956–967 (2009) 3. Hadavandi, E., Shavandi, H., Ghanbari, A.: Integration of genetic fuzzy systems and artificial neural networks for stock price forecasting. Knowl. Based Syst. (2010) doi:10.1016/j.knosys.2010.05.004 4. Chang, P.-C., Liu, C.: A TSK type fuzzy rule based system for stock price prediction. Expert Systems with Applications 34, 135–144 (2008) 5. Esfahanipour, A., Aghamiri, W.: Adapted Neuro-Fuzzy Inference System on indirect approach TSK fuzzy rule base for stock market analysis. Expert Systems with Applications (2010) doi:10.1016/j.eswa.2009.11.020 6. Yao, X.: Evolving artificial neural networks. In: Proceedings of the IEEE, vol. 87, pp. 1423–1444 (1999) 7. Bartlett, P., Downs, T.: Training a neural network with a genetic algorithm. Technical Report, Dept. of Electrical Engineering., University of Queensland (1990) 8. Knowles, J., Corne, D.: Evolving Neural Networks for Cancer Radiotherapy. In: The Practical Handbook of GENETIC ALGORITHMS Applications, pp. 475–520. Chapman & Hall/CRC (2001) 9. Kuo, R., Chen, J.: A decision support system for order selection in electronic commerce based on fuzzy neural network supported by real-coded genetic algorithm. Expert Systems with Application 26, 141–154 (2004) 10. Chang, P.-C., Wang, Y., Tsai, C.: Evolving neural network for printed circuit board sales forecasting. Expert Systems with Applications 29, 83–92 (2005) 11. Werbos, P.I.: Beyond regression: new tools for prediction and analysis in the behavior sciences. Ph.D.Thesis, HarvardUniversity, Cambridge, MA, USA (1974) 12. Rumelhart, D.E., McClelland, J.L.: Parallel distributed processing: explorations in the micro structure of cognition, Foundations. MITPress, Cambridge (1986) 13. Azadeh, A., Asadzadeh, S.M., Ghanbari, A.: An adaptive network-based fuzzy inference system for short-term natural gas demand estimation: Uncertain and complex environments. Energy Policy 38, 1529–1536 (2010) 14. Holland, J.: Adaptation in natural and artificial systems. University of Michigan Press (1975) 15. Coley, D.: An introduction to genetic algorithms for scientists and engineers. World Scientific Publishing Co., Singapore (2003) 16. Goldberg, D.: Genetic algorithms in search, optimization and machine learning. AddisonWesley, Reading (1989) 17. Burkholder, T., Lieber, R.: Stepwise regression is an alternative to splines for fitting noisy data. Journal of Biomechanics 29(2), 235–238 (1996) 18. Mathworks-Inc: MATLAB The Language of Technical Computing. The MathWorks, Inc. (1998)