S. Fitrianie et al.
Concept-Based User Interface using Icons
Developing Concept-Based User Interface using Icons for Reporting Observations Siska Fitrianie Man-Machine Interaction Group, Delft University of Technology
Zhenke Yang Man-Machine Interaction Group, Delft University of Technology
[email protected]
[email protected]
Leon J.M. Rothkrantz Man-Machine Interaction Group, Delft University of Technology
[email protected] ABSTRACT
In recent years, we have developed a visual communication interface for reporting observations in which messages can be constructed using a spatial arrangement of icons. Each icon on the interface represents a concept or idea. This paper reports about research on a visual language interface, which allows users to create structured messages of icon strings simultaneously in a two-dimensional parallel and spatial configuration. The developed system provides drawing tools and predefined sets of icons that support a free and natural way to sketch and describe crisis situations. A coherent and context dependent interpretation of the icon configuration can be constructed by the employment of ontology. In addition, the interface is also able to convert the interpretation into crisis scenarios as feedback to the user on his/her input. Keywords
Icon-based interface, reporting observations, crisis ontology, communication system, mobile device application. INTRODUCTION
The need for more advanced crisis-management technology and procedures to cope with the results of communication breakdown has emerged in the wake of many natural and man-made disasters. Lessons learned from past disasters, such as 9/11, hurricane Katrina and Rita, has pin pointed communications as the limiting factor in disaster response (Moore, 2006). In particular, there is a lack of methods to provide up to date information during the coordination of rescuing and response activities. By collecting many small but up to date observation reports from all the parties involved in the event, and interpreting them automatically, a contribution can be made to enhance the understanding and awareness of the scope and impact of the crisis. Towards this goal, we have developed icon-based communication interfaces for reporting observations on mobile devices, such as PDAs and smart phones (Fitrianie & Rothkrantz, 2005; Fitrianie et al. 2006; Yang & Rothkrantz, 2007). Wireless ad-hoc architecture is utilized to connect these mobile devices without the need for a central base station. A blackboard structure is used for distributing information. This infrastructure is developed to support people who must work collaboratively, which include rescue teams, crisis center operators, and civilians (i.e. victims and witnesses). Crisis responders need to gather situational information (e.g., state of the civil, transportation, and information infrastructures) and resource information (e.g., available medical facilities, rescue and law enforcement units). Clearly, there is a strong correlation between the reliability and timeliness of the information available and the quality of the decisions that responders make. The use of icons to represent concepts or models makes user interaction on the user interface suitable in a language independent context (Perlovsky, 1999). Since user-interaction options on mobile devices are limited (due to their small-size form) and speech input is less suitable for mobile activities (Bousquet-Vernhettes, 2003; Kjeldskov & Kolbe, 2002), direct icon manipulation is one of the fastest interaction alternatives to date. Moreover, the descriptive meaning of icon-based messages can show a more direct link to multimodal concepts and a more direct mapping with “real world” phenomenon (Norman, 1993).
Proceedings of the 5th International ISCRAM Conference – Washington, DC, USA, May 2008 F. Fiedrich and B. Van de Walle, eds.
S. Fitrianie et al.
Concept-Based User Interface using Icons
In previous work, we have developed a translation module that uses a dedicated grammar to interpret and convert visual messages into natural language text and speech by adopting approaches of Natural Language Processing. Hints, navigation and visual cues, next icon prediction, and search engine are provided to help users with message creation. However, the grammar still forces the users to follow linguistic lines behind sentence constructions. This makes the previous solutions somewhat rigid and requires the users to learn a “new” grammar. In contrast the linear ordering of words in spoken language, a visual language has a multi dimensional structure with a temporal and spatial configuration, e.g. the sign language syntax for deaf people (Bevelier, 1998), comic illustrations (Cohn, 2003), and diagrams (Chin et al. 2006). The research reported here is on our new icon-based communication interface that allows for a free and natural way of creating a spatial arrangement of graphics symbols (i.e. icons, lines, arrows and shapes) to represent concepts or ideas. Our solutions include the construction of a coherent and context dependent world model as the interpretation of the communicated situations. The world model can be used to form (natural language) crisis scenarios as feedback to the user on his/her icon arrangements. Here, we explore a method to interpret the way in which people link and group certain concepts to describe events. The structure of this paper is as follows. In the following section, we start with related work and overview of our research domain. Next, the visual language interface is presented. We continue with the description of the world knowledge representations in two sections. Further, the knowledge construction and the scenario generation basedon user inputs are explained, respectively. After that we present the experiments and their results. Finally, we conclude the paper. RELATED WORK
Recent discoveries in the Peruvian Amazon indicate that sketches and images represent important tools for communication research and praxis (Singhal & Rattine-Flaherty, 2006), especially to communicate about topics that are difficult to speak about. Recent attempts have been made to develop computer-based icon communication systems, which mainly aimed at supporting people to communicate with each other despite not sharing a common language. Some systems are dedicated for speech impairment people (Basu, 2002; Baker, 2005). Most systems are based on linguistic theories, such as the Conceptual Dependency Theory1 (Beardon 1992; Leemans, 2001; Fitrianie et al., 2006) and Basic English2 (Champoux et al., 2000). A message can be composed using an arrangement of icons or using combinations of symbols to compose new symbols with new meanings (Bliss, 1984; Housz, 1996). The arrangement can be realized in a rigid linear order (Yazdani and Mealing, 1995; Fitrianie & Rothkrantz, 2005; Leemans, 2001) or a non linear order (Housz, 1996; Fitrianie et al., 2006). Only some of them (Fitrianie & Rothkrantz 2005; Fitrianie et al. 2006; Baker, 2005) produce text as output of the interpretation of visual representation. Some of these systems are hard to learn or language specific. They are either based on too complex linguistic theories or on non-intuitive icons. Current emergency response systems, such as WHISPER (Ramaswamy et al., 2006), CAMAS (Mehrotra et al., 2004), and VCMC (Otten et al., 2004), have incorporated aspects of human observations. For sharing and discussing crisis information in real-time, their architectures include a text-based web interface. In 2003, a set of standard map icons has been promoted by the U.S. Government for emergency response applications and sharing information among emergency responders (Dymon, 2003; HSWG, 2003). This set of symbols has been used also by the governments of Australia and New Zealand. Tatomir & Rothkrantz (2005) has developed a set of icons for constructing a map representing features such as crossing types and road blocks. It is used on their developed iconbased interface for sharing and merging topological maps in damaged buildings. The knowledge can be used for reasoning about the state of the building and providing guidance to given locations. OVERVIEW: CORPUS AND EXPERT-BASED KNOWLEDGE ENGINEERING
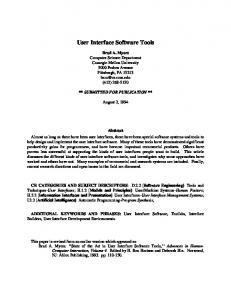
During crisis situations crisis workers in the field have to communicate with people in the crisis center in order to achieve a most effective crisis response. Figure 1(a) shows a schematic view of a crisis situation. A crisis responder 1
The Conceptual Dependency Theory (Schank, 1972) introduces the notions of conceptualizations and concepts which are units of meaning loosely corresponding to the grammatical units of clauses and words (e.g. noun, verb, and adjective) in a sentence construction. 2
The Basic English is an attempted core subset of the English language (Ogden, 1930).
Proceedings of the 5th International ISCRAM Conference – Washington, DC, USA, May 2008 F. Fiedrich and B. Van de Walle, eds.
S. Fitrianie et al.
Concept-Based User Interface using Icons
in the field (agent) is an autonomous participant that can report observations. Such sensed data, what observers see, hear, smell and even feel or experience, is transformed into reports for others. At any time, agents are associated with a location in the geographical space. The crisis center collects the reports and forms a global view about the crisis. An intelligent system helps them to calculate the most probable causes, predicts the impact of the crisis and gives advices based on the world model. Further, the knowledge is used for supporting the decision making process and executing actions. This paper investigates two aspects of an observation reporting system for human observers. The first is on iconbased message formulation. To acquire knowledge on formulating icon-based messages from text messages, a workshop was held (Fitrianie, 2004). In addition, a large number of icon-based message corpora were analyzed. From both studies, we found that related icons are placed close to each other, grouped or emphasized by links.
(a)
(b)
Figure 1 (a) Schematic view: Disaster Dispersion (Ellipses) Occurs on the World; (Human and Artificial) Agents in the Field Report Crisis Situations, and (b) Schematic Architecture of the Communication Interface
Secondly, the world knowledge formation based on user reports is investigated. To understand how people report crisis situations, three different data sources have been analyzed: (1) over 100 dialogues from 9-1-1 recording transcriptions (SFMuseum, 1989; WNBC, 2002), (2) news articles with six different crisis topics (such as fire, bombing, flooding, tsunami, earthquake, and terrorist attack), and (3) interview results with experts from the Southern Rotterdam Fire Department and the crisis center of the Rijnmond environmental agency (DCMR) (Benjamins, 2006). In this research, overall studies serve a number of purposes: • • • •
developing a list of possible crisis scenarios, developing a list of concepts that play an important part in crisis situations, analyzing relations between concepts, and designing and implementing an interface for reporting observations.
The analysis results (from DCMR) show that a hypothesis concerning a crisis situation is generated from the information extracted from the reports arriving during the crisis. The hypothesis is based on considerations of a limited set of crisis scenarios, such as fire, explosion, chemical plant contamination, etc. Each scenario has associated features, some of which can be important factors to distinguish one scenario from another. Each feature mainly is described as the result of human perception, such as sound, vision, odor, and feeling. A report usually focuses on certain keywords and specific terms. The information from different observers has to be combined to have a clear view about the reported crisis situation. With the information from the recorded corpora and experts, a set of predefined crisis scenario and their associated features (concepts) were formulated. Next, the formulated scenarios were tested to make sure that the concepts associated with each scenario were discriminative enough so that each scenario was identifiable by a unique set of concepts. Finally, the concepts we further developed into the system’s ontology, while a selection of the scenarios were developed into scripts. A script represents the chain of events that identify a possible scenario (Schank and Proceedings of the 5th International ISCRAM Conference – Washington, DC, USA, May 2008 F. Fiedrich and B. Van de Walle, eds.
S. Fitrianie et al.
Concept-Based User Interface using Icons
Abelson, 1977). Both ontology and scripts are employed in the world knowledge construction (see below for details). Figure 1(b) shows information flow within a user’s observation interface. VISUAL LANGUAGE DISPLAY
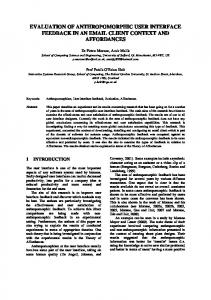
Figure 2 (a) shows the developed icon-language based interface for reporting observation in crisis situations on a PDA. It has a drawing area where users can attach and rearrange icons on. Related icons can be shown by: 1. 2. 3.
Placing related icons relatively near to each other and far from other groups of icons. Drawing an ellipse around the icons. Drawing a link between two icons, between an ellipse and an icon, or between two ellipses. There are two types of a link, such as (1) a line represents a direct link and (2) an arrow → represents a causality link, an icon results another icon.
The interface provides mechanisms to draw and delete ellipses and links. The arrangement of icons will be read from left to right and top to bottom. Figure 2(b) shows the variant of the observation interface, where the icon language can be formed on a map. The map gives additional information such as the world coordinate position of an icon and the spatial relation of the icon to static objects, e.g. buildings, streets, and parcels.
(a)
(b)
Figure 2 Icon Language-Based Interface and Examples of Resulted Scenario: on (a) a Drawing Area and (b) a Map
Proceedings of the 5th International ISCRAM Conference – Washington, DC, USA, May 2008 F. Fiedrich and B. Van de Walle, eds.
S. Fitrianie et al.
Concept-Based User Interface using Icons
A user can select an icon by three options: (a) the icon menu in which the icons are grouped based on their concepts, (b) the next icon prediction results, which are calculated by adapting an n-gram word prediction technique, and (c) the search engine, which finds icons based on a keyword. The user can create multiple pages of icon-based messages. As the user constructs the messages, the system will continuously analyze, and create or adapt a world model and try to find the scenario that matches the messages. When user observations are submitted, the system transmits the adapted world model to the network. ONTOLOGY-BASED KNOWLEDGE REPRESENTATION
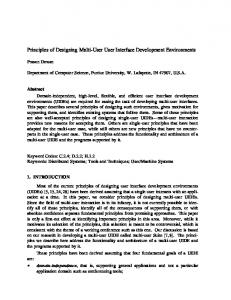
The world model consists of two contexts: the dynamic and the static. The dynamic context is represented by a chain of temporal specific events and a group of dynamic objects in action at a certain location in the world. While the static context is the geographical information concerning the crisis location, such as buildings, streets and parcels. The knowledge of both contexts is stored in ontology represented in W3C-OWL. It has direct links to the visual symbols on the user interface. Figure 3 (a) shows the class WorldObject, which refers to an entity involved in a crisis event. The icons are the instances of the subclasses of this class. For example, the icon “victim” is a Victim, a subclass of an Actor. We represent geospatial knowledge of crisis situations using graphs for data modeling. The graph connects its nodes based on their approximated spatial coordinates in the world. The lower nodes represent objects, actions or events in the world. They do not only contain specific information of events and objects, but also their current status (for example living condition and dynamic spatial state), their temporal information (for example frequency and time point), and their spatial information (for example current location, origin, destination and path). The arcs represent the hierarchy of groups of individuals or show the relations among concepts (for example result, cause and contain). At the root, a node describes the perspective location of the crisis event. The illustration in Fig. 3(b) shows some events: a collision of two transportation entities (car and truck), has resulted in an explosion, and the explosion has caused toxic gas and fire.
WorldObject StaticObject … DynamicObject Actor … CrisisEvent Collision Explosion … RescueEvent … Transportation Car Truck … Tool … Substrate … Preposition …
(a)
(b)
Figure 3 (a) the WorldObject Taxonomy, and (b) Graph-based Symbolic Representation of a Crisis Event on a Certain Location in the World
DYNAMIC SCRIPTING
In this research, we assume that knowledge about crisis situations is represented in the human mind as many scripts. Triggered by the key events being perceived by the human senses e.g. sight, hearing, smell, a script can be recognized without having perceived all the events that constitutes the script (Yang & Rothkrantz, 2007). In our system, a script consists of some frames of events, which are distinguished by some conditions (see Figure 4). A weight value is assigned on each frame to show how important the frame is. Usually, a frame becomes important
Proceedings of the 5th International ISCRAM Conference – Washington, DC, USA, May 2008 F. Fiedrich and B. Van de Walle, eds.
S. Fitrianie et al.
Concept-Based User Interface using Icons
because it contains key concepts that make up the frame’s salience. We use importance value of a script to measure how attractive the script is to be selected. This value shows how many (salience) concepts are covered. As the system gets a notion of the events occurring while interpreting the user message, certain scripts become more plausible then others. As more concepts are perceived, the evidence in favor of the correct scenario increases. This in turn increases the plausibility of the corresponding of script. On the other hand, the evidence might contradict a scenario. In this case another script becomes more plausible. Using only concepts that occur in the user message, i.e. concepts that have been entered specifically, only scripts that contain concepts entered by the user have a chance of being selected. Based on knowledge in ontology, certain concepts can be inferred from the existence of other concepts e.g. if there is a collision there is an accident. Using ontology, derived concepts can thus be inferred even though not specifically entered by the user. As concepts in ontology have direct links to concepts in scripts, derived concepts can increase the importance value of the related scripts, making them more plausible than other scripts. If there is more than one script, the system will select a script with the highest importance value, unless all values are below the low threshold. In such a case, none of scripts is selected.
Figure 4 An Example of Script (in XML Format)
WORLD KNOWLEDGE GENERATOR
Figure 5 shows the schematic view of the module for interpreting icon-based messages and forming the world model. In our view, each concept represents a puzzle piece (Figure 5(a)). Each piece can have properties to be filled in by other concepts. This creates relations between them. A relation or some relations may create a new concept. By relating all or some important pieces, we can see the actual picture, i.e. the observer’s view. This observer’s view is used to define a script. The selection of the right script is the goal of the interpretation process. Inspired by the work of Dor (2005), we approach this puzzle arrangement problem by a hybrid agent-based architecture (Figure 5(b)).
Proceedings of the 5th International ISCRAM Conference – Washington, DC, USA, May 2008 F. Fiedrich and B. Van de Walle, eds.
S. Fitrianie et al.
Concept-Based User Interface using Icons
Workspace
Workspace is where perceptual structures are built on top of the drawing area (user input). It contains all instances of concepts that are represented by icons on the drawing area. The model makes use of three types of structures: 1. 2. 3.
Description of icons. Links representing the relation between icons and groups of icons Groups of icons (represented by ellipses or their relative location).
Ontology
The Ontology holds predefined concepts in the form of a graph of concepts and properties. As agents (see below) find matching instances in the workspace, they activate their corresponding concept-property in the ontology. The activation of each concept-property affects the agent to consider it while working on a solution to a given problem. When a concept in the Ontology is activated, it will try to assign as many properties as possible by launching more agents to search for more values. As a result, an active concept will spread some activation to other relevant concepts. Furthermore, an active concept can activate one or more scripts. The activation levels of concepts decays at predefined intervals when agents fail to fill in their properties. By this mechanism, the system processes concepts which were dynamically deemed relevant, while still allowing new concepts to be perceived by constantly launching agents.
Accident (Observer’s view)
Top down
Bottom up
(Activated) concepts and their relations (System’s view)
(a)
(b)
Figure 5 (a) Concept-based Puzzle Arrangement Metaphor, and (b) Agent-based Approach for Icon-based Messages Interpretation
Script
An active concept in Ontology can activate one or more Scripts. In any process, there can be many competing scripts. An active script can launch more agents to evaluate each condition in each frame. As more concepts are active in the Ontology, more key concepts are represented most common to some competing scripts. As a result, certain scripts become impossible and are removed from competition. This process continues until, there is only one Proceedings of the 5th International ISCRAM Conference – Washington, DC, USA, May 2008 F. Fiedrich and B. Van de Walle, eds.
S. Fitrianie et al.
Concept-Based User Interface using Icons
script left. If the last script also becomes impossible, the rest unevaluated scripts are evaluated. The process is repeated. Additionally, an active concept may activate an evaluated script. In this way scripts that have been removed from competition previously can become competitive again. This entire construction process will be stopped if there is not any script left to be evaluated. Agents
Agents are created to continually look for interesting properties and relationship among the concepts and the message structures on the drawing area and attempt, on the basis of their findings, to build groups of related concepts, build relations between concepts, activate new concepts, and fill in properties of the active concepts. These agents dynamically build (or break) all structures on the workspace by agents. There are two types of agents, bottom-up and top-down agents. Bottom-up agents look for any structure they might find. Top-down agents look for instances of particular concepts. Top-down agents are sent by active scripts or concepts. In the current implementation, a bottom-up agent can be dedicated for the detection of the following features or relationships: 1.
Whether icons are grouped.
2.
“two yellow cars” “female victim” Whether icons are linked.
“female victim”
3.
“a car, a yellow bicycle and a bus”
“two victims are in the hospital”
“the fireman searches a victim” “the collision results an explosion” In a group of related icons, whether an icon is placed before (xa