APPLIED AND ENVIRONMENTAL MICROBIOLOGY, Aug. 2004, p. 4971–4979 0099-2240/04/$08.00⫹0 DOI: 10.1128/AEM.70.8.4971–4979.2004 Copyright © 2004, American Society for Microbiology. All Rights Reserved.
Vol. 70, No. 8
Development and Application of a Real-Time PCR Approach for Quantification of Uncultured Bacteria in the Central Baltic Sea Matthias Labrenz,1† Ingrid Brettar,1 Richard Christen,2 Sebastien Flavier,2 Julia Bo ¨tel,1 and Manfred G. Ho ¨fle1* Department of Environmental Microbiology, GBF-German Research Centre for Biotechnology, 38124 Braunschweig, Germany,1 and UMR 6543 CNRS and Universite´ Nice Sophia Antipolis Centre de Biochimie, F-06108 Nice, France2 Received 13 December 2003/Accepted 9 April 2004
We have developed a highly sensitive approach to assess the abundance of uncultured bacteria in water samples from the central Baltic Sea by using a noncultured member of the “Epsilonproteobacteria” related to Thiomicrospira denitrificans as an example. Environmental seawater samples and samples enriched for the target taxon provided a unique opportunity to test the approach over a broad range of abundances. The approach is based on a combination of taxon- and domain-specific real-time PCR measurements determining the relative T. denitrificans-like 16S rRNA gene and 16S rRNA abundances, as well as the determination of total cell counts and environmental RNA content. It allowed quantification of T. denitrificans-like 16S rRNA molecules or 16S rRNA genes as well as calculation of the number of ribosomes per T. denitrificans-like cell. Every real-time measurement and its specific primer system were calibrated using environmental nucleic acids obtained from the original habitat for external standardization. These standards, as well as the respective samples to be measured, were prepared from the same DNA or RNA extract. Enrichment samples could be analyzed directly, whereas environmental templates had to be preamplified with general bacterial primers before quantification. Preamplification increased the sensitivity of the assay by more than 4 orders of magnitude. Quantification of enrichments with or without a preamplification step yielded comparable results. T. denitrificans-like 16S rRNA molecules ranged from 7.1 ⴛ 103 to 4.4 ⴛ 109 copies mlⴚ1 or 0.002 to 49.7% relative abundance. T. denitrificans-like 16S rRNA genes ranged from 9.0 ⴛ 101 to 2.2 ⴛ106 copies mlⴚ1 or 0.01 to 49.7% relative abundance. Detection limits of this real-time-PCR approach were 20 16S rRNA molecules or 0.2 16S rRNA gene mlⴚ1. The number of ribosomes per T. denitrificans-like cell was estimated to range from 20 to 200 in seawater and reached up to 2,000 in the enrichments. The results indicate that our real-time PCR approach can be used to determine cellular and relative abundances of uncultured marine bacterial taxa and to provide information about their levels of activity in their natural environment. cillus anthracis (24, 30), and Legionella spp. (45), and from viruses (11) or for the quantification of insulin-like growth factors (28). Recently, applications of real-time PCR have also been demonstrated with marine samples to quantify diatoms and pelagophytes (41) and numbers of cells of Synechococcus spp., Prochlorococcus spp. (37), and Pseudomonas stutzeri (12); with soil samples to quantify cells of Rhodococcus spp. (31), methanotrophs (19), and fungi (9); with sediments to quantify cells of Geobacter spp. (36); in wastewater treatment plants to quantify nitrifying bacteria (13); and with cultures to determine dissimilatory (bi)sulfite reductase gene expression in Desulfobacterium autotrophicum (26). One advantage of PCR techniques, apart from their great potential for automation, is their sensitivity. Theoretically, PCR should detect one copy of the 16S rRNA gene (39). Lockey et al. (21) described a real-time PCR method and validation strategy useful to detect a singlecopy herpes simplex virus thymidine kinase gene. Moreover, a single B. anthracis spore was detected in 100 liters of air sampled by real-time PCR (24). However, for the most part, sensitivity becomes limited below 100 gene copies per reaction mixture (12, 35). Sensitivity and specificity can be improved by adopting a “nested” or a “heminested” PCR approach, whereby initial amplification is carried out with a pair of primers with broad specificity (14, 38). This has been successfully used to detect
Many of the molecular techniques currently used in microbial ecology lack a quantitative component. Nevertheless, quantification of microbial abundances is of great relevance for the understanding of microbial community structure and dynamics in natural environments. Certainly, for enumeration and spatial localization of specific microorganisms in natural samples, whole-cell fluorescence in situ hybridization techniques hold considerable promise (14). However, PCR-based techniques provide an alternative that could be more sensitive and less labor intensive. For example, this has been demonstrated for the ultramicrobacterium Sphingomonas alaskensis, which could not be detected by fluorescence in situ hybridization, despite the ability to detect it by PCR (5, 33). Real-time PCR is a new and highly sensitive method for the quantification of microorganisms from different samples (40). Typical quantitative PCR (Q-PCR) techniques utilize approaches originally developed for clinical applications. Q-PCR has been used for the quantification of taxa and target genes from various bacteria, such as Staphylococcus aureus (15), Ba* Corresponding author. Mailing address: Department of Environmental Microbiology, GBF-German Research Centre for Biotechnology, Mascheroder Weg 1, 38124 Braunschweig, Germany. Phone: 49 (0) 531-6181-419. Fax: 49 (0) 531-6181-411. E-mail:
[email protected]. † Present address: IOW-Institute for Baltic Sea Research Warnemuende, Biology Section, 18119 Rostock-Warnemuende, Germany. 4971
G1 G2 G3 G4 G6 G7 G9 G10 Bx21 Bx23 Bx24
APPL. ENVIRON. MICROBIOL. a Total 16S RNA contents from seawater samples and enrichments with T. denitrificans-like-organism-specific relative and cellular 16S rRNA and 16S rRNA gene abundances and estimated number of ribosomes per T. denitrificans-like cell. Standard deviations are given in parentheses. —, below detection limit. b Based on 1.15 ⫻ 109 molecules of 16S rRNA/ng. c Data from Weinbauer et al. (44). d Value indicates a 16-fold increase of ribosome content per cell in comparison to that of the original environmental sample. e Value indicates a 70-fold increase of ribosome content per cell in comparison to that of the original environmental sample. f Value indicates a 100-fold increase of ribosome content per cell in comparison to that of the original environmental sample.
2.58 ⫻ 102 (⫾4.30 ⫻ 101) — — 9.00 ⫻ 101 (⫾3.01 ⫻ 101) 3 4.19 ⫻ 10 (⫾4.27 ⫻ 102) 7.08 ⫻ 104 (⫾2.64 ⫻ 104) 1.35 ⫻ 105 (⫾3.17 ⫻ 104) — 2.96 ⫻ 105 (⫾4.50 ⫻ 104) 5.10 ⫻ 105 (⫾1.19 ⫻ 105) 2.20 ⫻ 106 (⫾3.54 ⫻ 105) 4.86 ⫻ 104 (⫾1.34 ⫻ 103) 3.89 ⫻ 104 (⫾1.23 ⫻ 104) 7.10 ⫻ 103 (⫾2.92 ⫻ 102) 8.78 ⫻ 103 (⫾3.42 ⫻ 101) 2.76 ⫻ 105 (⫾5.34 ⫻ 104) 4.80 ⫻ 106 (⫾8.02 ⫻ 104) 2.58 ⫻ 106 (⫾9.18 ⫻ 104) — 3.18 ⫻ 108 (⫾3.11 ⫻ 107) 7.09 ⫻ 108 (⫾3.97 ⫻ 107) 4.43 ⫻ 109 (⫾8.86 ⫻ 108) 1.62 ⫻ 109 (⫾4.48 ⫻ 107) 0.003 (⫾0.003) 6.59 ⫻ 107 (⫾2.09 ⫻ 107) 0.059 (⫾0.018) 3.54 ⫻ 108 (⫾1.46 ⫻ 107) 0.002 (⫾0.001) 2.44 ⫻ 108 (⫾9.51 ⫻ 105) 0.0036 (⫾0.0024) 3.32 ⫻ 108 (⫾6.43 ⫻ 106) 0.083 (⫾0.038) 5.24 ⫻ 108 (⫾8.75 ⫻ 106) 0.916 (⫾0.251) 5.53 ⫻ 108 (⫾1.97 ⫻ 107) 0.466 (⫾0.075) 4.65 ⫻ 107 (⫾3.78 ⫻ 106) — 3.76 ⫻ 109 (⫾2.63 ⫻ 108) 8.445 (⫾0.826) 3.71 ⫻ 109 (⫾1.45 ⫻ 108) 19.099 (⫾1.070) 8.90 ⫻ 109 (⫾1.19 ⫻ 107) 49.723 (⫾9.951) 5 30 50 80 120 138 175 225 G7 G9 G9
Sample
1.41 (⫾0.04) 0.06 (⫾0.02) 0.31 (⫾0.01) 0.21 (⫾0.00) 0.29 (⫾0.01) 0.46 (⫾0.01) 0.48 (⫾0.02) 0.04 (⫾0.00) 3.27 (⫾0.22) 3.23 (⫾0.13) 7.74 (⫾0.10)
% Relative abundance
No. of molecules/ml
2.15 1.31 0.53 0.43 0.27 0.85 0.90 1.10 1.66 1.31 4.43
0.012 (⫾0.002) — — 0.021 (⫾0.007) 1.552 (⫾0.158) 8.346 (⫾3.110) 15.055 (⫾3.519) — 17.850 (⫾2.709) 38.894 (⫾9.100) 49.654 (⫾8.001)
No. of T. denitrificans-like cells/ml Total cells (106/ml)c
T. denitrificanslike-organismspecific 16S rRNA gene fraction (% relative abundance) T. denitrificans-like-organism-specific 16S rRNA fraction
Total 16S rRNA (no. of molecules/ml)b Total 16S rRNA content (ng/ml) Depth (m) or source of enrichment (sample)
TABLE 1. Comparison of total 16S rRNA contents from seawater samples and enrichmentsa
200 — — 100 70 70 20 — 1,100d 1,400e 2,000f
LABRENZ ET AL. No. of ribosomes/ T. denitrificanslike cell
4972
autotrophic ammonia-oxidizing bacteria in samples of lake water (14) or in combination with species-specific PCR product melting temperatures (with SybrGreen) to identify pathogenic Campylobacter species (23). Our main interest is the ecology of microbial catalysts involved in major biogeochemical processes of the central Baltic Sea. Previous studies (3, 4) have shown that autotrophic denitrification may be an important process for N balance in the central Baltic Sea. Thus, in the present study, bacteria responsible for autotrophic denitrification were chosen as a target for our research. In a combined experimental and molecular approach, a bacterium related to Thiomicrospira denitrificans was identified as a major catalyst. Quantification of bacterial catalysts independent from their ribosome contents or the necessity of culturing these bacteria is a tool urgently needed for elucidating their ecology. We developed a specific Q-PCR technique allowing quantification of T. denitrificans-like bacteria both in experimental enrichments and in environmental samples. The method is based on specific primers (OST 1R and OST 1F) designed from a consensus sequence obtained from community fingerprints of Baltic bacterioplankton (M. G. Ho ¨fle, S. Flavier, R. Christen, J. Bo ¨tel, M. Labrenz, and I. Brettar, submitted for publication). The method gave reliable results when it was applied to DNA as well as to RNA extracted from bacterioplankton. Our approach allowed the in situ detection of a bacterial catalyst under consideration down to 90 cells ml⫺1 or a relative abundance of 0.01% without the need of absolute standards in real-time experiments. Based on total bacterial cell counts, the number of ribosomes per cell could also be estimated. This approach may help to improve quantification of major bacterial catalysts, especially for oligotrophic environments, and allow us to gain new insights into their in situ ecology. MATERIALS AND METHODS Sampling, analysis of samples, and growth conditions. Water samples were taken at depths of 5 to 225 m in the central Baltic Sea (Gotland Deep) in September 1998 (Table 1). Sample handling and physicochemical analysis have been described elsewhere (3, 10). The samples were filtered immediately onto a sandwich of a Nuclepore filter (pore size, 0.2 m) and a glass fiber filter (GF/F; Whatman) and stored frozen for later analysis (16). To enrich autotrophic denitrifiers, water samples from the oxic-anoxic interface at 138 m (in situ concentrations: NO3, 0.4 mol liter⫺1; H2S, 5.7 mol liter⫺1; no O2), above the interface at 120 m (O2, 0.3 ml; NO3, 8.0 mol liter⫺1; no H2S), and below the interface at 175 m (H2S, 24 mol liter⫺1; no NO3) were incubated at 5°C in the dark in gastight 1.2-liter bottles after the addition of 150 mol of KNO3 liter⫺1 and 100 mol of Na2S2O3 liter⫺1. Controls were run without substrate addition. After 44 h (samples Bx21 and Bx23) and 88 h (sample Bx24), enriched water samples were processed analogously to the untreated water samples. Total bacterial counts were determined as described by Weinbauer et al. (44). Nucleic acid extraction and quantification. To process the nucleic acids of the water samples harvested on sandwich filters, nucleic acid extraction and quantification from the frozen filters were performed by parallel extraction of RNA and DNA (using a phenol extraction protocol) as described by Weinbauer et al. (43). Nucleic acid concentrations were determined fluorometrically (42). Prior to RT-PCR and fluorometric analysis, RNA extracts were treated with DNase I (Roche Diagnostics, Mannheim, Germany) for 60 min at 37°C. Primers. The application of 16S ribosomal complementary DNA (rcDNA) single-strand conformation polymorphism analysis and sequencing of dominant bands (29) demonstrated that an autotrophic denitrifying bacterium related to, but not identical with, T. denitrificans was the dominant autotrophic denitrifier in the above-described enrichments (Ho ¨fle et al., submitted). Subsequent development of highly specific primers against this bacterium has also been described in detail (Ho ¨ fle et al., submitted). T. denitrificans-like forward primer OST 1F (5⬘-TCAGATGTGAAATCCAATGGCTCA-3⬘) corresponds to 16S rRNA
VOL. 70, 2004
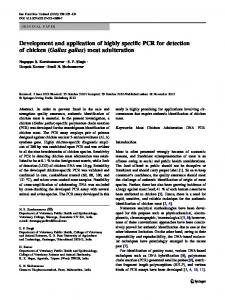
FIG. 1. Agarose (1.2%) gel of RT-PCR amplification products based on the OST 1F-OST 1R (OST) or Com 1-Com 2ph (Com) primer system from various template RNAs. Templates originated from the thiosulfate-plus-nitrate enrichment Bx21, T. denitrificans DSM 1251T, or E. coli K-12. The first lane contains molecular size markers (100 bp). NC, negative control.
Escherichia coli positions 663 to 686, and reverse primer OST 1R (5⬘-CTTAGC GTCAGTTATGTTCCAGG-3⬘) corresponds to E. coli positions 803 to 825. Primers used for bacterial 16S rRNA gene and 16S rcDNA amplification from environmental DNA or RNA are given by Schwieger and Tebbe (34). Primer set Com 1 (5⬘-CAGCAGCCGCGGTAATAC-3⬘) and phosphorylated Com 2ph (5⬘CCGTCAATTCCTTTGAGTTT-3⬘) amplify positions 519 to 926 of the E. coli 16S rRNA gene. 16S rcDNA generation. To retrieve 16S rcDNA, 30 ng of template RNA was reverse transcribed at 50°C with the Thermoscript reverse-transcription (RT)PCR system (Invitrogen) and the universal reverse primer 1492R (5⬘-GGTTA CCTTGTTACGACTT-3⬘) (20), according to the manufacturer’s instructions. In each reverse transcription reaction mixture, some RNA samples were not supplemented with reverse transcriptase to rule out DNA contamination. Relative quantification protocol without a preamplification step. A RotorGene real-time cycler (Corbett Research), the Brilliant SybrGreen Q-PCR master mix (Stratagene), and nucleic acids isolated from Baltic seawater experiment (Bx) enrichments most likely containing large amounts of the target species were used for the establishment of Q-PCR and quantitative RT-PCR (Q-RT-PCR) protocols. Prior quantifications, minimum Com and OST primer concentrations (in a range from 50 to 900 nM for each primer), and optimal template concentrations were determined. For optimal primer binding, a temperature of 59°C was determined, where no binding to the sequence of the most closely related bacterium which could be cultured, i.e., T. denitrificans, occurred (Fig. 1). The optimized PCR mixtures (25 l) contained 1⫻ Brilliant SybrGreen Q-PCR master mix (Stratagene), the Com (a 900 nM concentration of each primer) or OST 1 (OST 1F, 900 nM; OST 1R, 300 nM) primer system, and 2 to 4 ng of nucleic acids extracted from the Bx enrichments. An initial denaturing step at 95°C for 15 min was followed by 40 cycles of 94°C for 30 s, 59°C for 40 s, and 72°C (a measuring step) for 50 s. Potential development of primer dimers was determined by a melting-point analysis in a range from 40 to 94°C. Each measurement was performed multiple times (at least three replicates). Relative quantification protocol including a preamplification step. Four nanograms of generated 16S rcDNA or 2 to 4 ng of chromosomal DNA was preamplified according to the method of Teo et al. (38), using the universal primer 1492R and the Bacteria-specific forward primer 27F (5⬘-AGAGTTTGATCCTG GCTCAG-3⬘) (20). PCR mixtures contained 1⫻ PCR buffer, a 200 M concentration of each deoxynucleoside triphosphate, 150 nM concentrations of the forward and reverse primers, and 0.025 U of Hot Star Taq (Qiagen)/l. An iCycler (Bio-Rad) was used to incubate reaction mixtures through an initial denaturation at 95°C for 15 min, followed by 16 cycles of 94°C for 1 min, 55°C for 1 min, and 72°C for 2 min. Additional Q-PCR and Q-RT-PCR protocols are as described above. In order to check the comparability of the two protocols, Bx enrichments were quantified with and without preamplification steps. Real-time data analysis. Relative standards were prepared using serially diluted (1:10) nucleic acids isolated from exactly the same DNA or RNA extract. Each sample measured was calibrated by its own respective Com and OST
QUANTIFICATION OF UNCULTURED BACTERIA
4973
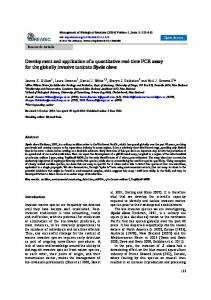
standards. Due to potentially lower PCR efficiencies of nondiluted DNA or cDNA extracts, each sample to be measured was always diluted 1:10. Calibration curves were generated by Rotor-Gene software version 4.6. For each standard, the concentration was plotted against the cycle number at which the fluorescence signal increased above the background or cycle threshold (CT value). The slope of each calibration curve was incorporated into the following equation to determine the reaction efficiency: efficiency ⫽ 10(⫺1/slope) ⫺ 1. According to this formula, an efficiency of 1 means a doubling of product in each cycle. Only data resulting from measurements with comparable Com- and OST-specific PCR efficiencies were used for further calculations. Calculation of numbers of T. denitrificans-like cells and 16S rRNA molecules. In order to calculate numbers of T. denitrificans-like cells, total cell numbers were used and the Com product/OST product ratios were obtained from relative 16S rRNA gene quantifications, assuming that all cell counts represented bacteria. As with the calculation of T. denitrificans-like 16S rRNA molecule numbers, total 16S rRNA molecule numbers were used and the Com product/OST product ratios were obtained from relative 16S rcDNA quantification analyses. Total 16S rRNA molecule numbers were calculated as follows. Total RNA was quantified as described above. The RNA extraction efficiency of our phenol extraction protocol has been demonstrated to range from 52 to 66% and to be relatively constant for gram-negative bacteria (43). Therefore, we used a 60% extraction efficiency to calculate the real amount of total RNA based on the fluorescence measured. Neglecting tRNA and mRNA, which are minor components of the total RNA pool, the 23S and 16S rRNAs are present in a ratio of 2:1. Consequently, 16S rRNA quantities are just one-third of the total rRNA contents. Calculations for conversions between the mass and the number of copies of a 1,542-bp 16S rRNA were performed as follows (PCR Application Manual, 2nd ed., online version, Roche Molecular Biochemicals, Mannheim, Germany). To calculate molecular mass, the following formula was used: 1,542 bp ⫻ 340 Da/bp ⫽ 524,280 Da ⫽ 5.24 ⫻ 105 Da. To calculate the number of picomoles per microgram, we used the formula 106 pg/g ⫻ [1 pmol/(5.24 ⫻ 105 pg)] ⫽ 1.91 pmol/g. To calculate the number of molecules per microgram, we used the formula [(6.022 ⫻ 1011 molecules)/pmol] ⫻ 1.91 pmol/g ⫽ 1.15 ⫻ 1012 molecules/g ⫽ 1.15 ⫻ 109 molecules/ng. Evaluation of Q-PCR and Q-RT-PCR. In order to evaluate the quality of our quantification protocols, the number of ribosomes per T. denitrificans-like bacterial cell was calculated and compared to literature data. Calculations were based on respective 16S rRNA molecule numbers divided by the specific numbers of T. denitrificans-like bacterial cells. A flow diagram, comprising the several steps, analyses, and calculations for the assessment of the copy numbers for 16S rRNA molecules and genes as well as the numbers of ribosomes per cell, is given in Fig. 2. Statistical analysis. In order to test whether there was a significant difference (P ⬍ 0.05) between results obtained by quantifications with and without preamplification, the Student t test was performed.
RESULTS Environmental 16S rRNA content and total cell counts. Environmental 16S rRNA content ranged from 0.04 to 1.41 ng ml of seawater⫺1, corresponding to 4.65 ⫻ 107 to 1.62 ⫻ 109 16S rRNA molecules ml⫺1 (Table 1). The highest 16S rRNA content was observed in the photic zone (5 m). In enrichments, after 44 h (Bx21 and Bx23) or 88 h (Bx24) of incubation, 16S rRNA contents ranged from 3.23 to 7.74 ng ml⫺1, corresponding to 3.71 ⫻ 109 to 8.90 ⫻ 109 16S rRNA molecules ml⫺1 (Table 1). Total cell counts in the water column ranged from 0.27 ⫻ 106 to 2.15 ⫻ 106 cells ml⫺1, with highest numbers occurring in the upper 30 m (Table 1). Total cell counts in enrichments ranged from 1.66 ⫻ 106 to 4.43 ⫻ 106 cells ml⫺1. Establishment of Q-PCR and Q-RT-PCR assays. Using nucleic acids extracted from the Bx enrichments, quantification of T. denitrificans-like 16S rRNA molecules as well as 16S rRNA genes was successful without a preamplification step in a range from 8 to 50% relative abundance (Table 1). With 16S rRNA genes, the average PCR efficiency was slightly above 1 for the Com and the OST primer systems, respectively (Table 2). Similarly, with 16S rRNA, the average PCR efficiency was 0.8 for
4974
LABRENZ ET AL.
APPL. ENVIRON. MICROBIOL.
FIG. 2. Flow diagram of the culture-independent approach to assess the abundance of T. denitrificans-like bacteria. Solid lines depict those characteristics which have to be measured for our quantification approach. Dotted lines depict characteristics which have to be calculated in order to estimate the numbers of T. denitrificans-like cells, 16S rRNA molecules, and ribosomes. Detailed calculations are given in Materials and Methods.
the Com as well as the OST primer system. However, this protocol was not transferable to environmental samples, where the T. denitrificans-like organism was probably present in smaller amounts. Despite the fact that melting-curve temperatures indicated satisfactory amplification products for the bacterial
primer system, environmental 16S rRNA and 16S rRNA genes used as templates for real-time PCR sometimes resulted in impossible PCR efficiencies for the bacterial primer system or no amplification with the OST primer system (Fig. 3). Thus, our quantification protocol was further developed, resulting in a nested-PCR approach. Preamplification of 16S rRNA genes or 16S rcDNA with the 27F-1492R primer system before RT analyses with the Com and OST primer systems increased the molecule copy number 3.5 ⫻ 104-fold and resulted in improved PCR efficiencies for the Com as well as the OST primer system (Table 2). Moreover, Q-PCR and Q-RT-PCR was successfully applied to most of the environmental samples (Table 1). Regarding 16S rRNA analyses, the linearity of Com and OST amplification was given from quantities of 7.8 ⫻ 1010 to 1.7 ⫻ 103 molecules (Fig. 4), with a correlation coefficient of 0.999. An upper quantification limit could not be evaluated. A comparison of the specific abundances obtained by real-time PCR without a preamplification step and those from analyses including a preamplification step is demonstrated in Fig. 5. Statistically, there was no evidence for a significant variation between results gained by both quantification procedures (Student’s t test; P ⬍ 0.05). Quantification of T. denitrificans-like bacteria after preamplification. Quantification of T. denitrificans-like 16S rRNA molecules was successful in a range from 7.1 ⫻ 103 to 4.4 ⫻ 109 copies per ml or 0.002 to 49.7% relative abundance. Quantification of T. denitrificans-like 16S rRNA genes was successful in a range from 9.0 ⫻ 101 to 2.2 ⫻106 copies ml⫺1 or 0.01 to 49.7% relative abundance (Table 1). The estimated number of ribosomes per environmental T. denitrificans-like cell ranged from 20 to 200 (mean value, 100 ⫾ 70) and increased during enrichments up to 2,000. This result demonstrated a 16- to 100-fold increase in comparison to levels in the seawater sample with which the enrichment was started (Table 1). OST products melted specifically at 77.3 to 77.4°C, and Com products melted at 82.7 to 82.8°C (Table 2). Other properties of the primer sets used for Q-PCR protocols with and without preamplification are also shown in Table 2. DISCUSSION Applicability of the approach. Our approach, combining total cell counts, environmental RNA content, and real-time
TABLE 2. Properties of PCR and RT-PCR and the different primer sets used for Q-PCR protocolsa Target and primers
Reaction efficiency
Correlation coefficient of regression line
Melting temp (°C)
Detection limit of T. denitrificans-like nucleic acids ml⫺1b
Before
After
Before
After
Before
After
Before
After
16S rRNA gene Com OST
1.02 ⫾ 0.02 1.04 ⫾ 0.15
0.99 ⫾ 0.06 0.97 ⫾ 0.09
1.000 ⫾ 0.000 0.996 ⫾ 0.003
0.999 ⫾ 0.001 1.000 ⫾ 0.000
83.87 ⫾ 0.16 77.47 ⫾ 0.14
82.73 ⫾ 0.36 77.44 ⫾ 0.15
1.4 ⫻ 103
0.2
16S rRNA Com OST
0.81 ⫾ 0.07 0.84 ⫾ 0.07
0.88 ⫾ 0.08 0.89 ⫾ 0.08
0.999 ⫾ 0.001 0.998 ⫾ 0.001
0.998 ⫾ 0.002 0.998 ⫾ 0.002
82.52 ⫾ 0.26 77.38 ⫾ 0.15
82.83 ⫾ 0.33 77.40 ⫾ 0.17
7.4 ⫻ 104
a
20
Before, results without a preamplification step, using nucleic acids extracted from Bx enrichments; after, results with a preamplification step. Mean values of three or more determinations ⫾ standard deviations are given. b Values are numbers of copies.
VOL. 70, 2004
QUANTIFICATION OF UNCULTURED BACTERIA
4975
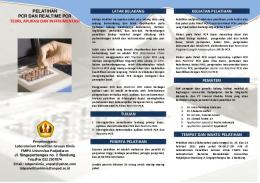
FIG. 3. Insufficient quantification of bacterial 16S rRNA genes from sample G6 (depth, 120 m) by real-time PCR (without preamplification). (A) Environmental DNA was used as the template in quantities of 6.1 ⫻ 105 to 6.1 ⫻ 102 bacterial chromosomes for the Com primer set, representing CT values ranging from 20.6.0 to 25.1. Specific PCR products did not appear when environmental DNA was used as the template for the OST primer set. DNA contamination represented CT values ranging from 30.4 to 33.6. Norm. Fluoro., normalized fluorescence. (B) Relation between the CT and the apparent amount of 16S rRNA gene molecules by SybrGreen real-time PCR. Each point represents an amount of 16S rRNA gene molecules corresponding to the CT value with the Com primer set. Values for standard molecules are represented as blue points, and those for samples are shown as red points. The correlation coefficient of the regression line was 0.999. PCR efficiency was 1.78. (C) Melting-curve analysis of online PCR signals. Peak a shows DNA contaminants melting at 72.0 to 73.0°C; peak b shows Com products melting at 81.5 to 82.0°C. deg., degrees.
PCR for the quantification of bacteria from the central Baltic Sea, was successfully applied for an uncultured epsilonproteobacterium related to T. denitrificans. It was applicable to enrichments as well as to oligotrophic seawater samples. The real-time PCR had at least a 5-log dynamic range of detection with the OST as well as the Com primer set. This detection range has already been observed by others (11). However, sometimes the bacterial 16S rRNA gene real-time PCR assay
was only log linear over 4 orders of magnitude. This finding accords with the data of Harms et al. (13), who found that results of the bacterial 16S rRNA gene real-time PCR assay were log linear over 4 orders of magnitude with DNA standards but that results with Nitrospira 16S rRNA genes, ammonia-oxidizing bacterium 16S rRNA genes, and Nitrosomonas oligotropha-like amoA genes were log linear over 6 orders of magnitude. This difference is probably due to the fact that
4976
LABRENZ ET AL.
APPL. ENVIRON. MICROBIOL.
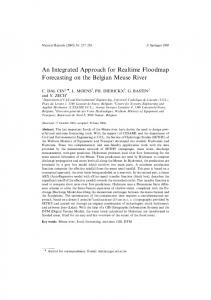
FIG. 4. Detection limits of environmental T. denitrificans-like 16S rRNA in sample G3 (50-m depth) from the Baltic Sea by real-time PCR. (A) Sensitivity of the Com and OST primer sets in quantifying T. denitrificans-like 16S rRNA. After RT-PCR with primer 1492R and preamplification with primers 27F and 1492R, 16S rcDNA was used as the template in quantities of 7.8 ⫻ 1010 to 7.8 ⫻ 107 molecules for the Com primer set and 1.7 ⫻ 107 to 1.7 ⫻ 103 molecules for the OST primer set (values shown in italics), representing CT values ranging from 3.0 to 32.2. Norm. Fluoro., normal fluorescence. (B) Relation between the CT and the apparent amount of 16S rcDNA molecules obtained with SybrGreen real-time PCR. Each point represents an amount of 16S rcDNA molecules corresponding to the CT value with the Com and OST primer sets. The correlation coefficient of the regression line was 0.999. The PCR efficiency was 0.82.
primer systems of higher specificity are less sensitive to bacterial contamination. However, linear results over 7 orders of magnitude (from 7.5 ng down to 7.5 fg) have also been reported for a SybrGreen assay, a 5⬘-exonuclease assay, and a fluorescence resonance energy transfer assay used to detect Brucella abortus (27). Sensitivity and detection limits. Contaminant genomic DNA is usually present in polymerase preparations and may lead to significant fluorescence in the no-template controls after about 35 cycles (1). In our experiments, this was indeed observed with the Com primer system, mostly with E. coli K-12 as a contaminant (data not shown), but usually not with the
OST primer set (data not shown). This may be due to the high specificity of the T. denitrificans-like primers employed. In an attempt to overcome the contamination problem, Corless et al. (6) applied several treatments, such as UV light, DNase I enzyme treatment, or restriction endonuclease digestion, but all treatments were accompanied with an associated decrease in sensitivity. In order to increase sensitivity, we applied the preamplification approach, which enriched the target for nested Q-PCR by more than 4 orders of magnitude. This approach resulted in an observable PCR product, but it must be noted that the additional PCR step may also increase the PCR biases. Furthermore, it should also be noted that our
VOL. 70, 2004
FIG. 5. Mean values of T. denitrificans-like 16S rRNA fractions (percent relative abundance) achieved from quantifications without (lane 1) and with (lane 2) a preamplification step. (A) Enrichment Bx21. The Student t test (P ⬍ 0.05) showed no evidence for a significant variation between results gained by using both quantification protocols (P value, 0.96; n ⫽ 15; degrees of freedom, 13). (B) Enrichment Bx24. The Student t test (P ⬍ 0.05) showed no evidence for a significant variation between results gained by both quantifications protocols (P value, 0.83; n ⫽ 8; degrees of freedom, 6).
enrichments consisting of at least 8% target DNA or RNA were successfully quantified without preamplification. However, quantification of these enrichments using a preamplification step did not yield significantly different results (Fig. 5), and community fingerprints with and without preamplification were also found to be highly similar (data not shown). Rodrigues et al. found that real-time PCR has a 6-log dynamic range of detection for DNA from pure cultures (102 to 107 cells ml⫺1) but that it is less sensitive with soil samples (31). Moreover, their experiments suggested that the type of target gene sequence can also be an important factor in detection. They found different standard curves for the fcb-targeted gene and the 16S rRNA-targeted gene. Other factors affecting detection limits in PCR-based methods included the type and composition of the sample matrix, the type of target organism, the number and diversity of bacteria in the sample, the Taq polymerase used, and the DNA extraction protocol (22, 31). However, Teo et al. (38) suggested that a nested-PCR approach using a combination of cycle-limited conventional PCR and Q-PCR enables the detection of low-copy-number target DNA when it is present in a high background of nontarget DNA. In results similar to ours (Table 2), they found that the relative amplification efficiency of a nested-PCR approach equals that obtained with the target DNA and quantification standards. However, their experiments were based on human immunodeficiency virus type 1 DNA, and environmental samples can have high levels of chemical and genetic complexity not encountered in tissue or pure cultures (36). In general, detection limits for quantification by PCR range between 10 and 200 copies per reaction. For example, Baldwin et al. (2) detected aromatic oxygenase genes down to a detection limit of 200
QUANTIFICATION OF UNCULTURED BACTERIA
4977
copies with a SybrGreen assay, and Kolb et al. (19) detected 10 to 100 copies of the pmoA gene from methanotrophs in soil. However, quantification of DNA extracts from pure cultures of S. aureus in a LightCycler system using SybrGreen proved to be less sensitive (60 nuc gene copies/l) than using a fluorigenic TaqMan probe (6 nuc gene copies/l) (15). Considering the sample dilutions as well as preamplification, detection limits of our approach were much lower, being 20 copies for RNA and 0.2 copy for DNA ml of seawater⫺1 (Table 2). PCR efficiencies. Another source of error which may be encountered is varied PCR efficiencies. A perfect amplification, in which each target sequence is replicated during every cycle, would have an efficiency of 1.0. Bach et al. (1) detected correlations between fluorescence and starting copy number for three peptidase gene classes of the same high quality independently of a SybrGreen or a TaqMan assay. However, the PCR efficiencies of a SybrGreen assay, a 5⬘-exonuclease assay, and a fluorescence resonance energy transfer assay have been compared by Newby et al. (27). They found that the SybrGreen assay usually showed lower efficiencies, which was explained by the presence of the intercalating dye that can be inhibitory to PCR (46). Comparing PCR efficiencies for the fcb-targeted gene with those for the 16S rRNA-targeted gene, Rodrigues et al. (31) suggested that the target sequence can also be an important factor resulting in different efficiencies. In our studies, various PCR efficiencies were also detected (Table 2). To overcome this problem, each measurement was verified and standardized by its own domain-specific as well as T. denitrificans-like-organism-specific standardization derived from a dilution series of a corresponding environmental target 16S rcDNA or 16S rRNA gene; i.e., each sample had its own set of standards and dilution series. Conversion of numbers of gene copies to specific cell numbers. Some general aspects regarding quantification by realtime PCR must be taken into consideration. The final determination of bacterial load by real-time PCR in a multispecies community will be influenced by the variation in the number of rRNA operons in a given species (7). Further, the number of replication forks is directly related to the generation time, which in turn depends on the metabolic status of the bacteria at the time of sampling (17). Not knowing the exact number of copies of 16S rRNA operons in a given target species at the time of sampling represents a limitation to the assessment of bacterial numbers by real-time PCR based on the 16S rRNA gene (25). Thus, a DNA standard representing those bacteria most likely to predominate in any given habitat is important for a more accurate determination of the total bacterial load. For this reason, our external relative standardizations were specifically prepared for every sample quantified and solely based on its respective original community DNA or RNA, and they were as close to natural conditions as possible. Moreover, our approach combining different methods still allowed an estimation of numbers of taxon-specific cells and 16S rRNA molecules. Assessment of the number of ribosomes as an indicator of cell activity. In general, the number of ribosomes per cell is considered to be a measure of the protein-synthesizing capacity of the cell and its growth potential or growth rate. Thus, the number of ribosomes per T. denitrificans-like cell was calculated to verify our quantifications. Calculation uncertainties because of various operon numbers or replication forks have
4978
LABRENZ ET AL.
already been discussed above. An average 16S rRNA gene copy number per cell of 2.3 is assumed for “Epsilonproteobacteria” (18). The average 16S rRNA gene copy number of our investigated microbial community is unknown. However, in comparison to other data, our calculations may support our quantification assay: E. coli, growing at a maximal growth rate under laboratory conditions, can contain up to 72,000 ribosomes per cell (8). Dependent on its activity level, the marine oligotrophic ultramicrobacterium Sphingomonas sp. strain RB2256 contained 200 to 2,000 ribosomes per cell (8). Investigating bacteria from four permanently cold marine stations, Sahm and Berninger (32) calculated numbers of 350 to 1,300 ribosomes per bacterial cell. Depending on the activity level, the number of ribosomes per T. denitrificans-like cell (⫾ the standard deviation) ranged from 100 (⫾70) to 1,500 (⫾500). This appears to be reasonable for a marine taxon. These results indicate that our real-time PCR approach can be used for the assessment of both specific and relative abundances of uncultured marine bacteria. ACKNOWLEDGMENTS The technical assistance of Claudia Ho ¨ltje is greatly appreciated. This work was supported by funds from the European Commission for the AQUA-CHIP project (QLK4-2000-00764). We are solely responsible for the content of this publication. It does not represent the opinion of the European Commission. The European Commission is not responsible for any use that might be made of data appearing therein. REFERENCES 1. Bach, H. J., J. Tomanova, M. Schloter, and J. C. Munch. 2002. Enumeration of total bacteria with genes for proteolytic activity in pure cultures and in environmental samples by quantitative PCR mediated amplification. J. Microbiol. Methods 49:235–245. 2. Baldwin, B. R., C. H. Nakatsu, and L. Nies. 2003. Detection and enumeration of aromatic oxygenase genes by multiplex and real-time PCR. Appl. Environ. Microbiol. 69:3350–3358. 3. Brettar, I., and G. Rheinheimer. 1991. Denitrification in the Central Baltic: evidence for H2S-oxidation as motor of denitrification at the oxic-anoxic interface. Mar. Ecol. Prog. Ser. 77:157–169. 4. Brettar, I., and G. Rheinheimer. 1992. Influence of carbon availability on denitrification in the central Baltic Sea. Limnol. Oceanogr. 37:1146–1163. 5. Cavicchioli, R., M. Ostrowski, F. Fegatella, A. Goodchild, and N. GuixaBoixereu. 2003. Life under nutrient limitation in oligotrophic marine environments: an eco/physiological perspective of Sphingopyxis alaskensis (formerly Sphingomonas alaskensis). Microb. Ecol. 45:203–217. 6. Corless, C. E., M. Guiver, R. Borrow, V. Edwards-Jones, E. B. Kaczmarski, and A. J. Fox. 2000. Contamination and sensitivity issues with a real-time universal 16S rRNA PCR. J. Clin. Microbiol. 38:1747–1752. 7. Farrelly, V., F. A. Rainey, and E. Stackebrandt. 1995. Effect of genome size and rrn gene copy number on PCR amplification of 16S rRNA genes from a mixture of bacterial species. Appl. Environ. Microbiol. 61:2798–2801. 8. Fegatella, F., J. Lim, S. Kjelleberg, and R. Cavicchioli. 1998. Implications of rRNA operon copy number and ribosome content in the marine oligotrophic ultramicrobacterium Sphingomonas sp. strain RB2256. Appl. Environ. Microbiol. 64:4433–4438. 9. Filion, M., M. St. Arnaud, and S. H. Jabaji-Hare. 2003. Direct quantification of fungal DNA from soil substrate using real-time PCR. J. Microbiol. Methods 53:67–76. 10. Grasshoff, K., M. Ehrhardt, and K. Kremling. 1983. Methods of sea water analysis, 2nd ed. Verlag Chemie, Weinheim, Germany. 11. Gruber, F., F. G. Falkner, F. Dorner, and T. Ha ¨mmerle. 2001. Quantitation of viral DNA by real-time PCR applying duplex amplification, internal standardization, and two-color fluorescence detection. Appl. Environ. Microbiol. 67:2837–2839. 12. Gru ¨ntzig, V., S. C. Nold, J. Zhou, and J. M. Tiedje. 2001. Pseudomonas stutzeri nitrite reductase gene abundance in environmental samples measured by real-time PCR. Appl. Environ. Microbiol. 67:760–768. 13. Harms, G., A. C. Layton, H. M. Dionisi, I. R. Gregory, V. M. Garrett, S. A. Hawkins, K. G. Robinson, and G. S. Sayler. 2003. Real-time PCR quantification of nitrifying bacteria in a municipal wastewater treatment plant. Environ. Sci. Technol. 37:343–351.
APPL. ENVIRON. MICROBIOL. 14. Head, I. M., J. R. Saunders, and R. W. Pickup. 1998. Microbial evolution, diversity, and ecology: a decade of ribosomal RNA analysis of uncultivated microorganisms. Microb. Ecol. 35:1–21. 15. Hein, I., A. Lehner, P. Rieck, K. Klein, E. Brandl, and M. Wagner. 2001. Comparison of different approaches to quantify Staphylococcus aureus cells by real-time quantitative PCR and application of this technique for examination of cheese. Appl. Environ. Microbiol. 67:3122–3126. 16. Ho ¨fle, M. G. 1992. Bacterioplankton community structure and dynamics after large-scale release of nonindigenous bacteria as revealed by low-molecular-weight RNA analysis. Appl. Environ. Microbiol. 58:3387–3394. 17. Klappenbach, J. A., J. M. Dunbar, and T. M. Schmidt. 2000. rRNA operon copy number reflects ecological strategies of bacteria. Appl. Environ. Microbiol. 66:1328–1333. 18. Klappenbach, J. A., P. R. Saxman, J. R. Cole, and T. M. Schmidt. 2001. rrndb: the ribosomal RNA operon copy number database. Nucleic Acids Res. 29:181–184. 19. Kolb, S., C. Knief, S. Stubner, and R. Conrad. 2003. Quantitative detection of methanotrophs in soil by novel pmoA-targeted real-time PCR assays. Appl. Environ. Microbiol. 69:2423–2429. 20. Lane, D. J. 1991. 16S/23S rRNA sequencing, p. 115–175. In E. Stackebrandt and M. Goodfellow (ed.), Nucleic acid techniques in bacterial systematics. John Wiley & Sons, Chichester, United Kingdom. 21. Lockey, C., E. Otto, and Z. Long. 1998. Real-time fluorescence detection of a single DNA molecule. BioTechniques 24:744–746. 22. Lo ¨ffler, F. E., Q. Sun, J. Li, and J. M. Tiedje. 2000. 16S rRNA gene-based detection of tetrachloroethene-dechlorinating Desulforomonas and Dehalococcoides species. Appl. Environ. Microbiol. 66:1369–1374. 23. Logan, J. M. J., K. J. Edwards, N. A. Saunders, and J. Stanley. 2001. Rapid identification of Campylobacter spp. by melting peak analysis of biprobes in real-time PCR. J. Clin. Microbiol. 39:2227–2232. 24. Makino, S.-I., and H.-I. Cheun. 2003. Application of real-time PCR for the detection of airborne microbial pathogens in reference to the anthrax spores. J. Microbiol. Methods 53:141–147. 25. Nadkarni, M. A., F. E. Martin, N. A. Jacques, and N. Hunter. 2002. Determination of bacterial load by real-time PCR using a broad-range (universal) probe and primer sets. Microbiology 148:257–266. 26. Neretin, L. N., A. Schippers, A. Pernthaler, K. Hamann, R. Amann, and B. B. Jørgensen. 2003. Quantification of dissimilatory (bi)sulphite reductase gene expression in Desulfobacterium autotrophicum using real-time RT-PCR. Environ. Microbiol. 5:660–671. 27. Newby, D. T., T. L. Hadfield, and F. F. Roberto. 2003. Real-time PCR detection of Brucella abortus: a comparative study of SYBR Green I, 5⬘exonuclease, and hybridization probe assays. Appl. Environ. Microbiol. 69: 4753–4759. 28. Pfaffl, M. W., and M. Hageleit. 2001. Validities of mRNA quantification using recombinant RNA and recombinant DNA external calibration curves in real-time RT-PCR. Biotechnol. Lett. 23:275–282. 29. Po ¨hler, I., D. F. Wenderoth, K. Wendt-Potthoff, and M. G. Ho¨fle. 2002. Bacterioplankton community structure and dynamics in enclosures during bio-remediation experiments in an acid mining lake. Water Air Soil Pollut. Focus 2:111–121. 30. Qi, Y., G. Patra, X. Liang, L. E. Williams, S. Rose, R. J. Redkar, and V. G. Delvecchio. 2001. Utilization of the rpoB gene as a specific chromosomal marker for real-time PCR detection of Bacillus anthracis. Appl. Environ. Microbiol. 67:3720–3727. 31. Rodrigues, J. L. M., M. R. Aiello, J. W. Urbance, T. V. Tsoi, and J. M. Tiedje. 2002. Use of both 16S rRNA and engineered functional genes with real-time PCR to quantify an engineered, PCB-degrading Rhodococcus in soil. J. Microbiol. Methods 51:181–189. 32. Sahm, K., and U.-G. Berninger. 1998. Abundance, vertical distribution, and community structure of benthic prokaryotes from permanently cold marine sediments (Svalbard, Arctic Ocean). Mar. Ecol. Prog. Ser. 165:71–80. 33. Schut, F. 1993. Ecophysiology of a marine ultramicrobacterium. Thesis. University of Groningen, Groningen, The Netherlands. 34. Schwieger, F., and C. Tebbe. 1998. A new approach to utilize PCR–singlestrand conformation polymorphism for 16S rRNA gene-based microbial community analysis. Appl. Environ. Microbiol. 64:4870–4876. 35. Stubner, S. 2002. Enumeration of 16S rDNA of Desulfotomaculum lineage 1 in rice field soil by real-time PCR with SybrGreenTM detection. J. Microbiol. Methods 50:155–164. 36. Stults, J. R., O. Snoeyenbos-West, B. Methe, D. R. Lovley, and D. P. Chandler. 2001. Application of the 5⬘ fluorogenic exonuclease assay (TaqMan) for quantitative ribosomal DNA and rRNA analysis in sediments. Appl. Environ. Microbiol. 67:2781–2789. 37. Suzuki, M. T., L. T. Taylor, and E. F. DeLong. 2000. Quantitative analysis of small-subunit rRNA genes in mixed microbial populations via 5⬘-nuclease assays. Appl. Environ. Microbiol. 66:4605–4614. 38. Teo, I. A., J. W. Choi, J. Morlese, G. Taylor, and S. Shaunak. 2002. LightCycler qPCR optimisation for low copy number target DNA. J. Immunol. Methods 270:119–133. 39. van Kuppefeld, F. J. M., J. T. M. van der Logt, A. F. Angulo, M. J. van Zoest, W. G. V. Quint, H. G. M. Niesters, J. M. D. Galama, and W. J. G. Melchers.
VOL. 70, 2004
40. 41. 42.
43.
1992. Genus- and species-specific identification of mycoplasmas by 16S rRNA amplification. Appl. Environ. Microbiol. 58:2606–2615. Walker, N. J. 2002. A technique whose time has come. Science 296:557–559. Warwik, B., J. H. Paul, and F. R. Tabita. 2002. Real-time PCR quantification of rbcl (ribulose-1,5-bisphosphate carboxylase/oxygenase) mRNA in diatoms and pelagophytes. Appl. Environ. Microbiol. 68:3771–3779. Weinbauer, M. G., and M. G. Ho ¨fle. 2001. Quantification of nucleic acids from aquatic environments by using green fluorescent dyes and microtiter plates, p. 2.1.3/1–2.1.3/10. In A. D. L. Akkermans, J. D. van Elsas, and F. J. de Bruijn (ed.), Molecular microbial ecology manual. Kluwer Academic Publishers, Dordrecht, The Netherlands. Weinbauer, M. G., I. Fritz, D. F. Wenderoth, and M. G. Ho ¨fle. 2002. Simul-
QUANTIFICATION OF UNCULTURED BACTERIA
4979
taneous extraction of total RNA and DNA from bacterioplankton suitable for quantitative structure and function analyses. Appl. Environ. Microbiol. 68:1082–1087. 44. Weinbauer, M. G., I. Brettar, and M. G. Ho ¨fle. 2003. Viral infection and lysogeny of bacterioplankton in surface, deep and anoxic marine waters. Limnol. Oceanogr. 44:1457–1465. 45. Wellinghausen, N., C. Frost, and R. Marre. 2001. Detection of legionellae in hospital water samples by quantitative real-time LightCycler PCR. Appl. Environ. Microbiol. 67:3985–3993. 46. Wittwer, C. R., M. G. Herrmann, A. A. Moss, and R. P. Rasmussen. 1997. Continuous fluorescence monitoring of rapid cycle DNA amplification. BioTechiques 22:130–139.