2nd SWITCH Scientific Meeting Dan Panorama Hotel, Tel-Aviv, Israel 25 - 29 November 2007
Development and application of a systematic approach for prioritising the risk of failure of stormwater control strategies within selected SWITCH demonstration cities L Scholes, DM Revitt* and JB Ellis Urban Pollution Research Centre Middlesex University, UK
Abstract
A key objective of SWITCH is to support Learning Alliances (LAs) in the development of integrated urban water management strategies. Theme 2 of the SWITCH project is focused around sustainable stormwater management and its interactions with other sectors of the urban water cycle (e.g. water supply, eco-sanitation and urban agriculture) with a particular emphasis on achieving a paradigm shift whereby stormwater is regarded as a resource rather than a wastewater. The development of a sustainable urban water management strategy is recognised as a complex challenge, not least because it should consider both current as well as the future needs and challenges posed by the ‘city of the future’. To support LAs in tackling this challenge, representatives of LAs in Accra, Birmingham, Belo Horizonte and Hamburg were involved in discussions directed at the identification of city-specific threats and uncertainties which may result in the failure of their existing stormwater management strategies over both the short-term (time period of 5-10 years) and the long-term (time period of 25-30 years). Following collection of this data, a procedure has been proposed for assessing the consequences (severity) of an identified threat occurring together with an identification of its likelihood (probability) of occurrence (i.e. the translation of hazard into risk). To facilitate the involvement of LAs in this process, a series of guidelines have been developed to support the consistent assessment of risks through the adoption of a risk-rating approach. This procedure involves the development of ‘risk scores’ which can be utilised to prioritise, or rank, identified risks, thus providing a framework for the further consideration of how such risks may be managed within the development of long-term planning policies. This paper presents the theoretical elements behind the risk-rating methodology, which has been developed and describes the approach taken with regard to ‘benchmarking’ the concepts of severity and probability in relation to stormwater control in densely urbanised areas and by specific reference to the Belo Horizonte and Birmingham demonstration cities. Keywords: Learning Alliance, risk assessment and prioritisation, risk indicators, stormwater management, system failure.
1
Introduction
Within the wider context of developing an integrated sustainable urban water management plan, several of the SWITCH Learning Alliances (LAs) have identified research needs in relation to
* Corresponding Author:
[email protected]
Scholes et al.
stormwater management (e.g. Nascimento et al., 2006). To more clearly identify city-specific needs and to better support LAs in developing local solutions which meet their requirements, the current stormwater management strategies in selected demonstration cities were documented (see Ellis et al., 2007a) and LA representatives asked to identify ‘threats and uncertainties’ which could result in potential vulnerability and failure of their current stormwater management systems. This work was carried out with LAs in Belo Horizonte (Brazil), Birmingham (UK) and Hamburg (Germany), and also, to a lesser extent, in Accra (Ghana). In this context, system failure generally refers to a particular component or aspect either not performing or not having the outcome which was intended. However, system failure can also be interpreted in a broader sense as the progressive development and identification of defects and deficiencies (or threats) rather than a single catastrophic failure, although both types of system failure might occur in relation to, for example, an identified uncertainty such as the impacts of climate change. Threats can therefore be regarded as events, processes, properties, activities or actions that can lead to or exploit a vulnerability (weakness or hazard), such that they can undermine the performance integrity of a stormwater management asset, system component or strategy. Generation of information on these ‘threats and uncertainties’ resulted in the development of a series of city-specific tables listing a wide range of engineering, scientific, environmental, hydrological, social, planning and financial aspects identified by the LAs as having the potential to result in the failure of current stormwater management systems. Table 1 presents extracts from the Belo Horizonte threats and uncertainty table, as an example of the type of information developed by LAs. These threats constitute risks in terms of the achievement of sustainable management and targeted environmental objectives for the ‘city of the future’. Table 1 Example of threats and uncertainties identified by the Belo Horizonte LA Threat
Event
Comments
Means to handle risk, mitigate impacts
Flooding
Significant changes or increases in the occurrence of floods and flood damage
Emergency plans exist but there is need for further developments with respect to the planning of prevention and mitigation measures. Difficulties persist in handling urbanisation particularly the spread of informal settlements.
Pollution of receiving waters by wet weather diffuse pollution
No significant changes or an increases in wet weather diffuse pollution
Main causes: increase in imperviousness due to urbanisation, lack of investment in present stormwater sewerage system, new legal and illegal developments in flood prone areas, lack of maintenance, outdated technology, climate change impacts Main causes: increase in imperviousness due to urbanisation, lack of maintenance, failures in other sanitation sectors and solid waste management, outdated technology
High pollution of receiving waters by wastewater flows masks effects of diffuse pollution. Difficulties in controlling illicit solid waste disposal on land and direct to water bodies.
Having identified the prime threats, one approach to utilising this information is to further assess these threats/uncertainties (either quantitatively or qualitatively), enabling LAs to identify and prioritise risks over both current and long-term time frames. The need to consider the performance of management strategies over varying time-scales is considered to be a fundamental aspect of sustainable development, and therefore a crucial consideration in the development of a sustainable stormwater management plan. This paper outlines the development of guidelines to support LAs in implementing this next stage through the application of a systematic risk assessment approach which incorporates risk identification and risk prioritisation stages. The objective is to provide a robust and transparent knowledge base for a subsequent risk management phase where LAs can discuss and debate whether or not identified risks are acceptable and, if not, how they can be reduced, contained or managed.
2nd SWITCH Scientific Meeting, Israel, 2007 Nov.
2
Overview of a generic risk assessment procedure
A risk assessment procedure typically involves four stages; identification of hazards, assessment of the consequences (or severity) of the hazard occurring, assessment of the likelihood (or probability) of the hazard occurring and finally, a combination of the above information into a single value representing the level of risk associated with the identified hazard. The assessment of both the severity and likelihood of an identified threat occurring generally involves assessing an information or data set using an appropriate relative scale e.g. 1 to 5, where the numeric values have been pre-defined to represent either a comparatively escalating severity of consequence or likelihood of occurrence (see Figure 1). Such a risk assessment approach is well recognised and accepted (e.g. CRAMM, 2003; DEFRA, 2004; USDA, 2003; Renn and Graham, 2005) and has the advantage that it enables the overall assessment procedure to be more objective as well as allowing aspects to be handled that are not strictly governed by explicit numeric values. Although the use of quantitative data is preferred, this approach recognises that neither the impact nor the likelihood of an identified event occurring can always be readily quantified, if at all. Hence, this methodology also supports the use of more qualitative data and the use of ‘expert judgement’ which, in the absence of field or literature data, is recognised as a pragmatic approach to managing the need to make decisions in the face of uncertainty (Scholes et al, 2007). Once this information has been compiled, it can then be used to prioritise the identified risks, effectively developing a ranked order of risks based on a combination of the severity of a particular risk occurring together with its likelihood of occurrence. A common approach to the combination of these two sets of data is the development of a matrix which enables both sets of data to be viewed simultaneously in a format which readily supports the application of an initial approach to risk rating such as that developed by the Environment Agency for England and Wales (2007) based on an initial 5 point scale, with subsequent combined values categorised as high, medium or low in relation to scores of 1-5, 6-10 and 12-25, respectively (see Figure 1).
Likelihood of occurrence
Severity of consequence Very Low (1) Low (2) Medium (3) High (4) Very High (5)
Insignificant (1)
Minor (2)
Significant (3)
Damaging (4)
Critical (5)
1 2 3 4 5
2 4 6 8 10
3 6 9 12 15
4 8 12 16 20
5 10 15 20 25
Interpretation of overall risk: High = 12-25 (dark grey), Medium = 6-11 (medium grey), Low = 1-5 (light grey) Figure 1. Matrix used to evaluate the level of risk This type of 3-level interpretation of risk scores is commonly described as a ‘traffic light’ approach when the colours red, yellow and green (as opposed to dark grey, medium grey and light grey as in Figure 1) are used to support users in differentiating between risk levels and in terms of serving as ‘trigger’ or threshold levels for management actions. The development of such a risk assessment matrix, and the subsequent risk rating procedure, can thus provide an appropriate framework to facilitate decision-making processes based on an initial technical risk assessment. This approach is also appropriate in terms of facilitating the involvement of a variety of stakeholders drawn from technical, administrative and public community sectors. Full detail of the guideline procedure is given in Ellis et al (2007b).
Scholes et al.
3
Guidelines to completing a SWITCH stormwater risk matrix
To ensure clarity, it is essential that hazards are unambiguously and precisely identified, and that classifications of impacts and frequency of occurrence are supported by brief statements justifying the allocation of one value in comparison to another. This process may be to some extent iterative, with the threats and uncertainties originally identified by LAs requiring refinement to more precisely identify a particular aspect of an identified threat which is being considered. For example, the threat of ‘increased frequency of storms’ could require further refinement if both the increased frequency of increased intensity storms and the increased frequency of storms having no change in intensity were of interest. 3.1
Assessing the consequences of a system failure occurring
In assessing the potential impact of an identified failure occurring, the answer is sought to the question “what will happen if the system or system component fails to act/serve as intended?” A pre-requisite to answering this question is a knowledge or statement of the expected level of performance which may be clear and unambiguous for some aspects of the stormwater management system, e.g. a swale designed to protect a highway from flooding by a storm event of up to a 30 year return period. The consequences of such a failure can be estimated in terms of the costs (direct and indirect) incurred as a result of sub-flooding, if appropriate. The failure of a wetland to achieve a specified pollutant removal level e.g. annual average concentration (mg/l) per annum target, can similarly be quantified in terms of the costs required to increase the retention capacity combined, perhaps, with the costs of correcting downstream damage or the enhanced treatment required to re-establish receiving water standards. In other cases, the performance objective may be more ambiguous e.g. in providing an amenity function for a particular stormwater control device it may only be possible to express values in relative terms such as allocations of high, medium or low values. However, a grading level for the consequences of system failure can be constructed which can support classifications based on either absolute or relative estimations. In relation to the development of a SWITCH risk matrix, Table 2 provides guidance which LAs have been asked to use to support the consistent assessment of the consequences of a particular identified threat occurring. Table 2. Guide to assessing the level of consequence of an identified threat/uncertainty occurring with the SWITCH stormwater matrix Level of consequence (Grading) Very high consequence High consequence
Medium consequence
Low consequence Very low consequence
Example descriptors for relative grading Critical: complete system compromise; unacceptable under any circumstances; catastrophic; loss of life; extreme cost Damaging: Substantial failure to meet regulatory requirement; substantial impact such as flooding of properties; temporary loss; considerable cost Significant: moderate impact; potential to cause political, administrative and/or financial strain or pressure; tangible damage Minor: minimum impact; some additional costs/efforts required Insignificant: negligible or no impact felt
Numeric value associated with grading level 5
4
3
2 1
2nd SWITCH Scientific Meeting, Israel, 2007 Nov.
Example descriptors given in Table 2 in relation to a particular level of consequence are not meant to be exhaustive, but to generically illustrate the types of escalating impact which could be associated with the allocation of a particular categorisation. The numeric values given to each consequence grading are not necessarily intended to reflect a linear escalating scale of consequence or severity, such that a value of 4 is twice as severe as that allocated a value of 2. The numeric scaling may be linear but could also be applied in either a positive or negative exponential manner. Users should be aware of the general relationship between the numeric values being allocated to specific gradings and be prepared to justify the scaling used. 3.2
Assessing the likelihood of an identified failure occurring
In assessing the likelihood of an identified failure occurring, it is necessary to identify how often a particular feature or component is likely to fail. Once again, a pre-requisite to assessing the likelihood of a failure to occur is knowledge of the expected or targeted level of performance of the stormwater management system or component. This might be addressed by available published data, historic evidence, expert judgement or modelling etc. For example, hydrologic modelling of a swale designed to contain the 1: 30 year runoff event would be expected to fail each year with a probability of 0.033. This level of failure might then be graded as being of low significance as it clearly meets the desired criteria or standard of protection. However, if the channel only achieves in practice a 5 year level of protection, then the probability of failure in any one year rises to a 1:5 frequency (or a probability level of 0.20) and this might then be regarded as being of at least medium significance. In the absence of data, predictive models or where there is a large degree of associated uncertainty, the use of expert judgment is recommended as a pragmatic approach. With regard to the SWITCH stormwater risk matrix, Table 3 provides guidance which LAs are asked to use to support the consistent assessment of the likelihood of a particular identified threat or failure occurring. As in Section 3.1 above, the generic example descriptions given in Table 3 only describe how a range of ‘likelihood of occurrence’ data might be comparatively graded. As with the scaling ratio applied for consequence, the numeric values assigned to the gradings for ‘likelihood of occurrence’ can be linear or non-linear in distribution. Table 3. Guide to identifying the likelihood of occurrence of an identified threat/uncertainty with the SWITCH stormwater matrix Likelihood of occurrence (Grading) Very high probability High probability Medium probability Low probability Very low probability
Possible descriptors for relative grading
Almost certain to fail to meet required criteria during anticipated design life; failure during every wet weather event High likelihood to fail to meet required standards; frequently fails during storm events May not meet required standards Normally meet required standards throughout design life Unlikely to fail during lifespan
Numeric value associated with grading level 5 4 3 2 1
Scholes et al.
3.3
Risk rating
The level of risk can be assessed by combining information generated on likelihood of occurrence (Table 3) with information developed on the level of consequence (Table 2). One approach is to multiply together the numeric values associated with each of the identified relative gradings (see Tables 2 and 3) generating a ‘risk score’. The resulting overall level of risk associated with a particular threat or uncertainty can then be interpreted using a pre-established scale, such as that included in Figure 1. Thus combining the likelihood of occurrence with the severity of the consequences can be used as a basis for visually illustrating the level of risk posed by each system component/aspect. This approach can then provide a useful contribution to subsequent stakeholder discussions and decisionmaking within the development of a risk management strategy.
4.
Applying the stormwater risk guidelines.
The principal threats to sustainable urban stormwater management have been identified for each SWITCH demonstration city following consultation with LA members and Table 1 illustrates the two major areas-of-concern (AoCs) in the decision-making process for the Belo Horizonte LA. These also comprise generic stormwater sustainability criteria for the Birmingham LA in that flooding and receiving water quality are major established factors for both current and future stormwater master drainage planning. However, each of these prime driving criteria need to be described by indicators which can measure specific diagnostic states or conditions if they are to be useful for decision-making purposes. The threshold values or conditions given to the indicators can then comprise a point of reference or benchmark for objective decision-making and can be used as a basis for risk assessment. The methodology is described here by reference to the first of the two common threat criteria or indicators, that of intra-urban flooding. The basic causes of such flooding are similar for both demonstration cities and are mainly due to the impacts of new urban developments and associated land use activities which increase imperviousness, as well as from the continued occupation of flood-prone areas. The culverting and ‘canalisation’ of urban channels also exacerbates the downstream impact of flood flows. The threats and uncertainties associated with such flooding are accentuated by potential increases in the scale, intensity and frequency of rainfall resulting from future climate change (Nascimento et al., 2006). In Belo Horizonte, between 40 to 80 individual flooding events are recorded annually with some properties and land use zones in the floodplains of the Oncas, Arrudas and Velhas rivers being inundated at least once every year with reported flood occurrences averaging 1:2 years for substantial sections of the metropolitan region (Champs et al., 2005). Such frequency places considerable pressure on wet weather flow and pollution control as well as associated health risks. The number of flooding events has therefore been adopted by the Belo Horizonte municipality as a component threshold benchmark within their Sustainable Environmental Index (ISA; Indice de Salubridade Ambiental). As currently envisaged, this flood benchmark essentially expresses the likelihood (or frequency) of occurrence, with only minimal consideration given to the severity (or magnitude) of impact associated with each flood event. Whilst the severity of any specific flood event must inevitably impact upon individuals, the understandable principal concern of the LA stakeholders at the present time is to reduce their exposure to the total number of flood events. In the case of the Birmingham LA, their principal concern relates to the severity of damage caused by any flood event, as their flood exposure is currently limited to events of 1:75 or greater given current flood defence levels. This 1.3% to 0.1% (1:1000 RI) occurrence probability inevitably effects the perception of flood risk experienced by the LA stakeholders. Thus both frequency and impact consequence become prime components of the flood indicator for the Birmingham LA with the latter component being
2nd SWITCH Scientific Meeting, Israel, 2007 Nov.
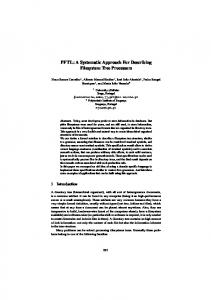
benchmarked by a cost-damage function based on land use type. The Belo Horizonte LA are considering the adoption of number of properties flooded or depth of flooding as benchmarks for measuring this impact consequence. Thus for Belo Horizonte, the likelihood of occurrence would be benchmarked by the total number of flood events and impact consequence by the depth of flooding (or number of properties flooded). The high flood frequency experienced in Belo Horizonte is also partly a result of inadequacies in solid waste disposal, sewage collection and sewer overflows. In addition, such flooding has substantial risk impacts upon public health, soil pollution and water supply. These five inter-acting water resource compartments (water supply, sewage, waste disposal, flooding and health) comprise the basis for the ISA, with risk weightings developed through public consultation as well as technical evaluation. Figure 2 shows the ISA distribution for the south eastern section of the Belo Horizonte district as illustrated in the master drainage plan for the municipality. A 40% threshold weighting on the index value has been taken as a trigger or critical level for priority management action, with a lower 20% threshold applied to “shanty” and other high density occupation zones where flooding combined with poor receiving water quality and health risks pose serious and urgent problems.
Figure 2. ISA index values for the south east section of the Belo Horizonte municipality For the Birmingham LA, the likelihood of flooding occurrences have been specified in terms of probability with areas subject to flooding greater than 1 in 75 (1.3%) being considered to be at significant risk, between 1:75 to 1:200 (0.5%) having moderate risk and less than 1:200 being considered of low risk. The distribution of these flood risk probabilities for the section of the River Rea within the Eastside development area of the city is illustrated in Figure 3. The three flood occurrence grading probabilities might then be allocated a numeric value of 5 (very high probability), 3 (medium probability) and 2 (low probability) respectively, to define likelihood of occurrence for use in the matrices illustrated in Table 3 and Figure 1. The minimal value of 1 could be reserved for the
Scholes et al.
Flood Risk Probability
L M
Low (< 1:200; 0.5% Moderate (1:75-1:200; 1.3%-0.5%) Significant (> 1:75; 1.3%) Additional extent of extreme floods (up to 1:1000; 0.1%)
Limits of Eastside Development
M
L
L L Figure 3. Flood likelihood in the Birmingham Eastside District very low probability associated with extreme flooding occurring between 1:200 to 1:1000 (i.e 0.5% 0.1% probabilities). These numeric values would comprise the likelihood scores entered into Table 2 and form one axis of the coordinates for the Figure 1 risk matrix. The other element of the risk matrix is completed from the evaluation of the severity of consequence associated with each level of the likelihood probabilities. This is achieved from a consideration of the expected damage that would be caused by the varying flood occurrences and is derived from the 100 m impact zone mapping outputs produced under the UK National Flood Risk Assessment (NaFRA) programme of the Environment Agency for England and Wales. These mapped outputs will be superimposed on the flood likelihood map (Figure 3), with impact zones graded into three categories: significant, moderate and low. The
2nd SWITCH Scientific Meeting, Israel, 2007 Nov.
three categories would then be allocated a numeric value to be associated with the level of consequence grading as shown in Table 2 which might be as follows: • significant; very high consequence; numeric value 5 • moderate; medium consequence; numeric value 3 • low; very low consequence; numeric value 1. The numeric values assigned to the likelihood probabilities would then be multiplied by the numeric values given to the levels of consequence to derive overall values to be entered into the risk matrix and which would illustrate the spatial distribution of the flood risk indicator for the Birmingham Eastside demonstration area. A similar methodological approach will be adopted for the receiving water quality indicator with severity benchmarked by a pollution index based on chemical parameters and the levels of consequence measured by biodiversity response. Work on this indicator and others derived from the review of threats and uncertainties within the demonstration cities is continuing as part of Task 2.1.2 within the SWITCH stormwater workpackage 2.1.
5. Conclusions The analysis of threats and uncertainties associated with current stormwater management strategies in the Belo Horizonte and Birmingham demonstration cities has identified a number of common risk factors. The two principal generic risk criteria emerging from the analysis are intra-urban flooding and receiving water pollution. A methodological procedure for risk assessment based on the identification and quanitification of the magnitude of occurrence and impact consequence has been developed using a matrix rating procedure. The technique elaborates a “traffic-light” coding to differentiate risk levels which can then be used in the evaluation of mitigation options and investment prioritisation to achieve future sustainable conditions for urban stormwater management.
Acknowledgements We are grateful to the Learning Alliances identified in this paper for providing the relevant information and particularly Nilo Nascimento and Phil Sharp on behalf of the Belo Horizonte and Birmingham LAs, respectively.
References Champs, JR, Aroeira, T and Nascimento, N. 2005. Servico municipal de drenagem pluvial: Dados gerais, situacao atual e perspectivas para futuro desenvolvimento. SUDECAP, Belo Horizonte, Brazil. CRAMM, 2003. UK Government Risk Analysis and Management Method. Insight Consulting, Walton-on-Thames, UK. DEFRA, 2004. Qualitative Risk Assesement (QRA) Methodology. Department of Environment, Food & Rural Affairs, London. Ellis, JB, Scholes, L and Revitt, DM. 2007a. Evaluation of current stormwater management strategies. SWITCH Deliverable 2.2.1b. www.switchurbanwater.eu/page/767, verified 31 October 2007. Ellis, JB, Scholes, L and Revitt, DM. 2007b. Guidelines for the completion of a risk assessment and risk rating procedure. SWITCH Deliverable 2.1.2. www.switchurbanwater.euy/page/
Scholes et al.
Environment Agency for England and Wales. 2007. Doing a risk assessment. http://environmentagency.resultspage.com/search?p=Q&ts=english&w=risk%20assessment&parentpdf=mt_parent pdf_de12d5e7939193a5332b3c74e132825e verified 31 October 2007. Nascimento, N, Heller, L, Baptista, M, Heller, P and Chernicharo, C. 2006. Long term uncertainties and potential risks to urban water in Belo Horizonte. Proceedings 1st SWITCH Scientific Meeting. January 2006. University of Birmingham, Birmingham, UK. Nascimento, N, Champs J and Butterworth, J 2006. Scoping visit: Belo Horizonte, Brasil. www.switchurbanwater.eu/page/591, verified 31 October, 2007. Paquet, G. 2001. The new governance, subsidiarity and the strategic state. 183 – 215 in: Governance in the 21st Century. OECD, Paris, France. Renn, O and Graham, P. 2005. Risk Governance: Towards an Integrative Approach. White Paper. International Risk Governance Council. Geneva, Switzerland. Scholes, L, Revitt, DM and Ellis, JB. 2007 A systematic approach for the comparative assessment of stormwater pollutant removal potentials. Journal of Environmental Management, doi:10.1016/j.jenvman.2007.03.003. USDA, 2003. Risk Assessment Methodology. US Department of Agriculture., Washington DC. US.