Environ Monit Assess (2007) 130:255–270 DOI 10.1007/s10661-006-9394-3
Development and Application of Software Tools for Monitoring, Assessment and Reporting of Data Concerning the Operation of Urban Wastewater Treatment Plants in Cyprus Achilleas Papadopoulos & Simos Malamis & Kostas Moustakas & Christos T. Kiranoudis & Maria Loizidou
Received: 1 February 2006 / Accepted: 29 June 2006 / Published online: 21 October 2006 # Springer Science + Business Media B.V. 2006
Abstract This work focuses on the development and application of appropriate software tools for recording, assessing and reporting data related to the operation of the Urban Wastewater Treatment Plants (UWTPs) in Cyprus. An appropriate Internet-Based Management System was designed, developed and installed at the premises of the UWTPs and of the Cypriot Competent Authority (Water Development Department — WDD) in order to coordinate and disseminate tasks and related information for monitoring the operation of UWTPs. In addition, a client Geographical Information System database was compiled to be used for obtaining and analyzing spatial information. The software tools are based on common procedures and state-of-the-art technology for the recording and transmission of data and information and they provide an integrated view related to the operation and the efficiency of wastewater treatment systems. Moreover, continuous control and systematic monitoring of the UWTPs by the operators as well as continuous and direct supervision of the UWTPs environmental performance is achieved by the personnel of the Competent Authority. Furthermore, direct and unobstructed provision of data to the A. Papadopoulos : S. Malamis (*) : K. Moustakas : C. T. Kiranoudis : M. Loizidou School of Chemical Engineering, National Technical University of Athens, Zografou Campus, 15773 Athens, Greece e-mail:
[email protected]
Competent Authority of Cyprus is accomplished by the operators of the UWTPs, while the Competent Authority is supported to compose full and representative reports to the European Commission and other International Organizations. The developed tools enable the direct recording of data obtained through measurements and analyses, permit the comparison of data with existing legislation and provide an integrated picture of the operation of the wastewater treatment plants as well as the option to focus and assess each individual treatment stage. Keywords database . Geographical Information Systems . monitoring and control . reporting of data . software tools . urban wastewater treatment plants
1 Introduction The effective control and monitoring of the UWTPs can be achieved through the use of appropriate tools for recording, assessing and reporting data related to the operational characteristics of urban wastewater treatment plants (UWTPs) as well as to the conduction of sampling, measurements and analyses of raw and treated wastewater. These tools must be flexible, based on state-of-the-art technologies and should follow standard procedures that are common for all treatment plants. In this paper, the development and application of such tools is described. The developed tools are used
256
Environ Monit Assess (2007) 130:255–270
specifically for the needs of the Cypriot UWTPs and the Competent Authorities. Nevertheless, these tools can be used as a prototype system for the integrated control and monitoring of any wastewater treatment plant provided the necessary data is available. The developed tool serves the following needs: & & &
&
Direct recording of the results obtained by conducting measurements and laboratory chemical analyses Instant checking and comparison of the results obtained with the existing quality standards for the safe disposal of treated wastewater Direct and complete picture of the efficiency of each individual stage of the entire treatment system — Instant determination of the points where the system presents glitches and/or malfunctions Direct and straightforward elaboration/processing of the results that have been obtained during a specific time period. This allows: (a) the extraction of trends concerning the quality of raw and treated wastewater, (b) the connection of the quality of the raw and treated wastewater with the possible sources that surcharge their pollution load (e.g., industries that dispose their wastewater into the sewerage network), (c) extraction of correlation coefficients between the polluting parameters (e.g., BOD5/COD, S.S./ COD, S.S./BOD, N/P etc.)
2 Developing Internet-Based Application Tools Web services offer new opportunities in civil activities landscape, facilitating a global place where activities rapidly create innovative tools and serve the needs of operators in a better way. Web services that have the flexibility to meet the demand and which accelerate efficiency and competence are the ones that will be needed. In turn, the developer can focus on building core competencies to create operators value. Application development is also more efficient because existing Web services, regardless of where they were developed, can easily be applied elsewhere (Angehrn, 1997). Typically, there are two basic technologies to be implemented when dealing with internet-based applications; namely server-based and client-based. Both
technologies have their strong points regarding development of the code and the facilities they provide. Server-based applications involve the development of dynamically created web pages. These pages are transmitted to the web browser of the client and contain code in the form of HTML and JAVASCRIPT language. The HTML part is the static part of the page that contains forms and controls for user needs and the JAVASCRIPT part is the dynamic part of the page. Typically, the structure of the code can be completely altered through the intervention of web server mechanisms added on the transmission part and implemented by server-based languages such as ASP, JSP, PHP, etc. This comes to the development of an integrated dynamic page application where user desire regarding problem peculiarities (calculating shortest paths, execute routing algorithms, transact with the database etc.) is implemented by appropriately invoking different parts of the dynamic content of such pages. In server-based applications all calculations are executed on the server. In client-based applications, JAVA applets prevail. Communication of the user is guaranteed by the well-known JAVA mechanism that acts as the medium between the user and code. Everything is executed on the client side. Data in this case has to be retrieved once and this might be the time-consuming part of the transaction (Evans & King, 1999; Haig, 2001; Hakman, 2000; KleinaltenKamp & Jacob, 2002). In server-based applications, server resources are used for all calculations and this requires powerful server facilities with respect to hardware and software. Client-based applications are burdened with data transmission (chiefly related to road network data). There is a remedy to that; namely caching. Once loaded, they are left in the cache archives of the web browser to be instantly recalled when needed. 2.1 Architecture and interface In our case, a server-based application was developed. It involved an administrative part for creating and maintaining user roles to the system and separate user parts corresponding to different urban wastewater treatment plants. Its scope was straightforward: &
Monitor installation stream characteristics by registering samples to the database
Environ Monit Assess (2007) 130:255–270
& & &
Monitor adjacent companies_ disposals features by registering samples to the database Archive samples and generate reports in the form of tables, bar charts, diagrams Generate full report for specific periods regarding overall performance
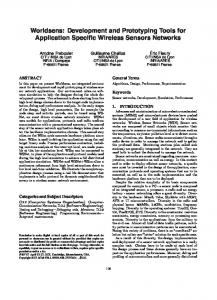
More specifically, the system that was installed at the premises of the six UWTPs in Cyprus is a webbased application. The architecture of the system is depicted in Figure 1. An Internet Information Web Server hosts the active Web pages of the developed portal. The web pages interact with the user to retrieve and store data in an external database hosted in the same server where the web pages reside. The database system is the heart of the operational system and it has a two-fold role. Within its relational infrastructure, it provides detailed information concerning several regional and operational data related to local installations and their associated sites. Furthermore, it provides information on the actual
Figure 1 System architecture.
257
pollution data schema. The aforementioned data is a significant part of the compiled and maintained information. In addition, the database system serves as the common repository of all tools to store and exchange data within the framework of each application. In particular, each tool retains its own part of the database to store data and information produced by the interactive communication with the user. The level and complexity of database transparency to each tool depends on the access privileges of each application for a specific task. The main functions of the database system are: & & & &
Insertion of data related to the sampling, measurements and analyses programme applied at each UWTP Creation of achieves with historical data (in appropriate database views) Presentation of analytical and historical data concerning sampling, measurements and analyses Presentation of data related to hotels and industrial units that dispose their wastewater into the
258
& &
&
Environ Monit Assess (2007) 130:255–270
sewerage network of each UWTP (supported by appropriate database) Insertion of data concerning the disposal of wastewater from hotels and industries into the sewerage network Capability for system expanding in order to include new units (hotels and industries) that will dispose their wastewater into the sewerage network in the future Creation of reports in the form of tables, figures, bar charts, etc.
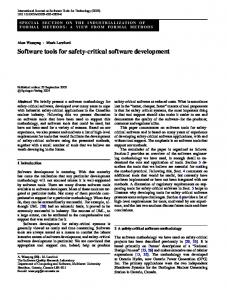
Figure 2 Portal functionality. (a) Creation of new sample in the database; (b) insert parameters in installation sample; (c) call archived site data.
& & & &
Easy search in order to find specific information concerning sampling and measurements (specific dates and sampling points) Capability for data processing (e.g., calculation of total polluting load at the inlet and the outlet of each UWTP) Assessment of the overall performance of the UWTPs — Development of corrective measures Creation of complete reports for specific time periods (analytical data per sampling and total loads)
Environ Monit Assess (2007) 130:255–270
259
Figure 2 (continued).
The basic active server page functionality is well depicted in the instances presented in Figure 2. The system installed at the WDD premises has on-line connection with all six UWTPs. The connection is a standard HTTP connection and the active server pages were transparent through appropriate web browsing software. The clients using the software through the internet were facilitated with: & &
& & &
& &
Direct access to the data kept in the software system and database of each UWTP Extraction of specific historical data from the archives kept by the UWTPs (e.g., historical data concerning the effluent characteristics of each UWTP) Storage of historical data related to the wastewater inlet and outlet characteristics of each UWTP Easy and unobstructed search in order to find specific data (e.g., specific sampling dates at the inlet and outlet of each UWTP) Capability of data processing (e.g., for the calculation of the total inlet and outlet polluting load for each UWTP individually and for all the UWTPs as a whole) Creation of reports including aggregated data for each UWTP as well as for all the UWTPs Preparation of complete and representative reports concerning the operation of the UWTPs (fulfilling
&
&
the obligations of the country for reporting to the EU, to European and to International organizations) Capability of the system to expand in order to have on-line connections with the software systems that are planned to be installed at other existing and at new treatment plants Capability for upgrading the system (extraction of data according to additional obligations that may arise for reporting to the EC, to European and to International Organizations)
The system_s functionality is briefly described in this paragraph. Each user enters the system by means of a secure web page using a personal password protected access form. Three different user accounts have been created for the operation of this system. A super-user account creates passwords for all other accounts including super-users. An administrator account assigns simple user accounts to installations and has access to web pages and forms for creating new installations, defining new parameters (names, measurement units, minimum and maximum values if necessary), introducing new site types and categories and assigning parameters to each site type. A simple user account has access to restricted site web pages assigned to it by an administrator account. For each site, the user can define basic characteristics and
260
Environ Monit Assess (2007) 130:255–270
Figure 3 Representation of archived data. (a) Archived sample data presented in the form of tables; (b) archived sample data presented in the form of bar charts; (c) archived sample data presented in the form of diagrams.
elements of the site (address, phone numbers, personnel names and status). Furthermore, he can create sites within an installation by defining the name and type of site. Subsequently, the user can create new samples defining the date and the personnel that carried out the sampling process. Several other characteristics (mainly flow rates and comments) are specified. To complete the data entry for a specific sample, the user specifies a number of sub-samples for each site in the installation by introducing the values of the sub-samples related parameters. All
parameters are directly proposed by the system since each site has a predefined number of parameters, as mentioned above. The parameters are related to sludge properties if the site has sludge treatment processes. In the same way, samples concerning external polluting companies (industries, hotels) related to the operation of the installation can be imported in the system database. The user has access to past database samples in order to modify or delete as well as to a comprehensive class of reports explained in detail in the following paragraphs so
Environ Monit Assess (2007) 130:255–270
261
Figure 3 (continued).
that conclusions for quantity and quality of stored data are drawn. Using the developed software systems, useful data were extracted. The presentation of data was carried out in the form of tables, bar charts and diagrams, as illustrated in Figure 3. In particular: & & & & & &
Data for 38 treatment plants was taken under consideration This data refers to sampling, measurements and analyses from 81 different wastewater treatment plants_ points 44 polluting parameters were determined Data for 2,054 samples was inserted into the system 33,798 values of polluting parameters were determined and inserted into the system The system database is currently populated with real-time data that enriches historical archives mentioned above
System data concerned instances of parameters measured in installation sites. Each installation comprised several sites where data was measured within a certain time horizon. Each site was categorized so that sites of similar category would comprise parameters of the same nature (i.e., secondary or tertiary treatment). More than one sample could be created for each site,
installation and date. Moreover, several sub-samples could be created for each sample. In this way reproducibility was maintained. The measurements and analyses of the samples that were taken from the different sites of each treatment plant took place according to the Standard Methods (APHA-AWWA-WEF, 1998). The system was developed in open source web resources (pHp-mySQL) and the aggregate values are obtained by appropriately summing up flow values and average concentration levels. Furthermore, the aggregate data can be used by the Competent Cypriot Authorities for the preparation of the appropriate reports that are required by the European Commission and International Organizations, aiming at fulfilling the reporting obligations of the country (Directive 91/ 692/EEC of the Council of 23 December 1991 standardizing and rationalizing reports on the implementation of certain Directives relating to the environment, Joint Questionnaire of Eurostat/OECD, etc.). Figure 4 illustrates the functions and the connectivity of the integrated software tools which were developed. 2.2 GIS connectivity The system portal was connected to a GIS client software that involved several thematic layers of the case study. The connection was carried out through system database. The Geographical Information Sys-
262
Environ Monit Assess (2007) 130:255–270
Figure 4 Illustration of the functions and the connectivity of the integrated software tools.
tem (ESRI ArcView GIS 3.x) is the client-based user– system interface, since it executes most relevant activities of spatial nature in conjunction with the external database system. This tool includes all the necessary cartographic information stored in appropriate views of diversified detail and significance. This information is derived from the extended regional maps of the proper scale, updated with suitable photogrammetric methods, at various levels of analysis and accuracy (Figure 5).
Several thematic layers were gathered regarding: & & & & & &
Major cities and wastewater treatment installations Natura 2000 protected areas Cypriot sensitive areas Nitrogen protected areas Rivers and lakes River basins and catchment areas
Direct link to system database was achieved by appropriate application protocols. This functionality
Environ Monit Assess (2007) 130:255–270
263
Figure 5 GIS functionality and themes. (a) GIS related view; (b) GIS protected areas; (c) GIS rivers and catchment areas.
allows the direct presentation of database data through graphs and pie charts triggered by GIS buttons (Figure 6).
In short, the GIS installed at the premises of the WDD has on-line connection with the software system that was also installed at the WDD. The GIS includes information
264
Environ Monit Assess (2007) 130:255–270
Figure 5 (continued).
for several thematic areas (thematic layers). In particular, the following information is provided by the GIS: &
& & & & &
Main urban areas and existing treatment plants (by selecting a specific wastewater treatment plant, the GIS is connected with the database and information concerning the specific treatment plant are presented, in the form of diagrams and bar charts) Areas of the Natura 2000 network Sensitive areas Areas preserved against nitrogen pollution Rivers, streams and dams River basins and catchment areas
2.3 Data elaboration This Section presents the data that was collected and analyzed for the six UWTPs in order for the developed software tools to be applied. Table I presents analytical data related to the inlet and outlet polluting load of five main parameters (BOD5, COD, SS, TN, TP) for each one of the six main UWTPs located in Cyprus (data refers to the year 2003). Despite the fact that several more parameters are recorded these five pollutants are characteristic and must be recorded at each treatment plant, according to the provisions of the relative European Legislation
(Directive 91/271/EEC of the Council of 21 May 1991 concerning urban wastewater treatment). Furthermore, the total inlet and outlet polluting load for the main parameters (total for the six UWTPs) is given in Table II for the year 2003. The total outlet polluting load for each one of the six UWTPs according to the treatment level that is applied is given in Table III, while the total outlet polluting load for the six UWTPs according to the treatment level is given in Table IV. From the results presented in Tables I, II, III and IV it is noted that in the four treatment plants where tertiary treatment is employed (biological treatment using activated sludge plus chemical treatment using coagulants) higher removal of pollutant load is achieved compared to the removal that is obtained at the two treatment plants where secondary treatment is applied (stabilization ponds). Nevertheless, the removal of polluting load at all the UWTPs is relatively high; this fact proves that all six UWTP plants operate efficiently. These aggregated data must be extracted and reported by the country in order to fulfill its obligations for reporting to European and international organizations (e.g., Joint Questionnaire of Eurostat and OECD). Finally, Table V presents the number of sampling points, the number of samples as well as the number of parameters that were determined per collected sample. The parameters that were
Environ Monit Assess (2007) 130:255–270
265
Figure 6 GIS viewer data for a specific treatment plant.
determined are: pH, temperature, alkalinity, hardness, BOD, COD, suspended solids, total dissolved solids, volatile solids, suspended solids, volatile suspended solids, conductivity, ammonia nitrogen, nitrate nitrogen, nitrite nitrogen, total nitrogen, phosphates, total phosphorous, boron, calcium, chlorides, cadmium, iron, chromium, fluorides, chloride residual, grease — oils, worms, potassium, magnesium, manganese, nickel, lead, phenols, zinc, sulphates, sulphides, surfactants, cooper, toxicity, gene toxicity, faecal coli and total coli.
3 Case Studies The software tool was developed and applied for the six UWTPs of Cyprus. Two of these, located in
Nicosia, employ secondary treatment, while the other four UWTPs employ tertiary treatment. The Anthoupolis UWWTP of Nicosia has been designed to treat 350 m3/d. The plant employs the technology of aerated lagoons and stabilization ponds for the secondary treatment of wastewater. The plant receives only domestic wastewater, since no industrial wastewater is discharged into the main sewerage system. The biological stage consists of an aerated lagoon, two parallel facultative ponds and finally an aerated lagoon. The total retention time in the secondary system exceeds 30 days (Fatta et al., 2004). The UWTP of Mia Milia in Nicosia employs secondary treatment using the technology of stabilization ponds. The plant has been designed for a PE of 130,000 and currently treats 13,000 m3/d. In partic-
266
Environ Monit Assess (2007) 130:255–270
Table I Inlet and outlet polluting load for each UWTP Influent (m3/d)
UWTP
Anthoupolis Mia Milia Limassol Larnaca Paphos Paralimni/Agia Napa
350 13,000 22,000 8,500 5,400 12,000
Inlet (kg/d)
Outlet (kg/d)
BOD
COD
SS
TN
TP
BOD
COD
SS
TN
TP
197 5,386 8,080 2,585 2,732 3,863
361 11,300 16,092 5,280 4,065 7,730
121 5,423 8,156 2,281 1,607 2,591
35 1,436 1,204 557 341 638
10 232 325 90 65 102
12 487 143 52 44 64
87 1,386 635 323 304 335
67 886 78 83 26 85
8 102 202 43 33 58
2 158 136 42 20 44
ular, the system consists of five parallel anaerobic lagoons, followed by four aerobic lagoons then by three facultative ponds and finally by two maturation ponds. The total retention time exceeds 60 days. The treated effluent is disposed to a nearby stream. The UWTP of Limassol has been designed for a PE of 70,000 and receives mainly municipal wastewater and a small amount of industrial (dairy and fruit juices) wastewater. The system employed is that of extended aeration activated sludge followed by tertiary filtration. The pre-treatment consists of screening, sand removal and oil removal. Then the wastewater enters the primary sedimentation basins and is directed towards the secondary treatment units. The latter consist of anoxic and aerated reactors for the biodegradation of organic matter and the biological removal of nitrogen and of secondary sedimentation basins for the settling of activated sludge. Then the secondary effluent passes through sand filters and is finally disinfected using chlorine. Currently, the quantity of produced effluent is 12,000 m3/d at winter time and 15,000 m3/d at summer time. More than half of the treated wastewater is used for direct irrigation. A small portion is directed to a nearby dam, while the
Table II Total inlet and outlet polluting load for the main parameters (total for the six UWTPs) Pollutant
Total inlet polluting load (kg/d)
Total outlet polluting load (kg/d)
BOD COD SS TN TP
22,843 44,828 20,179 4,211 3,754
802 3,070 1,225 446 402
remaining water is discharged into the sea (Fatta, Anayiotou, & Papadopoulos, 2005). The Larnaca UWTP has been designed to for a PE of 36,000 and for a daily inflow of 8,500 m3/d. It receives only municipal wastewater and wastewater from the airport of Larnaca which has a high concentration of oil. Initially, all the influent wastewater streams are mixed together with activated sludge that settles at the secondary sedimentation basins. The mixed stream then passes through bar racks and grit chambers and is then biologically treated. The secondary treatment system employed is that of activated sludge extended aeration, consisting of two parallel oxidation ditches and two sedimentation basins. The secondary effluent is directed into storage lagoons into which it is stored during winter time in order to be used in the summer. Then the treated effluent passes through sand filters and is disinfected with chlorine. The final effluent is used for irrigation (Fatta et al., 2005). The UWTP of Paphos is designed for a PE of 55,000 and has a treatment capacity of 5,500 m3/d. The plant is designed to treat domestic wastewater and septic wastewater. The influent wastewater is pre-treated with bar racks and a grit chamber and is then primary treated in two sedimentation basins. At the secondary treatment stage, nitrification, denitrification and settlement take place in four tanks. The tertiary treatment stage consists of sand filters and a chlorination tank. The treated effluent is used for aquifer enrichment. In particular, it is placed in ponds and through infiltration reaches the aquifer (Fatta et al., 2005). The UWTP of Agia Napa and Paralimni serve a total population of 75,000. Mechanical pre-treatment and grit removal take place. Then the wastewater is biologically treated; the plant employs the activated sludge extended aeration method, but there is no provision for denitrification or phosphorus removal. Secondary sedimentation
Environ Monit Assess (2007) 130:255–270
267
Table III Outlet polluting load for each one of the six UWTPs according to the treatment level UWTP
Treatment level
Anthoupoli Mia Milia Limassol Larnaca Paphos Paralimni/Agia Napa
Outlet load (kg/d)
SECONDARY SECONDARY TERTIARY TERTIARY TERTIARY TERTIARY
BOD
COD
SS
TN
TP
12 487 143 52 44 64
87 1,386 635 323 304 335
67 886 78 83 26 85
8 102 202 43 33 58
2 158 136 42 20 44
takes place in three parallel sedimentation basins and the effluent is then fed to storage lagoons followed by two separate tertiary treatment units. The final effluent is used for irrigational purposes. In Table VI the influent and effluent wastewater characteristics are given for the six UWTPs. As shown in Figure 2(c), the software tool is applied for the case study of Anthoupolis UWTP. Figure 2(a) shows how new data is inserted into the database, by recording the date the sample was taken, the type of sample and other useful comments. Figure 2(b) shows various parameters and their corresponding values; other parameters can be added for the plant; this way the operator can have on his screen only the parameters that are required for his control and monitoring needs. The final effluent from the UWTP is mainly used for irrigation and is therefore not disposed to water recipients. Nevertheless, in the cases where the treated effluent is disposed to streams, to the sea, to dams or applied for aquifer enrichment, the software tool promotes the implementation of the Water Framework Directive (WFD). In particular, the software tools enable the monitoring of the operation of the UWTPs at each stage in order to ensure that the final effluent
Table IV Total outlet polluting load according to the treatment level (total for the six UWTPs) Pollutant
SECONDARY
TERTIARY
BOD (kg/d) COD (kg/d) SS (kg/d) TN (kg/d) TP (kg/d)
449 1,473 953 110 160
303 1,597 272 336 242
has such quality that it will preserve the good quality of existing water recipients in Cyprus. The tools allow the operator to spot potential problems in each stage of the plant operation; this way the smooth plant operation is ensured, resulting in a good effluent quality that minimizes the accumulation of pollutants in water recipients.
4 Usefulness of Software Tool The continuous and direct recording and assessment of the data referring to the treated wastewater effluent illustrates the level of potential threat to the environmental receivers instantly (without delays). This allows the operators of the treatment plants to undertake immediate actions in order to eliminate potential trouble-shootings and malfunctions. In the cases where high concentrations of specific pollutant(s) are determined in the treated effluent, the user of the software tool checks the entire set of data that is recorded for the specific date (data related to each individual sampling point of the treatment plant e.g., effluent of primary treatment tank, activated sludge tank, effluent of secondary treatment tank, etc.) in order to determine the treatment stage where the problem is presented, affecting the quality of the treated effluent. Moreover, the user has the option to check if the high pollutant concentrations in the treated effluent are due to uncommonly high polluting load presented in the wastewater that is disposed into the sewerage network by the industries that are connected with the urban wastewater treatment plant. In this case, the operator of the treatment plant takes instant actions in order to stop immediately the disposal of the industrial wastewater into the sewerage network.
268 Table V Data of sampling, measurements and analyses for each UWTP
Environ Monit Assess (2007) 130:255–270
UWTP
Sampling points and number of samples
Number of parameters that was determined*
Anthoupolis Nicosia
Inlet (43) Aeration tank (43) First amphoteric tank (43) Second amphoteric tank (43) Maturation tank (43) Inlet (33) Anaerobic treatment tank (33) Aerobic treatment tank (33) Amphoteric tank (33) First maturation tank (33) Second maturation tank (33) Inlet (609) First aeration tank (609) Second aeration tank (609) Primary treatment outlet (609) Secondary treatment outlet (609) Tertiary treatment outlet (609) Sludge recycling line (609) Primary sludge settlement tank (609) Secondary sludge settlement tank (609) Primary sludge digestion tank (609) Secondary sludge digestion tank (609) Stabilized sludge tank outlet (609) Dewatered sludge tank Inlet (213) First oxidation ditch (213) Second oxidation ditch (213) Sludge recycling line (213) Thickening sludge tank (178) Tertiary treatment inlet (211) Tertiary treatment outlet (133) Inlet (457) Primary treatment outlet (457) Nitrification tank (457) Secondary treatment outlet (814) Tertiary treatment outlet (100) Inlet (519) Secondary treatment outlet (519) Tertiary treatment outlet (519)
36 14 14 14 14 37 15 15 15 15 15 38 17 17 38 38 44 3 4 2 3 3 12 2 38 5 5 3 1 8 44 38 33 11 41 44 10 2 8
Mia Milia, Nicosia
Limassol
Larnaca
Paphos
Paralimni/Ag. Napa
The direct recording and processing of the data from the chemical analyses of samples of wastewater from each individual stage of the treatment plant provides the capability to assess not only the operation performance of the treatment plant as a whole and its potential impacts to the receiving bodies, but also the operational efficiency of each individual treatment stage. For example, the determination of high concentrations of specific pollutants in the treated effluent
could be the result of (1) malfunctioning occurring at the specific stages of the treatment (e.g., poor settling of sludge in the primary sedimentation basin) or (2) the unusually high influent pollutant concentration in the UWTP due to disposal of untreated or semi-treated industrial wastewater in the sewerage network that is connected to the UWTP. The software tool does not incorporate early warning procedures to prevent spills or uncontrolled
Environ Monit Assess (2007) 130:255–270
269
Table VI Influent and effluent wastewater characteristics for the six UWTPs Influent characteristics
Athoupolis
Larnaca
Mia Milia
Limassol
Paphos
Paralimni/Agia Napa
BOD5 (mg/l) COD (mg/l) TSS (mg/l) TKN (mg/l) NH4–N (mg/l) TN (mg/l) TP (mg/l) PO4–P (mg/l) Effluent characteristics BOD5 (mg/l) COD (mg/l) TSS (mg/l) TKN (mg/l) NO3–N NH4–N (mg/l) TN (mg/l) TP (mg/l) PO4–P (mg/l)
563.4 1,032.7 346.6 99.6
304.1 621.2 268.4 65.5 57.5
414.3 869.2 417.2 110.5
367.3 731.4 370.7 54.7 36.2 55.2
321.9
28.8
10.6
17.8
487.4 749.4 317.6 70.0 38.1 72.0 12.5
Athoupolis 32.2 136.3 58.6 37.3 0.27 23.7 37.6
Larnaca 6.1 38.0 9.8 5.1 15.6 3.1 24.4 4.9
Mia Milia 37.5 106.6 68.1 32.1
Paphos 17.6 42.4 6.1 4.4 3.8
Paralimni/Agia Napa 1.6
27.6 8.3
& &
&
Monitoring the operation of the treatment plants by the operators with regard to: (a) inlet polluting load, (b) outlet polluting load, (c) removal efficiency at each stage of the treatment plant, (d) total removal efficiency of pollutants, in real time Direct control of the operation of each treatment plant by the personnel of the competent authority Ability to estimate the impacts to the environment through the calculation of the total load of each pollutant of the treated effluent that is disposed to water recipients Connection of the quality status of the recipient of the treated wastewater with the polluting load (quantitatively and qualitatively) that is disposed to it. The latter facilitates to act proactively and take measures to protect the water recipients in the cases where the recipient is surcharged by polluting load. These measures can be: (a) setting lower concentration limits for the disposal of treated wastewater in receivers where the possibility of pollution is increased, (b) setting of obligations for sampling and carrying out of
2.4 0.03 0.35
2.5 5.8
measurements by the operators of the treatment plants, in more frequent basis. (c) Increasing the number of inspections that are taken place by the environmental inspectors
situations, since it focuses on specific wastewater treatment lines that are fixed and consolidated (the design capacity of the plants allows the effective management/treatment of the entire quantity of the wastewater that is generated in each area). The software tool provides the following solutions: &
9.61 Limassol 6.5 28.9 3.6 9.2 5.1 4.9 8
216.0 53.1
As far as quality control and quality assurance is concerned the following procedures were followed: &
&
&
&
Standard procedures were applied for the collection of samples (application of ISO procedures for sampling of treated and raw wastewater, use of appropriate samplers, use of appropriate containers for the collection of the samples) Standard procedures were followed for the conservation of the samples in the cases when specific polluting parameters were not measured instantly (samples were kept in specific temperature conditions, specific chemicals were added) Standard methods were applied for carrying out the chemical analyses (standard methods set by the International Standardization Organization, methods that are given by European Directives, methods that are suggested by the Standard Methods for the Examination of Water and Wastewater) The conducting of sampling, measurements and chemical analyses took place by experienced personnel of each wastewater treatment plant
270
& &
Environ Monit Assess (2007) 130:255–270
Each measurement and chemical analysis were replicated twice in order to obtain representative and reliable results The laboratory devices were maintained and calibrated according to their operation manual specification, before carrying out the measurements and chemical analyses
representative reports to the European Commission and other International Organizations. Acknowledgement The work was carried out as part of the Life Third Countries project BDevelopment and Implementation of an Integrated System for the Control and Monitoring of the Urban Wastewater Treatment Plants in Cyprus^ with acronym COMWATER which was co-financed by the European Community.
5 Conclusions
References
The software tools developed in this work enable the efficient monitoring of the UWTPs. The developed tools permit the personnel of the competent authorities to have a direct control of the operation of each treatment plant. Furthermore, the tools provide a concise picture of the efficiency of the whole plant as well as of the efficiency of each individual treatment stage, thus allowing effective and continuous control by the plant operators. In addition, the software systems can be used to directly record all the conducted measurements and laboratory chemical analyses and permit comparison of data with existing quality standards. The tools provide an integrated view related to the operation and the efficiency of the wastewater treatment systems as well as direct control of the industrial wastewater discharged into the sewerage network. Moreover, these tools can be used to estimate the impacts to the environment through the calculation of the total load of each pollutant of the treated effluent that is disposed to the receivers. Common procedures for the recording and transmission of data and information are adopted using state-of-the-art technology, while the recording procedures of operational data applied by the operators of the UWTPs are improved. The application of these tools results in the direct and unobstructed provision of data to the Competent Authority by the operators of the UWTPs. Finally, the Competent Authority is supported to compose full and
Angehrn, A. (1997). Designing mature internet business strategies: The ICDT model. European Management Journal, 15(4), 361–369. APHA-AWWA-WEF (1998). Standard methods for the examination of water and wastewater, 20th ed. Washington DC, USA: American Public Health Association. Directive 91/271/EEC of the Council of 21 May 1991 concerning urban wastewater treatment. Directive 91/692/EEC of the Council of 23 December 1991 standardizing and rationalizing reports on the implementation of certain Directives relating to the environment. Evans, J. R., & King, V. E. (1999). Business-to-business marketing and the world wide web: Planning, managing, and assessing web sites. Industrial Marketing Management, 28(4), 343–358. Fatta, D., Anayiotou, S., & Papadopoulos, I. (2005). An overview of the Water and Wastewater Management Practices in Cyprus, IWA Specialty Conference, Wastewater reclamation and reuse for sustainability, November 8–11 2005, Jeju, Korea. Fatta, D., Skoula, I., Moustakas, K., Mentzis, A., Papadopoulos, A., Loizidou, M. et al. (2004). Existing Situation, Plans and Policies for the Wastewater Reuse in Agriculture in Cyprus, Jordan and Palestine, International Conference for the protection and restoration of the Environment VII, Mykonos, Greece, 28th June–1st July 2004. Haig, M. (2001). The e-marketing handbook: An indispensable guide to marketing your products and services on the internet, (pp. 1–6). London, UK: Kogan Page Limited. Hakman, A. W. (2000). Opportunities to enhance a commercial website. Information & Management, 38(1), 15–21. KleinaltenKamp, M., & Jacob, F. (2002). German approaches to business-to-business marketing theory Origins and structure. Journal of Business Research, 55, 149–155.