http://www.e-journals.net
ISSN: 0973-4945; CODEN ECJHAO E-Journal of Chemistry 2010, 7(4), 1463-1467
Development and Statistical Validation of Spectrophotometric Methods for the Estimation of Nabumetone in Tablet Dosage Form A. R. ROTE* and S.R BHALERAO Department of Pharmaceutical Chemistry, MGV's Pharmacy College, Panchavati,Mumbai - Agra Road, Nashik- 422003, Maharashtra, India.
[email protected] Received 26 January 2010; Accepted 20 March 2010 Abstract: Three new simple, economic spectrophotometric methods were developed and validated for the estimation of nabumetone in bulk and tablet dosage form. First method includes determination of nabumetone at absorption maxima 330 nm, second method applied was area under curve for analysis of nabumetone in the wavelength range of 326-334 nm and third method was First order derivative spectra with scaling factor 4. Beer law obeyed in the concentration range of 10-30 µg/mL for all three methods. The correlation coefficients were found to be 0.9997, 0.9998 and 0.9998 by absorption maxima, area under curve and first order derivative spectra. Results of analysis were validated statistically and by performing recovery studies. The mean percent recoveries were found satisfactory for all three methods. The developed methods were also compared statistically using one way ANOVA. The proposed methods have been successfully applied for the estimation of nabumetone in bulk and pharmaceutical tablet dosage form. Keywords: Area under curve method, Derivative spectroscopy, Nabumetone, UV spectrophotometric.
Introduction Nabumetone (I) is frequently prescribed as non-acidic non-steroidal anti-inflammatory drug (NSAID) for the symptomatic treatment of rheumatic and inflammatory conditions1,2. Nabumetone is chemically known as (4-(6-methoxy-2-naphthyl)-butan-2-one. It is official in United States Pharmacopoeia and British Pharmacopoeia. Literature survey revealed that several analytical techniques like Colorimetric3 liquid chromatographic4-6, HPLC7,8, spectrophotometric9 methods have been reported for the determination of nabumetone. The proposed research work describes three new UV-spectrophotometric methods for the estimation of nabumetone in bulk and tablet dosage form.
Development and Statistical Validation of Spectrophotometric Method
1464
O CH3 MeO
I (Nabumetone)
Experimental Shimadzu UV-2450 double beam spectrophotometer with 1 cm path length supported by Shimadzu UV-Probe software, version 2.21 was used for all spectrophotometric estimations. Shimadzu balance (AUW-120D) was used for all weighings. Nabumetone was obtained from IPCA Lab. Ratlam, Gujarat, India. Formulation of nabumetone in tablet dosage form was purchased from local market. Methanol was purchased from Fischer Scientific (India).
Standard stock solution Solution containing 200 µg/mL of pure drug was prepared by dissolving 20 mg of nabumetone in sufficient methanol to produce 100 mL solution in volumetric flask. From this aliquot solution was pipetted out and diluted with methanol to obtained working standard stock solution of 50 µg/mL.
Analysis of the tablet formulation Ten tablets were accurately weighed and powdered. A portion of tablet powder equivalent to 20 mg of nabumetone was accurately weighed and transferred into a 100 mL volumetric flask and then added 25 mL of methanol to dissolve contents of tablet formulation. Then, solution was sonicated for 20 minutes and filtered through Whatman filter paper 41. The final volume was made up to 100 mL with methanol to obtain concentration of 200 µg/mL nabumetone. From this aliquot solution was pipetted out and suitably diluted with methanol to obtained working standard stock solution of 50 µg/mL. Various dilutions of the tablet solution were prepared and analyzed for four times and the concentration was calculated by using the calibration curve for three methods.
Recovery A recovery study was carried out by addition of known amount of standard drug in the preanalysed tablet formulation, in 80%, 100% and 120% of label claim. At each level of amount three determinations were performed.
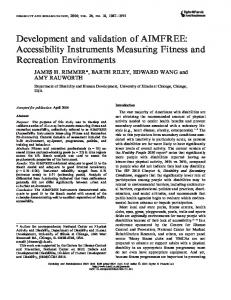
Results and Discussion Absorption maxima method For selection of analytical wavelength 30 µg/mL solution of nabumetone was prepared by appropriate dilution of standard stock solution and scanned in the spectrum mode from 400-200 nm. From the spectra λmax of nabumetone 330 nm was selected for the analysis (Figure 1). The calibration curve was prepared in the concentration range of 10-30 µg/mL at 330 nm. By using calibration curve, the concentration of the sample solution was determined.
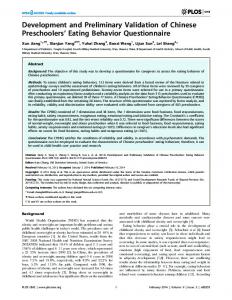
Area under curve method For selection of analytical wavelength, 30 µg/mL solution of nabumetone was prepared by appropriate dilution of standard stock solution and scanned in the spectrum mode from 400-200 nm. From the spectra of drug, area under the curve in the range of 326-334 nm was selected for the analysis (Figure 2). The calibration curve was prepared in the concentration range of 10-30 µg/mL at their respective AUC range. By using calibration curve, the concentration of the sample solution can be determined.
Abs
A. R. ROTE et al.
Abs
1465
Wavelength, nm
Wavelength, nm
Figure 1. Zero order UV-spectrum of nabumetone (30 µg/mL) showing absorptaion maxbma at 330 nm
Figure 2. Zero order UV-spectrum of area under curve method for nabumetone, 30 µg/mL
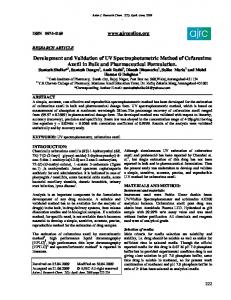
First order derivative spectroscopic method In this method, 30 µg/mL solution of nabumetone was prepared by appropriate dilution of standard stock solution and scanned in the spectrum mode from 400-200 nm. The absorption spectra obtained was derivatized to first order derivative spectra. The First order derivative spectra at scaling factor 4 shows maxima and minima at 310 and 338 nm respectively (Figure 3). The absorption difference is calculated which was directly proportional to the concentration of the standard solution. The calibration curve for nabumetone was plotted in the concentration range of 10-30 µg/mL and scanned in the first order derivative spectra. The calibration curve of dA/dt against concentration of drug showed linearity.
Wavelength, nm
Figure 2. First order derivative spectrum of nabumetone (30 µg/mL) Method Validation
Linearity From standard stock solution of 50 µg/mL of nabumetone 1, 2, 3, 4, 5, 6 mL were transferred into series of 10 mL volumetric flasks to obtain concentration range of 5 to 30 µg/mL for nabumetone (Table 1).
Development and Statistical Validation of Spectrophotometric Method
1466
Table 1. Statistical parameters of linearity of nabumetone Parameters Beer’s law range. Coefficient of Correlation (r2) Slope(m). Intercept(c). LOD, µg/mL. LOQ, µg/mL.
Absorption Maxima 10-30 µg/mL
Area Under Curve 10-0 µg/mL
First Derivative Spectroscopy 10-30 µg/mL
0.9997
0.9998
0.9998
0.00888 -0.00716 0.23 0.71
0.01263 -0.0054 0.34 1.03
0.00188 -0.00088 0.26 0.79
Y=mX+c
Accuracy and precision Precision of the method was evaluated by using tablet powder equivalent to 100% of the label claim of nabumetone. Method repeatability was obtained from R.S.D. value by repeating assay of four replicates of single concentration three times in a same day. Intermediate precision was assessed by assay of four replicates of single concentration of nabumetone on three consecutive days. The accuracy of the methods was assessed by recovery studies at three different levels, 80%, 100% and 120%. The values of standard deviation and recovery studies were found satisfactory (Table 2). Table 2. Results of analysis of nabumetone in tablet formulation and recovery studies Method Absorption Maxima Area Under Curve First Order Derivative
Label Claim Mg/tab 500 . 500 . 500 .
% estimated* 99.63 . 99.87 . 99.78 .
%Recovery* 100.6 . 100.2 . 100.4 .
S.D.±
%RSD
SEM
.0.9515 0.9458 0.5494 . . . 0.9169 0.9150 0.5294 . . . 0.6803 0.6775 0.3928 . . .
*denotes n=4
Limit of detection and limit of quantisation The detection limit and quantisation limit was computed for lower limit of detection and minimum quantity of analyte measured and was found to be satisfactory by proposed spectrophotometric methods.
Statistical evaluation The developed methods statistically compared using one way ANOVA and indicate no significant difference between three methods. Hence these methods can be useful in routine analysis of nabumetone in bulk drug and tablet formulation (Table 3). Table 3. Results of one way ANOVA (Tukey-Kramer multiple comparison test) Comparison Absorption maxima vs. AUC Absorption maxima vs. First order Derivative spectroscopic AUC vs. First order Derivative Spectroscopic
Mean Difference 0.4 0.2 . -0.2
q Value 0.605 0.342 . 0.350 .
P Value P> 0.05 P> 0.05 . P> 0.05 .
1467
A. R. ROTE et al.
Conclusion The developed new three methods proved to be simple in procedure and it produced more accurate results. Hence all three methods effective for the routine analysis of nabumetone in bulk and tablet dosage form.
Acknowledgments The authors gratefully acknowledge the IPCA Laboratories., Ratlam, and Gujrat, India for providing gift sample of nabumetone. The authors are also thankful to Management and Principal of M.G.V’s Pharmacy College, Panchavati, Nashik for providing necessary facilities and constant support for research work.
References 1. 2. 3. 4. 5. 6. 7. 8. 9.
Idrees F Al-Moman, Anal Lett., 1997, 30(14), 2485-2492. Friedel H A, Langtry H D and Buckley, Drugs., 1993, 45, 131. Rao Y S, Chowdary K P and Seshagiri R J, Indian J Pharm Sci., 2003, 65, 206. European Pharmacopoeia 6th Edn. (Suppl. 6.2) Europe, Strasbourg, France, 2007. Kamila Kobylin ska, Magorzata Barli ska and Maria Kobyli ska, J Pharm Biomed Anal., 2003, 32(2), 323-328 United State Pharmacopoeia, 26, NF 21, 2003, 1259. Nobilis M, Kopecky J, Květina J, Svoboda Z, Pour M Kuneš J, Holčapek M and Kolářová L, J Pharma Biomed Anal., 2003, 34, 641. Kobylinska K, Barlinska M and Kobylinska M, J Pharma Biomed Anal., 2003, 33, 323-328. Reddy G K, Rao J V, Varma R L B and Sankar D G, Indian Drugs, 2001, 38, 336.
International Journal of
Medicinal Chemistry Hindawi Publishing Corporation http://www.hindawi.com
Volume 2014
Photoenergy International Journal of
Organic Chemistry International Hindawi Publishing Corporation http://www.hindawi.com
Volume 2014
Hindawi Publishing Corporation http://www.hindawi.com
Volume 2014
International Journal of
Analytical Chemistry Hindawi Publishing Corporation http://www.hindawi.com
Volume 2014
Advances in
Physical Chemistry Hindawi Publishing Corporation http://www.hindawi.com
Volume 2014
International Journal of
Carbohydrate Chemistry Hindawi Publishing Corporation http://www.hindawi.com
Journal of
Quantum Chemistry Hindawi Publishing Corporation http://www.hindawi.com
Volume 2014
Volume 2014
Submit your manuscripts at http://www.hindawi.com Journal of
The Scientific World Journal Hindawi Publishing Corporation http://www.hindawi.com
Journal of
International Journal of
Inorganic Chemistry Volume 2014
Hindawi Publishing Corporation http://www.hindawi.com
Volume 2014
Theoretical Chemistry Volume 2014
Catalysts Hindawi Publishing Corporation http://www.hindawi.com
International Journal of
Electrochemistry Hindawi Publishing Corporation http://www.hindawi.com
Volume 2014
Chromatography Research International
Journal of
Journal of Hindawi Publishing Corporation http://www.hindawi.com
Hindawi Publishing Corporation http://www.hindawi.com
Volume 2014
Spectroscopy Hindawi Publishing Corporation http://www.hindawi.com
Analytical Methods in Chemistry
Volume 2014
Hindawi Publishing Corporation http://www.hindawi.com
Volume 2014
Journal of
Applied Chemistry Hindawi Publishing Corporation http://www.hindawi.com
Volume 2014
Journal of
Bioinorganic Chemistry and Applications Hindawi Publishing Corporation http://www.hindawi.com
Volume 2014
International Journal of
Chemistry Hindawi Publishing Corporation http://www.hindawi.com
Volume 2014
Spectroscopy Volume 2014
Hindawi Publishing Corporation http://www.hindawi.com
Volume 2014