http://www.e-journals.net
ISSN: 0973-4945; CODEN ECJHAO E-Journal of Chemistry 2010, 7(1), 11-20
Development and Validation of a Precise Method for Determination of Benzalkonium Chloride (BKC) Preservative, in Pharmaceutical Formulation of Latanoprost Eye Drops J. MEHTA*, K. PATIDAR and N. VYAS Analytical Research & Development Laboratory, Research & Development- I, Cadila Pharmaceutical Ltd., 1389, Trasad Road, Dholka Ahmedabad-387810, Gujarat, India.
[email protected] Received 17 November 2008; Revised 27 January 2009; Accepted 18 March 2009
Abstract: A simple and precise reversed phase high performance liquid chromatographic method has been developed and validated for the quantification of benzalkonium chloride (BKC) preservative in pharmaceutical formulation of latanoprost eye drops. The analyte was chromatographed on a Waters Spherisorb CN, (4.6x250 mm) column packed with particles of 5 µm. The mobile phase, optimized through an experimental design, was a 40:60 (v/v) mixture of potassium dihydrogen orthophosphate buffer (pH 5.5) and acetonitrile, pumped at a flow rate of 1.0 mL/min at maintaining column temperature at 30 ºC. Maximum UV detection was achieved at 210 nm. The method was validated in terms of linearity, repeatability, intermediate precision and method accuracy. The method was shown to be robust, resisting to small deliberate changes in pH, flow rate and composition (organic ratio) of the mobile phase. The method was successfully applied for the determination of BKC in a pharmaceutical formulation of latanoprost ophthalmic solution without any interference from common excipients and drug substance. All the validation parameters were within the acceptance range, concordant to ICH guidelines. Keywords: Benzalkonium chloride, Latanoprost, Preservative, HPLC.
Introduction The determination of low concentration preservative in pharmaceutical formulation constitutes a challenging problem in current pharmaceutical analysis. Ophthalmic solutions containing the pharmaceutical association between active pharmaceutical ingredient latanoprost and preservative BKC are employed along with other medicines to treat glaucoma and other problems related to high pressure within the eye.
12
J. MEHTA et al.
Latanoprost, a synthetic analog of naturally occurring prostaglandin F2α (PGF2α), is an ocular hypotensive agent. Commercially available latanoprost ophthalmic solution is a clear, colorless, isotonic solution of the drug in sterile water for injection; benzalkonium chloride is added as a preservative. Cl
-
+
CH3 N
CH2(CH2) 12CH3
CH3
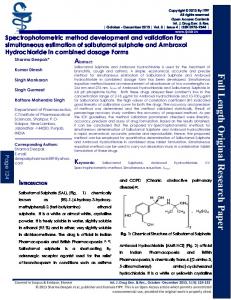
Figure 1. Structure of benzalkonium chloride (BKC). Benzalkonium chloride, also known as alkyldimethylbenzylammonium chloride (ADBAC). It is a mixture of alkylbenzyldimethylammonium chlorides of various evennumbered alkyl chain lengths. This product is a nitrogenous cationic surface-acting agent belonging to the quaternary ammonium group. It has three main categories of use; as a biocide, a cationic surfactant and phase transfer agent in the chemical industry. Its applications are extremely wide ranging, from disinfectant formulations to microbial corrosion inhibition in the oilfield sector. It has been considered one of the safest synthetic biocides known and has a long history of efficacious use. Its use as a preservative in cosmetics such as eye and nasal drops attests to its general safety1. This paper describes a simple, precise and accurate liquid chromatographic method for quantification of BKC in latanoprost opthalmic solution. A comprehensive literature search revealed that review of preparation, pharmacology, structural relationship, effect with inteded use, HPLC2, LC-MS3, MS-MS and other chromatographic methods4,5 for the determination of latanoprost and BKC were reported6-8 as a separate technique but not for BKC with latanoprost, as such there is lack of a suitable procedure for the quantification and estimation of BKC preservative in pharmaceutical formulation of latanoprost. Therefore, the aim of the presented work is the development and validation9 of a simple, precise and accurate method for quantification of benzalkonium chloride (BKC) by HPLC-UV detection, in pharmaceutical formulation of latanoprost eye drops.
Experimental All experiments were performed using ‘A class’ volumetric glassware, pharmaceutical grade BKC and latanoprost. Analytical grade triethylamine, potassium dihydrogen orthophosphate and orthophosphoric acid (Finar chem., A’bad, India), HPLC grade acetonitrile (Merck, Darmstadt, Germany) were employed for preparation of mobile phase. The highly pure HPLC grade Milli Q water (Millipore, Bedford, MA, USA) was used as diluent solvent in sample and standard aliquots. The mobile phase was filtered through 0.45 µm nitrocellulose-membrane filter (Milipore, Barcelona) and degassed under vacuum, prior to use. The samples of pharmaceutical preparation, declaring to contain 0.01% (w/v) BKC, 0.005% (w/v) latanoprost and other excipients, were obtained from M/s Cadila Pharmaceuticals LTD. for analysis.
Instrumentation and Chromatography The liquid chromatograph consisted of a Dionex system, equipped with a P-680 HPLC Pump, an ASI-100 automatic sample injector and thermostated column compartment TCC100 and solvent rack SOR-100. Data collection and interpretation was done using chromaleon software.
Development and Validation of a Precise Method
13
Buffer preparation 2.72 g of potassium dihydrogen orthophosphate was dissolved in 1000 mL of water, 1 mL of triethylamine was added and pH was adjusted to 5.5 with diluted ortho phosphoric acid, which yields a buffer solution which is further used in to preparation of mobile phase. The liquid chromatography was performed using a column, Waters Spherisorb CN, (4.6 mm x 250 mm) column packed with 5µ m particles as stationary phase and a mobile phase consisting of buffer preparation and acetonitrile (40:60 v/v), which was filtered through 0.45 µm nitrocellulose-membrane filter (Milipore, Barcelona) and degassed under vacuum, prior to use. The mobile phase was delivered at a flow rate of 1.0 mL/min with maintaining the column temperature at 30 ºC. The UV detection and quantification was done at 210nm by injecting 10 µL of sample & standard, with the above chromatographic conditions and after partition equilibration, well shaped peak was eluted.
Stock & sample solutions System suitability standard solution 25 mg of benzalkonium chloride (Sigma Aldrich, Milan, Italy) of high purity and known potency was weighed and transferred to a 50 mL volumetric flask, about 30 mL of HPLC grade Milli Q water was added and sonicated to dissolve, diluted up to volume with same solvent and mixed. Further 2.0 mL of this solution was diluted to 10 mL with Milli Q water and mixed (5 mcg/mL). The suitability of system and stability of the solution was checked over the period by injecting this solution. The 5 mL vial of ophthalmic solution containing 0.01% BKC (w/v) & 0.005% (w/v) latanoprost was directly used as sample solution, which was assayed & quantified.
Validation parameters Specificity / selectivity Specificity of an analytical method is its ability to measure accurately and specifically the concentration of analyte(s) of interest without interference from other API, diluent, mobile phase & placebo (excipients omitting drug substances). Specificity of the method is demonstrated by preparing the solutions given below: 1. Mobile phase 2. Standard Preparation 3. Placebo solution in triplicate 4. Placebo spiked with API at target concentration 5. Sample solution Above mentioned each solution was injected to the liquid chromatograph, equipped with photo diode array detector. Chromatograms were recorded and interference of mobile phase and placebo with analyte’s peak was observed. The peak purity of analyte peak was also measured in placebo spiked with APIs and sample solution. 5.0 mL of placebo (omitting BKC) was used as such without any further dilution or addition.
Placebo spike with APIs Transferred accurately weighed 25mg of benzalkonium chloride in to a 50mL volumetric flask, about 30mL of HPLC grade Milli Q water was added and sonicated to dissolve, diluted up to volume with same solvent and mixed. Further 2.0 mL of this solution was diluted to 10mL with placebo solution and mixed.
14
J. MEHTA et al.
Precision The precision is the parameter that expresses the closeness of agreement (degree of scatter) between a series of measurement obtained from multiple analysis of the same homogenous sample under the prescribed conditions. Following types of precisions were studied and performed.
Instrumental precision (System suitability) The purpose of this experiment was to demonstrate the suitability of the HPLC system prior to start actual analysis of samples. Prepared the system suitability standard solution as mentioned (3.3) and injected five replicates injections of this solution. By recording chromatograms, measured the peak responses for interested analyte peak, and instrumental precision was demonstrated in terms of percentage relative standard deviation for area of analyte peak. Other parameters, like tailing factor and column efficiency in terms of theoretical plates of analyte peak was also observed.
Method precision (Repeatability) This experiment was conducted to prove the repeatability of the assay results obtained by this quantification methodology. For six consecutive times, a same system suitability standard solution (3.3) was injected and percentage standard deviation and relative standard deviation (R.S.D.) were observed. Method repeatability study can be found successful when, the R.S.D. value is smaller or equal than 1.5% for area of principal peak in each of the six sets.
Intermediate precision (Ruggedness) The study was performed to check and establish the effects of the random events on the analytical method. The intermediated precision was evaluated by analyzing a same sample by different analysts in two different days with different columns and different HPLC systems.
Stability of analytical solutions The aim of this study was to prove the stability of solutions, through out the analysis at 25 ºC. Prepared standard & sample solutions were injected on to the chromatograph and recorded the chromatograms at regular interval up to 35 hours and the results were found well within the acceptance criteria of 2.0% of deviation from initial results. Recorded the peak responses for the major peak and evaluated the percentage deviation of less than 1.5% in the peak response from initial for both standard and sample solution for BKC content. Table 1. Data of standard & sample solution stability. Time h Initial 3 7 11 15 19 23 27 31 35
Benzalkonium chloride (BKC) % deviation from initial % deviation from initial in standard solution in sample solution --1.2 -0.2 1.2 -0.4 1.0 -0.4 1.4 -0.2 1.5 -0.5 1.1 -0.2 1.0 -0.5 1.1 -0.1 1.1 -0.5
Development and Validation of a Precise Method
15
Linearity The linearity study verifies and approves that the sample solutions are in a concentration range where analyte response is linearly proportional to the concentration. This study was performed by evaluating the system and method linearity. Standard solutions of five concentration levels of BKC, from 50 to 150% (50, 75, 100, 125 and 150 mcg/mL) of the target analyte concentration, were prepared in triplicate at each level to perform the study. The results from experimental study were graphically plotted, obtained a calibration curve and the corresponding statistical study was carried out.
Accuracy (by recovery method) Accuracy of a method is defined as the closeness of the measured value to the true value for the samples. The recovery method was studied at concentration levels of 50, 100 and 150% of BKC into sample solution. Transferred accurately weighed 25 mg of benzalkonium chloride in to a 50 mL volumetric flask, about 30 mL of HPLC grade Milli Q water was added and sonicated to dissolve, diluted up to volume with same solvent and mixed. This recovery stock solution was suitably further diluted to get desired different concentrations over the range of 50 to 150%.
Robustness The robustness of an analytical procedure is a measure of its capacity to remain unaffected by small, but deliberate changes in method parameters and provides an indication of its reliability during normal day to day usage. The robustness of the method was demonstrated by performing the system suitability test as per the test method in normal condition and each altered condition mentioned below. 1. Changed the temperature of column by ± 5 °C. (i.e. 25°C and 35°C). 2. Changed the wavelength of detector by ± 2 nm (i.e. 208 nm and 212 nm). 3. Changed the flow rate of the mobile phase by ± 10% (i.e. 0.90 mL/min and 1.10 mL/min). 4. Changed the organic solvent ratio by ± 5% relative. 5. Changed the pH of Buffer by ± 0.2 units (i.e. 5.3 and 5.7) Table 2. Data of robustness study for BKC. % RSD Normal condition 0.2 Column temperature changed by –5 °C (i.e. 25°C) 0.2 Column temperature changed by +5 °C (i.e. 35°C) 0.1 Flow rate changed by –10% (i.e. 0.90 mL/min) 0.2 Flow rate changed by +10% (i.e. 1.10 mL/min) 0.2 Wavelength of detector changed by –2 nm (i.e. 208 nm) 0.2 Wavelength of detector changed by +2 nm (i.e. 212 nm) 0.2 Organic ratio of mobile phase changed by –5% relative 0.2 Organic ratio of mobile phase changed by +5% relative 0.1 pH of Buffer changed by -0.2 unit (i.e. 5.3) 0.2 pH of Buffer changed by +0.2 unit (i.e. 5.7) 0.8 Conditions
Tailing factor 1.46 1.48 1.40 1.47 1.47 1.46 1.46 1.51 1.29 1.45 1.59
Theoretical plates 10684 10421 9522 10688 10107 10682 10744 9591 6441 10905 5551
16
J. MEHTA et al.
Results and Discussion Method development A central composite design was used to analyze the influence of the chromatographic parameters and to optimize the simple and precise among all. Following parameters were examined; the amount of acetonitrile and phosphate buffer in the mobile phase, variation in column & column temperature and the buffer pH. No buffer pH below 2 was used to protect the column, so pH 5-8 was examined. As result of these serial experiences, Waters Spherisorb CN, (4.6 mm x 250 mm), 5µ m column and a mobile phase constituted from a mixture of foresaid buffer and acetonitrile (40:60) as organic modifier was found appropriate to obtain an adequate peak shape and shorter analysis time. The aim of development and validation study was to have a simple, specific, rugged and reproducible LC chromatographic method for quantification of BKC in pharmaceutical formulation of latanoprost ophthalmic solution.
Observation of Validation study Specificity / selectivity The observations from the chromatogram of BKC specificity study was that the component eluted at retention time of about 8.0min and the purity of the peak showed that the three spectrums obtained at different times are within the established threshold for this peak.No interferences with the analyte peaks due to placebo or mobile phase have been observed. On the basis of the study and above mentioned observations, the method established as specific for the quail-quantitative analysis of BKC in said formulation. The peak can be found improved when the peak purity angle is less than peak purity threshold or peak purity of analyte peaks is not less than 990, which indicates that the concern peak is pure. The purity factor for the drug assures that there is no co elution of other peaks. Therefore, the method was selective and suitable for its intended purpose.
Precision Instrumental precision (System suitability) Consecutive Five replicate injections of system suitability standard solution revealed that, by analyzing this method the desired suitability of HPLC instrument can be achieved through out the analysis. The % relative standard deviation of replicate injections were 0.2%. The effective ness of selected column was observed by getting average theoretical plates above 10000 and the tailing observed was about 1.4 for analyte peak. Table 3. Data of system suitability / Instrument precision study. No. of measurements 1 2 3 4 5 Mean SD % RSD Mean Tailing Mean Theoretical plates
Peak response 1190180 1190753 1183897 1190496 1190322 1189129 2932.91 0.2 1.5 10688
Development and Validation of a Precise Method
17
Figure 2. Standard system suitability chromatogram
Method Repeatability A RSD of 0.1% was obtained in this study, by injecting six sets of sample solution. %RSD for percentage assay results of six sample preparation should be not more than 2.0 for acceptance of repeatability. The very low %RSD was observed for the six assay results hence it concluded that the method is precise & reproducible for the analysis of said preservative content in this formulated form. Table 4. Data of method repeatability for BKC. Sample Precision set-1 Precision set-2 Precision set-3 Precision set-4 Precision set-5 Precision set-6 Mean % SD % RSD
% Assay 106.5 106.4 106.3 106.3 106.3 106.3 106.3 0.08 0.1
Intermediate precision (Ruggedness) The method can be accepted as rugged if the difference between percentage assay results of normal condition and altered condition is within 2.0%. The percentage assay of each sample was calculated and showed the precision by evaluating percentage relative standard deviation of assay results, for which % RSD observed was 0.8% and the difference observed between two conditions was 0.6%. Comparison of this results complied the mentioned criteria and method found very much rugged for analysis.
18
J. MEHTA et al.
Linearity The linearity was determined as linear regression with least square method on standard solution. Concentration levels were 50, 75, 100, 125, 150% of the claimed analyte concentration, corresponding to the range of about 50–150 mcg/mL. The calibration curve obtained by plotting the BKC peak, area versus the concentration of standard solution was found linear in the mentioned concentration range of 50% to 150%. For acceptance of linearity, correlation coefficient of linearity curve shall not be less than 0.990 and Yintercept bias can not be within ±2.0 % of 100% linearity level response. The results indicated that the method is linear up to the specified range of concentrations. Table 5. Data of linearity study: (Correlation coefficient should not less than 0.990). BKC Conc., mcg/mL Mean areas 50 50.328 587556 75 75.491 888158 100 100.655 1184149 125 125.819 1482936 150 150.983 1777390 Correlation coefficient 1.0000
Area
Conc. %
2000000 1750000 1500000 1250000 1000000 750000 500000 250000 0 0
50
100
150
200
Concentration, mcg/mL
Figure 3. Linearity curve of preservative analogue benzalkonium chloride (BKC).
Accuracy The accuracy of the method was determined by measuring the drug recovery and by study of stock recovery solution. The study was performed in order to determine eventual positive or negative interferences produced by the excipients in the formulation. The results obtained for the accuracy study in the samples ranging a BKC concentration between 50, 100 and 150ppm and being the 100% corresponding to 100ppm. (n=6 for 50%, 100% and 150%) indicated that the recovery percentage was between 98.5% and 102.0% of injected. The results were found within the acceptance criteria with acceptable %RSD of within 2.0% at each level. The recovery at each level were between 98.0 to 102.0% which indicated that the method is appropriate to produce accurate estimation of BKC preservative analogue in said formulation.
Robustness The quantification was carried out with minor but deliberate changes in the parameters i.e. detection wavelength, column temperature, pH of mobile phase, change in organic solvent ratio etc. of analytical methodology, and system suitability parameters e.g. theoretical plates, tailing, %RSD were observed and found good with all the altered conditions.
Development and Validation of a Precise Method Table 6. Data of Accuracy (by recovery) study. Recovery level/set Recovery, % Average Recovery, % 50% set-1 100.98 101.36 50% set-2 101.84 50% set-3 101.27 100% set-1 101.03 100% set-2 100.27 100.85 100% set-3 101.24 150% set-1 98.99 150% set-2 98.83 98.66 150% set-3 98.18
Sample-50%
Sample-100%
Sample-150%
Figure 4. Chromatogram of BKC at 50, 100 & 150%.
RSD, % 0.4
0.5
0.4
19
20
J. MEHTA et al.
Conclusion A reversed phase liquid chromatographic analytical quantification methodology of benzalkonium chloride (BKC) preservative content in pharmaceutical formulation latanoprost ophthalmic solution (eye drop) is developed and validated successfully. This method has significant advantages, in terms of shorter analysis time, selectivity and accuracy then previously reported. The extraction method gave consistent and reproducible recovery for analyte from formulated preparation, with no interference and matrix suppression. The validation study indicates that method can be considered suitable for carrying out quality control & routine use for quantification of foresaid preservative component with said formulation.
Acknowledgement All raw data form the validation work archived at Cadila Pharmaceutical Ltd. All the validation work performed at Analytical Research Laboratory, Cadila Pharmaceutical Ltd, Dholka, India. The authors are thankful to M/s Cadila Pharmaceuticals LTD, Dholka, India for providing facilities and infrastructure for the study. Author greatly acknowledges Mr. Niranjan Vyas for their constant encouragement and support.
References 1. 2. 3. 4. 5. 6. 7.
8. 9.
http://en.wikipedia.org/wiki/Quaternary_ammonium_compound. Parhizkari G, Delker R B, Miller and Chen C, Chromatographia, 1995,40(3-4), 155-158. Gomez-Gomar A, Gonzalez-Aubert M M, Garces-Torrents J and Costa-Segarra J, J Pharmaceut Biomed Anal., 1990, 8(8-12), 871-876. Ya-Hui Hou, Chien-Yi Wu and Wang-Hsien Ding, J Chromatogr. A, 2002, 976(1-2), 207-213. Louis-Philippe Labranche, Suzanne N. Dumont, Suzanne Levesque and Alain Carrier, J Pharmaceut Biomed Anal., 2007, 43(3), 989-993. Jadwiga Dudkiewicz-Wilczyska, Jadwiga Tautt and Iza Roman, J Pharmaceut Biomed Anal., 2004, 34(5), 909-920. Klaus Kümmerer, Andreas Eitel, Ulrich Braun, Peter Hubner, Franz Daschner, Georges Mascart, Milena Milandri, Franz Reinthaler and Jan Verhoef, J Chromatogr.A, 1997,774(1-2), 281-286. Lee Elrod Jr., Timothy G Golic and James A Morley, J Chromatogr. A, 1992, 625(2), 362-367 ICH, Validation of Analytical Procedure: Methodology, ICH Harmonised Tripartite Guidelines, Adopted, November 6, 1996.
International Journal of
Medicinal Chemistry Hindawi Publishing Corporation http://www.hindawi.com
Volume 2014
Photoenergy International Journal of
Organic Chemistry International Hindawi Publishing Corporation http://www.hindawi.com
Volume 2014
Hindawi Publishing Corporation http://www.hindawi.com
Volume 2014
International Journal of
Analytical Chemistry Hindawi Publishing Corporation http://www.hindawi.com
Volume 2014
Advances in
Physical Chemistry Hindawi Publishing Corporation http://www.hindawi.com
Volume 2014
International Journal of
Carbohydrate Chemistry Hindawi Publishing Corporation http://www.hindawi.com
Journal of
Quantum Chemistry Hindawi Publishing Corporation http://www.hindawi.com
Volume 2014
Volume 2014
Submit your manuscripts at http://www.hindawi.com Journal of
The Scientific World Journal Hindawi Publishing Corporation http://www.hindawi.com
Journal of
International Journal of
Inorganic Chemistry Volume 2014
Hindawi Publishing Corporation http://www.hindawi.com
Volume 2014
Theoretical Chemistry Volume 2014
Catalysts Hindawi Publishing Corporation http://www.hindawi.com
International Journal of
Electrochemistry Hindawi Publishing Corporation http://www.hindawi.com
Volume 2014
Chromatography Research International
Journal of
Journal of Hindawi Publishing Corporation http://www.hindawi.com
Hindawi Publishing Corporation http://www.hindawi.com
Volume 2014
Spectroscopy Hindawi Publishing Corporation http://www.hindawi.com
Analytical Methods in Chemistry
Volume 2014
Hindawi Publishing Corporation http://www.hindawi.com
Volume 2014
Journal of
Applied Chemistry Hindawi Publishing Corporation http://www.hindawi.com
Volume 2014
Journal of
Bioinorganic Chemistry and Applications Hindawi Publishing Corporation http://www.hindawi.com
Volume 2014
International Journal of
Chemistry Hindawi Publishing Corporation http://www.hindawi.com
Volume 2014
Spectroscopy Volume 2014
Hindawi Publishing Corporation http://www.hindawi.com
Volume 2014