Development and validation of a derivative ultraviolet spectrophotometric method for the determination of darifenacin in tablets using experimental designs and ...
ISSN 1061�9348, Journal of Analytical Chemistry, 2013, Vol. 68, No. 9, pp. 772–780. © Pleiades Publishing, Ltd., 2013.
ARTICLES
Development and Validation of a Derivative Ultraviolet Spectrophotometric Method for the Determination of Darifenacin in Tablets Using Experimental Designs and Its Comparison with Chromatographic Method1 L. Z. Meneghini, C. A. Junqueira, F. R. Salazar, M. Brandalise, P. E. Fröehlich, and A. M. Bergold Programa de Pós�Graduação em Ciências Farmacêuticas, Faculdade de Farmácia, Universidade Federal do Rio Grande do Sul�UFRGS Av. Ipiranga, 2752, CEP 906610�000, Porto Alegre, RS, Brasil Received April 10, 2011; in final form October 22, 2012
Abstract—A set of experimental designs was applied to develop and validate a spectrophotometric method using derivative transformation coupled with zero�crossing methodology for the quantification of darifenacin hydrobromide in extended�release tablet form. In the presence of the matricial interference, a central com� posite (face�centered) design was necessary to reach the best condition without interference in the quantifi� cation. The optimal system was confirmed using the function named Derringer’s desirability to assess high precision and low quantification limit. The best condition pointed was the first order to derivative transfor� mation, Δλ = 4, scale factor 150, scanning speed 280 nm/s and anulation point in 239.4 nm as wavelength. From these parameters it was possible to perform the method validation resulting in R2 = 0.999, concentra� tion ranging from 0.10 to 2.50 μg/mL, recovery 98.65% and mean precision 97.67% (RSD = 0.0136). Addi� tionally, robustness was assessed by a Plackett−Burman design, and no significant variability was obtained. The spectrophotometric method was compared with high�performance liquid chromatography method, resulting in no significant difference between the methods. Keywords: drug�analysis, darifenacin, derivative transformation, central composite design, Plackett�Burman DOI: 10.1134/S1061934813090086 1
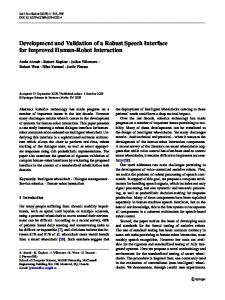
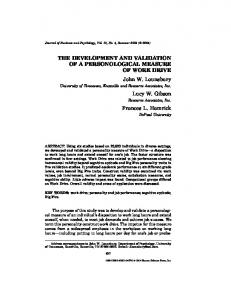
Darifenacin (DF) is an antimuscarinic drug, chem� ically (S)�2�{1�[2�(2,3�dihydrobenzofuran�5�yl)eth� yl]�3�pyrrolidinyl}�2,2�diphenylacetamide, used for the overactive bladder, available as its hydrobromide salt (Fig. 1) in extended�release tablet with 7.5 or 15 mg of the drug [1]. There are literature reports on using high�performance liquid chromatography for the determination of darifenacin in plasma and assess� ment enantiomeric purity [2⎯4] but assay by spectro� photometric methods has not been shown. Ultravio� let/visible (UV/Vis) absorption spectrophotometry is a standard method for drug release measure used for the in vitro study where faster (large number of samples) and more sensitive method (low levels of concentra� tion) is necessary. The development and validation of an alternative method for the HPLC method is impor� tant in quality control [5]. For DF, zero order spec� trum demonstrated two wavelengths maxima (205 and 284 nm), but the presence of many excipients (mainly colorants used in tablet coating) and interference in all the extension of the spectrum makes quantification impossible (Fig. 2). Hence, derivative spectrophotom�
etry was used. Zero�crossing measurement technique is usually employed in pharmaceutical analysis [6, 7], but the optimization of the other factors involved in the method (derivative order, Δλ, and so on) necessary to develop a specific and sensitive method [8, 9]. When there are many factors which can influence the re� sponse, design of experiments (DOE) is the best choice to find the optimum system [10, 11]. In the lit� erature there are many approaches with DOEs, mainly using response surface methodology [12⎯14]. In the present work the aim was the development and valida� tion of an ultraviolet detection (UVD) method using central composite design (CCD) face�centered to ob�
O N O
HBr
NH2
Fig. 1. Darifenacin hydrobromide (molecular weight 507.5).
1 The article is published in the original.
772
DEVELOPMENT AND VALIDATION OF A DERIVATIVE ULTRAVIOLET
773
1.500
Absorbance
A 1.000
0.500
0 190
B
250
300 Wavelength, nm
350
400
Fig. 2. Profiles of the darifenacin hydrobromide (A) and matrice (B) in methanolic solutions.
tain low quantification limit without matrice interfer� ence. Additionally, a Plackett−Burman (PB) design was used for robustness study. The UVD method was validated and compared with stability�indicating HPLC/UV method validated previously [15]. MATERIAL AND METHODS Instrumentation and softwares. The UVD method was developed and validated with a Shimadzu UV/Vis double beam spectrophotometer model UV�1601 us� ing a UVPC 3.91 software version for data collection. Shimadzu chromatographic system with LC20A bina� ry pump, SPD�AVvp UV/Vis photodiode array detec� tor, SIL 20�AC autosampler and CTO20A oven and a LC Agilent 1100 series (quaternary pump) coupled MS/MS API 5000 (LINAC) with electrospray ioniza� tion were used for chromatographic analysis. To per� form the chromatographic runs, a Shimadzu C8 col� umn (150 mm × 4.6 mm, 5 μm) was used. The experimental designs were analyzed by De� sign�Expert® 7.0.0 version (Stat�Ease Inc., USA), and the other statistical tests by Minitab® 15.0 version (Stat�Soft Inc., USA). Chemicals. Darifenacin hydrobromide (99.70%) was donated by Labex Inc. (USA). Methanol and ace� tonitrile of HPLC grade are from J.T. Baker (USA); methanol of spectroscopic grade is from Merck (Ger� many) and Vetec; orthophosphoric acid was obtained from Merck (Germany). The cellulose filters were purchased from Millipore (USA). Samples. The identity of darifenacin hydrobromide was confirmed by mass spectrometry, infrared spec� trometry and polarimetry. The stability of the samples (reference substance and tablet) in methanolic solution under refrigeration condition (5°C, 30 days) and room temperature (two days) were assessed by mass spec� trometry. Central composite design. Initially a full factorial design was applied to determine which factors were JOURNAL OF ANALYTICAL CHEMISTRY
Vol. 68
significant for the quantification limit. In a full facto� rial 2k, k is a number of factors (categorical or numer� ical type) and 2 is the respective number of levels for each factor. It was employed a 24 design with scanning speed, derivative order, scale factor and Δλ as factors, like shown in Table 1, was employed. From three cali� bration curves (six concentrations, 5.0, 10.0, 15.0, 20.0, 25.0, 30.0 μg/mL), minimum squared ordinary was applied and 16 curves were obtained. From curves, the limit of quantification (LQ) was calculated by the following equation: SDLQ = 10.0 × s/S,
(1)
where SDLQ is the calculated LQ, s is the standard de� viation of the response (blank) and S is the slope of calibration curve. After the selection of the significant factors, a CCD with four factorial points, four axial points (positioned in α = 1.000), and five central points in an overall of the thirteen runs were carried out. CCD is a kind of design where the best response can be obtained by a polynomial function (linear, qua� dratic and sometimes cubic order) and a response sur� face is built from the best polynomial function adjust� ed. So, the polynomial model obtained from CCD ex� plains the influence of the factors on responses, and this relationship can be evaluated graphically by a sur� face response. The International Conference on Har� monization (ICH) defines the LQ as the lowest amount that can be used with adequate precision [16]. For this purpose, two responses were analyzed: LQ and relative standard deviation (RSD) calculated from an assay with tablets powder. Then, considering two responses, the function named Derringer desirability, D, is applicable to find the optimum condition. The Derringer’s desirability function is determined as the geometric mean, weighted, or otherwise, of the indi� vidual desirability functions [17]. The expression for this function is:
D = ⎡⎣d1p1 × d 2p2 × d 3p3 × ...d npn⎤⎦ No. 9
2013
1n
,
(2)
774
MENEGHINI et al.
Table 1. Full factorial design 24 domain Factors and levels1 Runs 1 2 3 4 5 6 7 8 9 10 11 12 13 14 15 16
Response3
Order2
Δλ2
Scale factor2
Scanning speed2
LQ
1.00(–) 3.00(+) 1.00(–) 3.00(+) 1.00(–) 3.00(+) 1.00(–) 3.00(+) 1.00(–) 3.00(+) 1.00(–) 3.00(+) 1.00(–) 3.00(+) 1.00(–) 3.00(+)
2.00(–) 2.00(–) 4.00(+) 4.00(+) 2.00(–) 2.00(–) 4.00(+) 4.00(+) 2.00(–) 2.00(–) 4.00(+) 4.00(+) 2.00(–) 2.00(–) 4.00(–) 4.00(–)
50.00(–) 50.00(–) 50.00(–) 50.00(–) 100.00(+) 100.00(+) 100.00(+) 100.00(+) 50.00(–) 50.00(–) 50.00(–) 50.00(–) 100.00(+) 100.00(+) 100.00(+) 100.00(+)
40.00(–) 40.00(–) 40.00(–) 40.00(–) 40.00(–) 40.00(–) 40.00(–) 40.00(–) 280.00(+) 280.00(+) 280.00(+) 280.00(+) 280.00(+) 280.00(+) 280.00(+) 280.00(+)
0.08 1.33 0.08 2.01 0.09 2.05 0.08 1.16 0.18 1.52 0.08 1.98 0.06 2.34 0.07 0.83
1⎯ –, +, 0 are “low” and “high” levels, respectively; 2—undimensional units; 3⎯in µg/mL.
where pn (p1, p2, p3, …) is the weight of the response, n the number of responses and dn is the individual de� sirability function of each response obtained from the transformation of the individual response of each ex� periment. The scale of the individual desirability func� tion ranges between dn = 0, for a completely undesired response, to dn = 1, for a fully desired response. The D value is related to the combination of the different criteria (dn); D value close to zero implies that all re� sponses are in an undesirable region simultaneously; a value of D close to 1 implies an optimum region. Ad� ditionally, the factors and responses can be normalized by weight and importance and the function possesses a goal that can be adjusted to minimize, maximize or tar� get the factors and responses. Validation. The validation was carried out in accor� dance with the International Conference on Harmo� nization (ICH) guidelines and United States Pharma� copeia (USP 31). Linearity and range. For the linearity experiments, solutions of DF were prepared at seven concentrations (0.10, 0.50, 0.90, 1.30, 1.70, 2.10, 2.50 μg/mL) span� ning a range of 25–175% of the target DF assay con� centration (1.30 μg/mL). Ordinary least�squares method was applied to calibration curve construction y = ax ± b. The model was evaluated by determination coefficient regression significance, lack�of�fit, and re� sidual analysis. Precision. 50 tablets were weighed and finely pow� dered. A portion of the powder was accurately
weighed, placed for 15 min in ultrasound bath and di� luted to 1.30 μg/mL in methanol. Then the samples were filtered on cellulose membrane before quantifi� cation. Nine experiments were carried out in triplicate in 3 different days and by different analysts. The RSD was assessed for the repeatability and intermediate precision. Accuracy. Accuracy of the method was calculated as a percentage of recovery by the assay of the known added amount of analyte in the samples. The concen� trations were 75, 100 and 125% of nominal concentra� tion. The recoveries were evaluated by RSD. Limit of detection (LOD) and limit of quantification (LOQ). LOQ was determined by equation (1) previ� ously mentioned. This limit was subsequently validat� ed by the assay of a set of samples. In the same way, LOD have been estimated by the following equation: SDLOD = 3.3 × s/S,
(3)
where s is the standard deviation of the response (blank) and S is the slope of calibration curve. Robustness. The centered Plackett−Burman design was constructed with 11 factors performed in 16 runs (Table 2), but 7 factors, named dummy factors repre� sent unreal physical change. Nominal levels are the conditions used for the method validation. Pareto chart (with t statistics) and half�normal probability plot were used to indicate relevant effects. Comparison of methods. The present UVD meth� od was compared with stability�indicating
JOURNAL OF ANALYTICAL CHEMISTRY
Vol. 68
No. 9
2013
DEVELOPMENT AND VALIDATION OF A DERIVATIVE ULTRAVIOLET
775
Table 2. Factors and levels investigated in the Plackett�Burman design Levelsa Factors
Units (–1)
A: Wavelength B: Scanning speed C: Cuvette typeb D: Solventc E�L: Dummies 1–7
nm nm/min Categoric Categoric
239.2 260 Type I Supplier I –
–
(+1)
(0)
239.6 300 Type II Supplier III –
239.4 280 Quartz Supplier II –
Note: ⎯ –1, +1, 0 are “low”, “high” and nominal levels, respectively; b⎯type I: plastic, 1.5 mL capacity, for wavelength range 200– 400 nm; type II: plastic, 0.75 mL capacity, for wavelength range 205–800 nm; c⎯supplier I: Merck, spectroscopic grade; sup� plier II: Vettec, spectroscopic grade; supplier III: J.T. Backer, HPLC grade. a
HPLC/UV method previously validated [15]. The parameters used for the HPLC/UV method were C8 column (150 mm × 4.6 mm, 5 μm), 205 nm (wave� length), 1.1 mL/min flow rate, mobile phase with ac� etonitrile and orthophosphoric acid (pH 3.0, 0.01%, v/v) in a ratio 28 : 72 and column maintained at room temperature (25 ± 1°C). The USP considers neces� sary to compare two methods to determine if their av� erage results or their variability differ by an amount that is deemed important. One way of two methods comparison is the precision evaluation. An alternative method can be considered to have “comparable” pre� cision with a current method if its precision differs from the one of the current method only by acceptable difference. An increase in variability can lead to an in� crease in the number of results expected to fail re� quired specifications. For this, statistical inference must be done with adequate confidence level (1 – α) and power level (1 – β) to obtain a parameter of the largest acceptable difference (δ) between current method and alternative method (in this case, HPLC/UV and UVD, respectively). So, an initial study using 20 samples was used to predict adequate power level. Later, using a larger number of samples (N), the differences between the methods were assessed by t�test (4), F�test (5.0), confi� dence interval limit for the ratio of variance (5.1) and δ (6.0–6.2) using the following equations: x −µ t cal = , (4) n1
∑( X i =1
n2
− X) + 2
i
∑( X
− X ) (n1 + n2) 2
i
j =1
where tcal is the calculated value to the Student t�test, x is the current method mean, μ is the alternative method mean and denominator is the combined stan� dard deviation two methods,
Fcal = S12 S 22 , UL = Fcal/F0.95,
(5.0) (5.1)
where Fcal is the calculated value for the F�test, S12, S22 are the variance between alternative and current meth� od, respectively. UL is the calculated upper limit, Fcal JOURNAL OF ANALYTICAL CHEMISTRY
Vol. 68
as described previously and F0.95 is the value from F distribution. Moreover, for the δ calculation, dA = 110 – (x + K × s),
(6.0)
δB = (x − K × s) − 90,
(6.1)
δcal = x ± δ A,B,
(6.2)
where δA, δB are the acceptable differences consider� ing the lower and the higher specification limit for the assay, respectively; x, s are the current method mean and the standard deviation, respectively; K is tabulated value based on the K distribution under a specific level of confidence, δA, B is the lower difference obtained from δA or δB and δcal is the interval for the largest ac� ceptable difference between the methods. RESULTS AND DISCUSSION The variation results from UVD method develop� ment are shown in Fig. 3. The wavelengths where the annulation point was found for quantification were 239.4, 232.0 and 296.4 nm for the first, second and third order, respectively. With the results from explor� atory study 24 (Table 1) it is possible to notice that the lower LQ is present in runs with first order. Scan veloc� ity did not present significant changes in LQ. The low� est order value and the highest values of scale factor and Δλ reduced the LQ. In the next stage, the CCD was performed with two factors (order and scale factor). This way, a new set of curves was carried out and additionally thirteen runs were obtained (Table 3). Also, for more complete as� sessment, an assay (N = 9) was carried out for the RSD evaluation. The response surfaces from CCD are shown in Figs. 4 and 5. The model from LQ response was adjusted to a linear function and RSD to a qua� dratic function. The lowest LQ was obtained using transformation with first order and 150 as scale factor; the highest with third order and 50 as scale factor. The response surface in Fig. 4 demonstrated that the order caused a curvature reducing the LQ in bigger propor� tion than second order did. This is probably because No. 9
2013
776
MENEGHINI et al. (a)
(b)
0.4 Absorbance
Absorbance
1.4 0
B
A
0.2 B
0
A –7.0 225
230
240 250 Wavelength, nm
–0.4 225
(c)
0.4
39 A
0.2
Absorbance
Absorbance
260
B
0
–0.4 280
290 300 Wavelength, nm
310
230 235 Wavelength, nm (d) 1
2 0 –21 190
240
3
300 350 250 Wavelength, nm
400
Fig. 3. Amplified zoom showing reference substance (A) and matrice (B) both in methanolic solution in first�order derivative (a), second�order derivative (b) and third�order derivative (c); reference substance in methanolic solution for the different derivative orders (d), where 1, 2, 3 are for the 1st, 2nd and 3rd derivative order, respectively.
the annulation point in third order is located in spec� tral region where the signal is low. However, when the RSD are compared (Fig. 5), the worst result is demon�
Table 3. Central composite design domain Factors and levels1 Runs 1 2 3 4 5 6 7 8 9 10 11 12 13
Responses
Order
Scale factor
LQ2
RSD3
1.00(–) 3.00(+) 1.00(–) 3.00(+) 1.00(–) 3.00(+) 2.00(0) 2.00(0) 2.00(0) 2.00(0) 2.00(0) 2.00(0) 2.00(0)
50.00(–) 50.00(–) 150.00(+) 150.00(+) 100.00(0) 100.00(0) 50.00(–) 150.00(+) 100.00(0) 100.00(0) 100.00(0) 100.00(0) 100.00(0)
0.24 2.34 0.08 1.31 0.12 1.67 2.07 0.27 0.41 0.49 0.61 0.76 0.61
0.01 0.04 0.01 0.04 0.01 0.04 0.07 0.06 0.06 0.06 0.05 0.06 0.06
Note: 1⎯ –, +, 0 are “low” and “high” levels, respectively; 2⎯in μg/mL; 3⎯in fractional form.
strated when the transformation uses the second order. This fact can be attributed to low reproducibility of the signal form produced after the transformation. The best condition was confirmed only using a Derringer function (Fig. 6) with the parameters dem� onstrated in Table 4. This condition was established with four solutions, three being for the first order (D about 0.9) and one for the third order (D about 0.5). The highest D (0.990) was found using first order and scale factor of 150. The validation was carried out using first order, Δλ = 4, scale factor of the 150, 280 nm/s as scanning speed and λ = 239.4. The results are shown in Table 5. Overall, the results are in accordance with the official guide and compendia [17, 18]. The dif� ference between approaches for the quantification limit was minimal, and the adequate precision was only possible with concentration of 1.0 μg/mL. No significant difference exists when changes in method are applied to assay, like is demonstrated in the results from Plackett−Burman design (Fig. 7). When the dummy factors are caught off from statistical analysis, the real factors remain insignificant on assay content (data not shown). A correct comparison of methods is critical and there are multiple approaches, including general ap� proach in analytical chemistry and specific require� ments in pharmaceutical applications [19]. Classical
JOURNAL OF ANALYTICAL CHEMISTRY
Vol. 68
No. 9
2013
DEVELOPMENT AND VALIDATION OF A DERIVATIVE ULTRAVIOLET
777
3.80 2.85 1.90 LQ
0.95 0 3.00 2.5
50 75
2.0 100
1.5
Order
125
1.0
Scale
150
Fig. 4. Response surface to quantification limit (LQ), derivative order (order) and scale factor (scale).
6.600 5.175 3.750 RSD
2.325 0.900 150 125 100 Scale
75 50
1.5
1.0
2.0
2.5
3.0
Order
Fig. 5. Response surface to relative standard deviation (RSD), derivative order (order) and scale factor (scale).
statistical tests like F� and t�tests are generally em� ployed, where the pointed analysis (comparison be� tween absolute means or variances) is considered [19, 20]. However, in the pharmaceutical analysis, specif� ically USP approach, the comparison between alter�
native and current method can be done using inter� vals. The present results (Table 6) showed no signifi� cative difference by the t�test and F�test (considering p�value). However, F�test considering the UL param� eter (USP approach) showed a larger tolerance inter�
Table 4. Parameters used to built the Derringer’s desirability Criteria Response/parameter LQ RSD Order Scale factor
Lower limit 0.07 1.00 1.00 50
Upper limit 2.35 6.50 3.00 150
JOURNAL OF ANALYTICAL CHEMISTRY
Vol. 68
No. 9
Goal
Importance
Weigths
minimize minimize in range in range
4 4 default default
default default default default
2013
778
MENEGHINI et al.
1.00 0.75 0.50 Desirabilty 0.25 0 1.00 1.5 2.0 Order
125 2.5 3.0
50
75
150
100 Scale
Fig. 6. Response surface to Derringer’s desirability.
val for variance, but transforming this parameter to RSD, UVD did not exceed 0.02 value, which is the ac� cepted value in this analytical field. The determination of δ was shown to be very important because the inter�
vals used in the assay for the current method (HPLC/UV, 90.0–110.0%) for mean and precision were adjusted by it (UVD, 93.4−100.3%). Finally, as is emphasized by USP, choosing of sample size (N) is es�
Table 5. Validation for the UVD method Model assessment Parameter
Statistical test1
Linearity (N = 21) Calculated value
Parameter
CL5
p�value1
– ±0.0008 ±0.0005
– 0.81