Budavari S. The Merck Index. 12th ed. New Jersey, USA: Merck and. Co., Inc.; 1996. p. 1564, 3630. 2. Martindale. The Complete Drug Reference. 32nd ed.
Origi n a l A rt i c l e
Abstra ct
Development and validation of zeroand first-order derivative area under curve spectrophotometric methods for the determination of entacapone in bulk material and in tablets
S. S. Chalikwar, A. A. Shirkhedkar, M. A. Bagul, P. S. Jain, S. J. Surana R. C. Patel Institute of Pharmaceutical Education and Research, Shirpur Dist, Dhule, Maharashtra, India Address for correspondence: Mr. S. S. Chalikwar, R. C. Patel Institute of Pharmaceutical Education and Research, Shirpur Dist, Dhule, Maharashtra - 425 405, India. E-mail: pharmashailesh@ rediffmail.com Access this article online Website:
www.phmethods.org
DOI: 10.4103/2229-4708.97709 Quick response code
Aim: The aim of this work is to establish two simple, economical, and rapid spectrophotometric methods for the quantification of entacapone in bulk material and in tablets. Further, this study is designed to validate the developed methods as per ICH guidelines. Materials and Methods: In Methods I and II, a stock standard solution was prepared by dissolving 10 mg of entacapone in 100 mL of 10% v/v acetonitrile to obtain a concentration of 100 µg/mL. After suitable dilution, 10 µg/mL of entacapone was prepared and scanned in the UV-visible range 500–200 nm; entacapone showed a maximum absorbance at 384.40 nm. In Method I, area under curve (AUC) of the zero-order spectrum was recorded between 348.00 and 410.20 nm. While, in Method II, zero-order spectra were derivatized into first-order, and the AUC was recorded between 386.40 and 460.20 nm. For a linearity study, series of dilutions were prepared from stock solutions. Results: In Method I, and II, entacapone followed linearity in the concentration range of 2–12 µg/mL and 5–30 µg/mL with (r2>0.999). The amounts of entacapone estimated by both these methods were found to be 99.24 ± 0.054 and 98.68 ± 1.04, respectively. Conclusion: The developed methods are simple, precise, rugged, robust, and economical. Both these methods can be used for routine analysis of entacapone from its tablet formulation. Key words: Area under curve spectrophotometry, derivative-spectrophotometry, entacapone
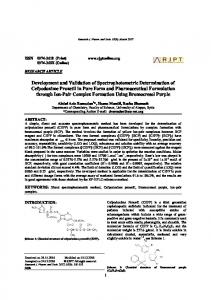
INTRODUCTION Entacapone is used as an adjunct to levodopa and carbidopa in the treatment of Parkinson’s disease.[1] Chemically entacapone Figure 1 is known as 2-cyano3-(5-dihydroxyamino-3,4-dioxo-1-cylcohexa-1, 5-dienyl)-N,N-diethyl-prop-2enamide.[2] A literature survey revealed a few methods such as HPLC,[3,4] stability-indicating LC,[5] and UV-spectrophotometric[6-9] methods for the determination of entacapone in bulk material and in tablets. In this work two simple, economical, and rapid spectrophotometric methods have been established for the quantification of entacapone in bulk material and in tablets. The developed methods were validated for accuracy, precision, ruggedness, and sensitivity. Accordingly, the objective of this study was to develop and validate the simple spectrophotometric method for the estimation of entacapone hydrochloride in bulk and tablets as per ICH guidelines.[10]
Pharmaceutical Methods | January-June 2012 | Vol 3 | Issue 1
14
Chalikwar, et al.: AUC-spectrophotometric methods for entacapone
flasks and diluted up to mark using the same solvent to obtain a concentration in the range of 2–12 µg/mL. The solutions were scanned on a spectrophotometer in the range of 500–200 nm. The calibration curves were plotted concentrations versus AUC between 348.00 nm and 410.20 nm (Method I). While in Method II, an appropriate amount of aliquots portion in the range of 0.5–3.0 mL were transferred into a series of 10 mL volumetric flasks and diluted up to the mark using the same solvent to obtain concentration in the range of 5–30 µg/mL. The calibration curve was plotted as concentration versus AUC between 386.40 and 460.20 nm (Method II). Figure 1: Chemical structure of entacapone
MATERIALS AND METHODS Materials Entacapone was a gift sample from Wockhardt Pharmaceuticals, Aurarangabad. All chemicals and reagents used were of analytical grade and purchased from Qualigens Fine Chemicals, Mumbai, India. Instrument A double beam UV-VIS spectrophotometer (UV-2450, Shimadzu, Japan) connected to computer loaded with spectra manager software UV Probe with 10 mm quartz cells was used. The spectra were obtained with the instrumental parameters as follows: Wavelength range: 200–500 nm; scan speed: Medium; sampling interval: 1.0 nm. All weights were taken on an electronic balance (Model Shimadzu AUX 120). Preparation of stock standard solution and selection of wavelengths A stock standard solution was prepared by dissolving 10 mg of entacapone in a 100 mL of 10% v/v acetonitrile to obtain a concentration of 100 µg/mL. From it, an appropriate concentration of 10 µg/mL was prepared and scanned in the UV-visible range 500–200 nm; entacapone showed a maximum absorbance at 384.40 nm. In Method I, area under curve (AUC) of the zero-order spectrum was recorded between the 348.00 and 410.20 nm. While, in Method II, zero-order spectra were derivatized into first-order and the AUC was recorded between 386.40 and 460.20 nm. Validation of the method Study of linearity curves
From the stock standard solution, an appropriate amount of aliquots portion in the range of 0.2–1.2 mL were transferred into a series of 10 mL volumetric 15
Recovery studies
To the pre-analyzed sample solutions, a known amount of stock standard solution was added at different levels, i.e. 80%, 100%, and 120%. The solutions were re-analyzed by the proposed methods. Precision
Precision of the methods was studied as intra-day and inter-day variations. In Method I, precision was determined by analyzing the 4, 6, and 8 µg/mL of entacapone solutions as intra-day and inter-day variations. In Method II, precision was determined by analyzing the 15, 20, and 25 µg/mL of entacapone solutions as intra-day and inter-day variations. Sensitivity
The sensitivity of measurements of entacapone by the use of the proposed methods was estimated in terms of the limit of quantification (LOQ) and the limit of detection (LOD). The LOQ and LOD were calculated using equation LOD=3.3 × N/B and LOQ=10 × N/B, where ‘N’ is the standard deviation of the AUC of the drugs (n=3), taken as a measure of noise, and ‘B’ is the slope of the corresponding calibration curve. Repeatability
Repeatability was determined by analyzing 6 and 20 µg/mL concentration of entacapone solution for six times for Methods I and II, respectively. Ruggedness
Ruggedness of the proposed methods was determined for 6 and 20 µg/mL concentrations of entacapone by analysis of aliquots from a homogenous slot by two analysts using the same operational and environmental conditions for Methods I and II, respectively.
Analysis of marketed formulation Twenty tablets were accurately weighed, average weight determined and ground into fine powdered. Pharmaceutical Methods | January-June 2012 | Vol 3 | Issue 1
Chalikwar, et al.: AUC-spectrophotometric methods for entacapone
A quantity of powder equivalent to one tablet was transferred into a 100 mL volumetric flask containing 30 mL of 10% v/v acetonitrile, sonicated for 15 min, the volume was adjusted to the mark using the same solvent and filtered through Whatman filter paper no. 41. An appropriate volume 1.0 mL was transferred into a 10 mL volumetric flask and the volume was adjusted to the mark to obtain the desired concentration of 10 µg/mL. The AUC was recorded at selected wavelengths for Method I. While in Method II, AUC of the first-order derivative spectrum was recorded in between selected wavelength ranges. The concentration of the drug was determined from the respective linear regression equations.
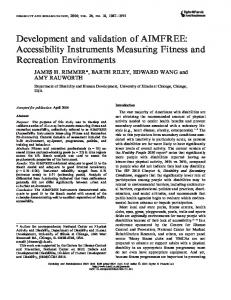
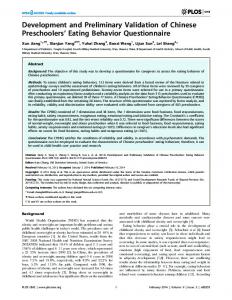
RESULTS AND DISCUSSION Selection of wavelengths Figures 2 and 3 show the selection of wavelengths in Methods I and II, respectively. The selection of wavelengths in both the methods is based on the reproducibility of the results. Linearity studies The linear regression data for the calibration curves showed a good linear relationship over the concentration range 2–12 µg/mL for Method I and 5–30 µg/mL for Method II. The results are expressed in Table 1. Accuracy The pre-analyzed sample used in Methods I and II was 4 and 10 µg/mL, respectively. In Method I, the mean % recovery was found to be in the range of 99.98–100.06%. While in Method II, it was found to be in the range of 99.35–100.31% [Table 2]. Precision The precision of the developed method was expressed in terms of % relative standard deviation (% RSD). These results show reproducibility of the assay. The % RSD values found to be less than 2 indicate that the methods were precise for the determination of drugs in formulation [Table 3].
Figure 2: UV-spectrum of entacapone in 10% v/v acetonitrile
Sensitivity The LOD and LOQ for entacapone were found to be 0.21 and 0.62 μg, respectively, for Method I. For Method II, they were found to be 0.49 and 1.42 μg, respectively. Table 1: Optical characteristics and linearity data of entacapone
Parameters Linearity range (μg/mL) Selected range (nm) for AUC Slope Intercept Correlation coefficient Limit of detection (μg) Limit of quantitation (μg)
Method I 2–12 348.00–410.20 1.1965 1.3627 0.999 0.21 0.62
Table 2: Accuracy % Value
Figure 3: First-order derivative spectrum of entacapone in 10% v/v acetonitrile Pharmaceutical Methods | January-June 2012 | Vol 3 | Issue 1
80 100 120
Method I % RSD % Recoverya 99.98 0.85 99.78 1.14 100.06 0.64
Method II 5–30 386.40–460.20 0.0021 0.178 0.999 0.49 1.42
Method II % Recoverya % RSD 99.35 1.15 99.83 1.25 100.31 1.35
Average of three estimates at each level
a
16
Chalikwar, et al.: AUC-spectrophotometric methods for entacapone
Table 3: Precision Conc. (µg/mL)
Intra-day
Method I Method II 4 6 8
Inter-day
a
a
% RSD Method II % RSD Method I Method I
15 20 25
1.22 0.92 0.98
0.93 0.81 1.07
0.85 0.99 0.86
Method II 1.08 0.95 0.90
Average of three estimates
a
Table 4: Ruggedness Methods
Analysts
% RSDa
1
Amount found [%] 99.40
Method I Method I
2
99.58
0.91
Method II
1
98.75
0.64
Method II
2
97.46
1.52
0.96
Average of five estimations
a
Repeatability Repeatability was determined by analyzing 6 μg/mL (Method I) and 20 μg/mL (Method II) concentrations of entacapone solution for six times and the % amount determined with % RSD