RESEARCH ARTICLE
Development and Validation of First Order Derivative Spectrophotometric Method for Simultaneous Estimation of Metoprolol Succinate and Clopidogrel Bisulphate in Tablet Dosage Form Mital Gosai1*, Rupal Tanna1, Kashyap Thumar1, Jasmin Chikhalia1 Abstracts: A simple, novel, sensitive, and specific spectrophotometric method was developed and validated for the determination of Metoprolol succinate and Clopidogrel bisulphate in tablet dosage form. First order derivative spectroscopy method is adopted to eliminate spectral interference. The method obeys Beer’s Law in concentration ranges selected for evaluation. Metoprolol succinate and Clopidogrel bisulphate have λmax at 223nm and 222.22 nm respectively in 0.1N HCL solvent. The method was validated for linearity, accuracy and precision as per ICH guidelines. The zero crossing point for Metoprolol succinte and Clopidogrel bisulphate was 245.76nm and 276.13nm respectively. The LOD and LOQ value were found to be 0.15 and 0.18 µg/ml for Metoprolol succinate and 2 and 4.5 µg/ml for Clopidogrel bisulphate respectively. The developed and validated method was successfully used for the quantitative analysis of combined tablet dosage form.
INTRODUCTION Metoprolol succinate (MS) is a cardio selective drug used in the treatment of hypertension and various cardiovascular disorders. Chemicaly it is (±) 1-(isopropylamino)-3-[p-(2methoxyethyl) phenoxy]-2- propanol succinate (1-2). Clopidogrel Bisulfate is chemically methyl (2S)-2-(2chlorophenyl)-2-{4H,5H,6H,7H-thieno [3,2-c]pyridin-5-yl} acetate it works by irreversibly inhibiting a receptor called P2Y12, an adenosine diphosphate (ADP) chemoreceptor on platelet cell membranes(3-4). The combined Tablet formulation is used for the treatment of hypertension who need antiplatelet therapy especially for prophylaxis of atherombotic event. UV Spectrophotometric method is simple and cost effective analytical technique for analysis of drugs. Its simplicity, high specificity and high sensitivity make it ideal for analysis of many drugs in both dosage forms. UV derivative Spectrophotometric method is advantageous.A derivative spectrum therefore shows better resolution of overlapping bands than the fundamental spectrum and may permit the accurate determination of the λmax of the individual bands. Secondly, derivative spectrophotometry discriminates in favour of substances of narrow spectral bandwidth against broad bandwidth substances. (5) Several RP-HPLC(6-7), HPTLC(8-9), LC-MS(10), UPLC(11), (12) UV methods have been reported for Metoprolol succinate and Clopidogrel bisulphate alone or in combination with other drugs.The present method quantitates both drugs simultaneously in analysis from tablet dosage form.
of 2 nm, wavelength accuracy of 0.5 nm and a pair of 10 mm matched quartz cell was used to measure absorbance of all the solutions. Spectra were automatically obtained by UV-Probe system software. Reagents and Chemicals The solvent 0.1N HCL (LR grade) is used. Pure drug samples of Metoprolol succinate and Clopidogrel bisulphate are procured from different manufactures. Accurately weighed quantity of Metoprolol succinate and Clopidogrel bisulphate were passed through sieve No. 80 and mixed uniformly for 10 min. After mixing of powder, add PVP K30 (1%) as a binder and MCC (200mg) and talc (1%) as lubricant into it and mixed well for 5 min. The resulting powder blend was compressed using single punch rotary tablet press using 12.5mm round standard concave punch.Three batches similar in composition and coded MSCB-1,MSCB-2 and MSCB-3, respectively, were made. Preparation of Standard Stock Solution 1 mg each of Metoprolol succinate and Clopidogrel bisulphate were weighed separately and transferred in two different 10 ml volumetric flasks. Both the drugs were dissolved in 5 ml of 0.1 by ultra sonication and then volume was made up to the mark with methanol to obtain final concentration 100µg/ml of each component. Preparation of Sample Solution Twenty tablets were weighed, crushed and mixed in a mortar and pestle for10min. A portion of powder A portion of powder equivalent to 5mg of MS and 7.5mg of CLOP weighed and transferred to 10ml volumetric flask. 0.1N HCL was added to dissolve the drugs and final volume was made with the same solvent to obtain a concentration 500μg/ml of MS and 750 μg/ml of CLOP. Then the sample solution was filtered through 0.45µm cellulose acetate filter paper (0.45µm) before diluting further.
MATERIALS AND METHODS Instrumentation A SHIMADZU double beam UV/Visible recording spectrophotometer (Model: 1800) are with spectral width 1Department of Pharmaceutical Science, Saurashtra University, Rajkot, Gujarat, India. E-mail:
[email protected] *Corresponding author
Inventi Rapid: Pharm Ana & Qual Assur Vol. 2012, Issue 3 [ISSN 0976-3813] www
Methodology The standard solutions of MS (10 μg/ml) and CLOP (10 μg/ml) were scanned separately in the UV range of 200-400 nm. The
1
2012 ppaqa 414, CCC: $10 © Inventi Journals (P) Ltd Published on Web 12/06/2012, www.inventi.in
RESEARCH ARTICLE Table 1: Linearity data of MS at 223 nm for UV Concentration(µg/ml) 5 10 15 20 25
Absorbance 0.261 0.385 0.512 0.623 0.736
Table 2: Linearity data of MS at 276.13nm (ZCP of CLOP) Concentration 5 10 15 20 25
Absorbance 0.038 0.06 0.079 0.097 0.12 Table 3: Linearity data of CLOP at 222.22nm for UV
Concentration 5 10 15 20 25
Absorbance 0.197 0.357 0.515 0.654 0.793
Table 4: Linearity data of CLOP at 245.76nm (ZCP of MS) Concentration 5 10 15 20 25
Absorbance 0.068 0.121 0.165 0.214 0.255 Table 5: Precision for UV
Conc. (µg/ml) MS 10 10 10
CLOP 15 15 15
Abs. ± %RSD(n=6) Repeatability MS CLOP 0.058±1.0 0.167± 0.93 0.06± 0.83 0.164± 1.1 0.06± 0.78 0.165± 1.29
Abs. ± %RSD(n=6) Reproducibility MS CLOP 0.06± 1.3 0.162± 1.52 0.058± 1.27 0.165± 1.63 0.059± 1.2 0.167± 1.57
Abs. ± %RSD(n=6) Intermediate precision MS CLOP 0.058± 1.87 0.163± 1.85 0.06± 1.91 0.165± 1.89 0.058± 1.95 0.159± 1.82
(MS-Metoprolol succinate and CLOP- Clopidogrel bisulphate)
Table 6: Recovery study of MS MS 80 100 120
Absor-bance 0.0537 0.0538 0.054 0.0576 0.058 0.0579 0.0618 0.0616 0.062
Mean Absorbance 0.053833 0.057833 0.0618
Concentration found 8.925 8.95 9 9.9 10 9.97 10.95 10.9 11
zero-order spectra thus obtained was then processed to obtain first-derivative spectra. Data were recorded at an interval of 1 nm. The two spectra were overlain and it appeared that MS showed zero crossing at 245.76 nm, while CLOP showed zero crossing at 276.13 nm. At the zero
Inventi Rapid: Pharm Ana & Qual Assur Vol. 2012, Issue 3 [ISSN 0976-3813] www
% Recovery 99.16% 99.44% 100% 99.00% 100% 99.70% 99.54% 99% 100%
Avg.% Recovery
STDEV
%RSD
99.53%
0.00015
0.2837
0.00021
0.3599
0.0002
0.3236
99.57% 99.51%
crossing point (ZCP) of MS (245.76 nm), CLOP showed a first-derivative absorbance, whereas at the ZCP of CLOP (276.13 nm), MS showed a first-derivative absorbance. Hence 276.13 and 245.76 nm was selected as analytical wavelengths for determination of MS and CLOP,
2
2012 ppaqa 414, CCC: $10 © Inventi Journals (P) Ltd Published on Web 12/06/2012, www.inventi.in
RESEARCH ARTICLE Table 7: Recovery study of CLOP CLOP 80 100 120
Absorbance 0.145 0.147 0.145 0.16 0.158 0.16 0.1738 0.174 0.1715
Mean Absorbance 0.14566 0.15933 0.1731
Concentration found 13.44 13.66 13.44 15.11 14.77 15.11 16.55 16.66 16.38
% Recovery 99.58% 101.23% 99.58% 100.74% 99.25% 100.74% 100.33% 101.00% 99.32%
Avg.% Recovery
STDEV
%RSD
100.13%
0.00115
0.7927
100.24%
0.00115
0.7247
100.22%
0.00138
0.8025
Table 8: LOD and LOQ for UV Drug MS CLOP
LOD(µg/ml) 0.15 2
LOQ(µg/ml) 0.184 4.5
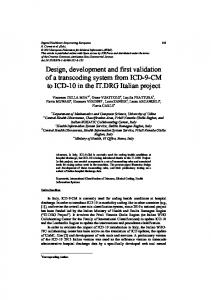
Figure 1: Linearity of MS at 223nm
Figure 2: Linearity of CLOP at 222.22nm
respectively. These two wavelengths can be employed for the determination of MS and CLOP without any
Inventi Rapid: Pharm Ana & Qual Assur Vol. 2012, Issue 3 [ISSN 0976-3813] www
interference from the other drug in their combined dosage formulations.
3
2012 ppaqa 414, CCC: $10 © Inventi Journals (P) Ltd Published on Web 12/06/2012, www.inventi.in
RESEARCH ARTICLE
Figure 3: Overlay of First order spectra of MS and CLOP standard solution
Figure 4: Overlay of First order spectra of MS and CLOP standard solution
RESULT AND DISCUSSION Validation of HPLC Method The proposed RP-HPLC method was validated as per ICHguideline.
analysing test drug solution (10µgml of Metoprolol succinate and 15µg/ml of Clopidogrel bisulphate) within the calibration range, three times on the same day. Intermediate precision was assessed by analysing test drug solution within the calibration range on the three different days and reproducibility check by using three different lab. [Table 5]
Linearity The linearity range was 5-25 μg/ml for MS [Table 1 and 2] [Figure 1] and 5-25 μg/ml for CLOP [Table 3 and 4] [Figure 2]. First derivative absorbance (D1) was measured at 276.13 nm for MS and 245.76 nm for CLOP [Figure 3 and 4]. The calibration curves were constructed by plotting absorbances versus concentrations and the regression equations were calculated.
Accuracy (% Recovery) Accuracy may often be expressed as % Recovery by the assay of known, added amount of analyte. It’s measure of the exactness of the analytical method. The recovery experiments were carried out in triplicate by sparking previously analyzed samples of the Metoprolol succinate (5 μg/ml) and Clopidogrel bisulphate (7.5 μg/ml) solution with three different concentrations of standards at 80%, 100% and 120% of Metoprolol succinate, and Clopidogrel bisulphate respectively. [Table 6 and 7]
Precision Precision of the method was determined in the terms of repeatability intermediate precision and reproducibility variation (%RSD). Repeatability was assessed by
Inventi Rapid: Pharm Ana & Qual Assur Vol. 2012, Issue 3 [ISSN 0976-3813] www
4
2012 ppaqa 414, CCC: $10 © Inventi Journals (P) Ltd Published on Web 12/06/2012, www.inventi.in
RESEARCH ARTICLE 6. Gandhimathi M. High performance liquid Chromatographic determination of Aspirin and Clopidogrel in tablets. Indian Journal Pharmceutical science, 69: 123-5.2007. 7. Rajamanickam V, Rathinaraj BV, Rajagopal PA, 2010. A validated RP-HPLC method of Metoprolol Succinate and Amlodipine Succinate from bulk drugs. Scholars Research Library Der Pharmacia Lettre, 40-46:2010. 8. Bhoi A. Simultaneous Detection of Cardiovascular Drugs Clopidogrel and Aspirin in Combined Formulation by HPTLC. Accurate forensic institute-India, 1(1): 65-69.2011. 9. Kakad R, Bawane N. High-performance thin-layer chromatographic method for simultaneous analysis of Metoprolol succinate and Amlodipine besylate in pharmaceutical preparations. Journal of Planner Chrometography, 22(2): 115-119.2009. 10. Mashelkar U, Renupurkar S. 2010. A LCMS Compatible Stability indicating HPLC Assay Method for Clopidogrel bisulphate. International Journal of ChemTech Research, 2(2): 822-829.2010. 11. Sheshadri R. Simultaneous quantitative determination of Metroprolol, Atorvastatin and Ramipril in capsules by a validated stability indicatig RP-UPLC method. Science pharm, 78: 821-834.2010. 12. Vachhani K, Patel S. Development and Validation of First Order Derivative Spectrophotometric method for simultaneous estimation of Metoprolol Succinate and Olmesartan Medoxomil in tablets. Journal of Pharmaceutical Science and Bioscientific Research, 1(2): 113-117.2011.
Limit of Detection (LOD) and Limit of Quantitation (LOQ) The LOD and LOQ were separately determined based on the calibration curves.The standard deviation of the yintercepts and slope of the regression lines were used. Results of the LOD and LOQ are given in [Table 8]. Application of Proposed Method to the Pharmaceutical Dosage Form (Assay) The proposed validated method was successfully applied to determine MS and CLOP in tablet dosage form. For the assay 5µg/band and 7.5µg/band concentration of MS and CLOP should be taken. The percentage assay of MS and CLOP in tablet samples were calculated and found to be 99.2% and 99.46% for MS and CLOP respectively. CONCLUSION The statistical data have been proven that developed First derivative spectrophotometric method for simultaneous estimation of Metoprolol succinate and Clopidogrel bisulphate was found to be more accurate, precise, sensitive. Therefore the proposed method could be applied for routine analysis in quality control laboratories for both in bulk and multi component formulation. REFERENCES AND NOTES
Acknowledgments The author are very thankful to Zydus Cadila health care for providing sample of Metoprolol succcinate and Clopidogrel bisulphate and Department of pharmaceutical Science for provision of facilities for this research work.
1. Harvey R, Champe P, Finkel R, Cubeddu L, Clark M. Lippincott's Illustrated Reviews: Pharmacology. Lippincott Williams & Wilkins, 2009. 2. British Pharmacopoeia. Vol. 2, London: Her Majesty's Stationary Offic, 2008. 3. United state pharmacopoeia 30 NF 25. United state Pharmacopoeial convention inc., 32(1), 2007. 4. Tripathi KD, Essentials of Medical Pharmacology, 5th ed. New Delhi: Jaypee brothers: 2010. 5. Beckett AH, Stenlake JB. Practical Pharmaceutical Chemistry, 4th ed. Part 2: CBS Publishers and distributors, 1997.
Inventi Rapid: Pharm Ana & Qual Assur Vol. 2012, Issue 3 [ISSN 0976-3813] www
Cite this article as Mital Gosai, Rupal Tanna, Kashyap Thumar, Jasmin Chikhalia. Development and Validation of First Order Derivative Spectrophotometric Method for Simultaneous Estimation of Metoprolol Succinate and Clopidogrel Bisulphate in Tablet Dosage Form. Inventi Rapid: Pharm Ana & Qual Assur, 2012(3):1-5, 2012.
5
2012 ppaqa 414, CCC: $10 © Inventi Journals (P) Ltd Published on Web 12/06/2012, www.inventi.in