ASSAY and Drug Development Technologies Volume 2, Number 2, 2004 © Mary Ann Liebert, Inc.
Development and Validation of a Fluorescence Technology for both Primary and Secondary Screening of Kinases That Facilitates Compound Selectivity and Site-Specific Inhibitor Determination Aric G. Morgan, Timothy J. McCauley, Michael L. Stanaitis, Mahesh Mathrubutham, and Sherri Z. Millis
Abstract: The IQ® Technology has been developed to serve as a homogeneous, universal detection platform for HTS of kinases and phosphatases. The technology is a direct, noncompetitive assay format that does not require antibodies or radioactive reagents to measure phosphorylation state. Fluorophore-labeled peptides are used as enzyme substrates, and kinase or phosphatase activity is quantitated by direct measurement of the phosphorylation state of the substrate. Phosphorylation is measured by the change in fluorescence intensity that occurs when a proprietary iron-containing compound binds specifically to phosphoryl groups on peptides. This change in observed fluorescence is proportional to the extent of phosphorylation of the fluorophore-labeled peptide. The technology provides a universal method that can be used with any peptide sequence and is insensitive to high concentrations of ATP. Inhibition at the ATP-binding site versus the phosphorylation site can be differentiated and compound selectivity identified using the same detection method as in the primary screen. The technology has been tested against a large number of detergents, organics, and other reagents found in reaction mixtures, and the detection method eliminates common issues associated with fluorescent and chromogenic compounds. The technology has been formatted for 96-, 384-, and 1,536-well microplate formats, and a representative Z9 value of 0.7 was obtained. IC50 values generated using this platform correlate with previously reported values, and screening of a small compound library was performed to evaluate the assay further.
Introduction
P
is a regulatory event involved in many cellular functions.1 Disruption of protein phosphorylation is a key factor including but not limited to cancer,2 inflammation,3 diabetes,4 and cardiovascular disease.5 Because of their role in these events, kinases are one of the primary targets6 in drug discovery comprising roughly 24% of the screening market.7 Many different detection methods have been utilized to screen for potential new drugs against kinase targets, including radioactive assays8 that incorporate 32P, ROTEIN PHOSPHORYLATION
enzyme-linked immunosorbent assays,9 and fluorescencebased assays.10 Fluorescence-based assays have gained significant research interest, eliminate the generation of radioactive isotopes, are typically very sensitive, are usually homogeneous, and often are miniaturizable. Many commercially developed fluorescence-based assays are available utilizing different readouts, such as fluorescence polarization (FP),11 fluorescence resonance energy transfer (FRET),12 and prompt fluorescence.13 Fluorescence-based assays have inherent limitations that need to be overcome. Many library compounds exhibit inherent autofluorescence or absorbance character-
Research and Development, Pierce Biotechnology, Rockford, IL. ABBREVIATIONS: DMSO, dimethyl sulfoxide; DTT, dithiothreitol; FP, fluorescence polarization; FRET, fluorescence resonance energy transfer; PKA, cyclic AMP-dependent protein kinase; PKC, protein kinase C; PKI, PKA inhibitor; RFU, relative fluorescence unit(s).
171
172
istics14 that interfere with fluorescence-based assays by elevating background or quenching signal. These phenomena result in false positives or false negatives, small signal windows, and lowered sensitivity.15 Many screening technologies utilize antibodies that recognize the peptide or protein that has been phosphorylated by the kinase target. Procurement of an antibody with a high enough affinity specific to the phosphorylated version of the antigen is difficult.16 This difficulty is compounded by the number of kinase targets and different substrates for each kinase. Over 500 human kinases are known, and although many of the kinases, such as the AGC kinases, will recognize similar peptides based on motif recognition sequences,17 the enzyme–substrate affinity can vary greatly. Also, many kinases currently in screening pipelines require a unique sequence within the substrate in order for the kinase to recognize and phosphorylate the amino acid at an affinity that is detectable using in vitro assays. Generation of high-affinity monoclonal antibodies against hundreds of phosphopeptides has proven elusive. Production of antibodies that are not sequence-specific has only been successful for the phosphotyrosine antibodies.18 The phosphoserine and phosphothreonine antibodies have proven less than ideal for applications such as FP that require both high-affinity and high phospho-specificity (unpublished observations). Some kinases require a recognition sequence of .10–15 amino acids around the phosphorylation site for recognition19; they sometimes also require a binding domain motif to increase the affinity.20 Although a functional peptide can be constructed, the resulting substrate may be 25–45 amino acids long and not amenable to FRET-based assays.21,22 These peptides have also proven cumbersome in FP assays (unpublished observations), probably because the sequence must compete with a short, exact antigenic sequence for binding to the antibody. Another consideration in kinase screening is whether a technology utilized for primary screening can then be used to test compounds via dose-response curves. If the technology cannot be adapted to secondary screening, then a second technology must be used that might require additional training, different instrumentation, and perhaps different assay conditions. Many technologies used in primary screening are qualitative, do not work well with multiple reaction conditions such as high concentrations of ATP, 23 and are not amenable for use in generating secondary screening data. We have developed an assay that works well for both primary and secondary screening applications, is sequenceindependent, and does not require antibodies. Additionally, substrates up to 20 amino acids in distance from the phosphate group to the dye are functional in the assay. Therefore, the peptide itself can have additional amino acids, such as a binding domain, and the dye will still be quenched using this detection method. The assay method of prompt fluorescence allows for subtraction of back-
Morgan et al.
ground interference, eliminating some of the issues associated with chromogenic and fluorescent compounds. Phosphatase and protease activity has also been successfully studied using this technology. The assay principle entails the binding of a metal reagent to a phosphate group24 on a fluorescently tagged peptide phosphorylated during an enzymatic reaction (Fig. 1). When the metal binds to the peptide, the fluorescence of the dye is quenched. The fluorescent dye quench mechanism is proprietary. Detection of the enzyme activity is directly correlated to the decrease in fluorescence associated with the increase in phosphorylated peptide. The assay is homogeneous, requiring an incubation of the typical enzyme reaction components and a dye-labeled substrate, followed by the addition of the detection reagents, and measurement of the fluorescence output. Materials and Methods Materials HEPES, the LOPAC™ biologically active compounds, and staurosporine were purchased from Sigma (St. Louis, MO, USA). Black round-bottom 96-well plates were purchased from Greiner Bio-One (Kremsmuenster, Austria). Disposable sterile filter flasks were purchased from Nalge Nunc International (Rochester, NY, USA). The Maybridge library of compounds was obtained from Maybridge plc (Cornwall, UK). Cyclic AMP-dependent protein kinase PKA inhibitor PKI was purchased from EMD Biosciences (La Jolla, CA, USA). ATP, CHAPS, No Weigh™, DTT, MgCl2 , and DMSO sequanal grade were obtained from Pierce (Rockford, IL, USA). All buffer components were prepared as stock solutions, sterile-filtered through a 0.2-mm cellulose membrane, and stored at 4°C. The IQ® reagents A and B, manufactured by Pierce, were premixed to a 13 stock solution, incubated for 10 h at room temperature, stored at 4°C, then diluted to a final 0.253 Working Solution just before use. PKA (2.5 units/ml) catalytic subunit and protein kinase C (PKC) from rat brain were obtained from Pierce. All other enzymes were purchased from Upstate (Lake Placid, NY, USA). PKA was dispersed into single-use aliquots, snap-frozen with dry ice, and stored at 280°C. Kemptide (Dye-LRRASLG) was purchased from Mimotopes Pty. Ltd. (Melbourne, Australia). The dye used for peptide labeling is a pH-insensitive proprietary rhodamine derivative. The IQ Calibrator Set was manufactured by Pierce and consisted of five sets of different ratios of the kemptide peptide and the phosphorylated kemptide peptide, all at the same total peptide concentration. Peptides used to determine distance dependence of IQ quenching were dye-labeled at the N-terminus and had increasing lengths of the same core sequence to reduce complexity in result interpretation caused by amino
173
Fluorescence Technology for Primary/Secondary Screening FIG. 1. Schematic representation of IQ Kinase Assay. The IQ Reagent binds specifically to the phosphorylated end product and results in a reduction of the observed fluorescence proportional to the extent of phosphorylation in the reaction mixture.
Methods All experiments were conducted at room temperature. The concentration of the peptides was determined using a Hitachi U2000 spectrophotometer. Fluorescence was measured on either a Tecan Safire or on a Tecan ULTRA Evolution™ microplate fluorometer. Excitation and emission wavelengths used were 560 nm and 590 nm, respectively. The bandwidth on the Safire was 2.5, nm, and the bandwidths on the ULTRA Evolution were 10 nm and 7 nm, respectively, using a 50% dichroic mirror. Results are presented as RFU or converted to percent fluorescence. Because different instruments have very different outputs for relative fluorescence units, the RFU data cannot always be directly compared between data sets. For example, the maximum RFU for one set of results is not directly correlated to the maximum RFU for another. In addition, changing the measurement parameters, such as attenuation or gain, of an instrument will change the actual RFU without changing the data values generated. The fluorescence of a single assay measured at two different gain settings will produce completely different data values, but the relative relationship between individual data points will be identical, and the percent fluorescence compared with a control will be the same. Additionally, the differences in negative controls and positive values vary greatly, depending on the total product formed. For example, if only 10% product was formed, the DRFU would be significantly less than if 50% product was formed. Data were graphed using either Excel (Seattle, WA, USA) or GraphPad Prism ® (San Diego, CA, USA). Development of assay Specificity of the IQ reagents for phosphorylated peptides. The IQ Calibrator Set was prepared, which comprised five equimolar concentrations of identical peptide sequence, but differing in the ratio of phosphorylated and unphosphorylated peptide. Set 1 contained
0% phosphorylated peptide, set 2 contained 25% phosphorylated peptide, set 3 contained 50% phosphorylated peptide, set 4 contained 75%, and set 5 contained 100% phosphorylated peptide. To test the specificity of the IQ reagents for phosphorylated versus unphosphorylated peptides, each set was diluted to a final concentration of 10 mM in a volume of 30 ml, and the 0.253 IQ Working Solution was added to a final volume of 150 ml before fluorescence output was measured. The IQ Calibrator Set was also used in a fashion similar to a protein concentration standard to allow calculation of the percent product formed in micromoles. Another function of the IQ Calibrator Set was to test individual reaction buffers for compatibility in the assay as described in the next section. Determination of compatibility of typical kinase assay components, including ATP, with the IQ reagents. To determine the compatibility of a substance in the IQ assay, the following conditions and format were used. Test concentrations for the substances were determined using known concentrations typically found in kinase assays. A final volume of 90 ml in a 96-well plate format was used for the mixture of substrate and substance. The mixture was prepared by adding 30 ml of each of the calibrator peptides at 60 or 120 mM (0%, 25%, 50%, 75%, or 100%) to 30 ml of the substance
Relative Fluorescence Units, Background Subtracted
acid differences. The sequences are as follows: DyeAGLARAGLALARLALALRRApSL, Dye-RApSL, DyeLALRRApSLG, Dye-LALALRRApSLG, Dye-ARLALALRRApSLG, Dye-AGLALARLALALRRApSL, and the control peptide Dye-LRRASLG.
50000 40000 30000 20000 10000 0
0 25 50 75 100 Percent of Phosphorylated Peptide
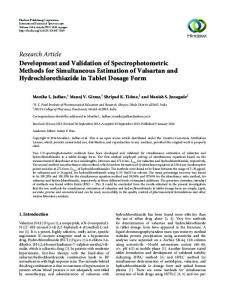
FIG. 2. Evaluation of phosphopeptide quenching by the IQ reagent. The set of 5 differentially phosphorylated peptides in the Calibrator Set were diluted to 10 mM final concentration with 0.253 IQ Working Solution in triplicate. In the absence of IQ reagent, the RFU for all peptides were 52,000 (not shown).
174
Morgan et al.
1.2 0.8 0.4 0.0
0
25
50
75
100
Time, min FIG. 3. Conversion of RFU’s to micromoles of product formed. The RFU at three concentrations of PKA enzyme and different time points during a reaction were directly correlated to the RFU delineated by the Calibrator Set at the same 10 mM concentration of total peptide. j , 2.4 nM; m , 1.2 nM; . , 0.6 nM.
to be tested in the desired concentration plus 30 ml of ultrapure water. The control sample contained the same calibrator peptide plus 60 ml of ultrapure water. The samples were mixed, then 60 ml of 0.53 IQ Working Solution was added to each well, and RFU were measured. Some were tested in duplicate, whereas others were tested in triplicate. The results were categorized as compatible and noninterfering, compatible, or interfering. Compatible and noninterfering substances did not affect the RFU of the mixture. Compatible substances affected the RFU, but normalization of the data eliminated any differences in output. Interfering substances affected the RFU output to the extent that results were not interpretable. To define these parameters, a mathematical calculation was performed according to the following steps: (a) Convert RFU into a relative percent fluorescence value by dividing each respective relative percent phosphorylation data point (0%–100%) by the 0% (respective relative percent phosphorylation) RFU value of the sample data set after averaging, then multiply by 100. The RFU values are generated by measuring the fluorescence on any fluorescence plate reader at the recommended settings in Materials and Methods. (b) Using the H2 O control 0%–100% relative percent fluorescence value(s), multiply each value by 0.95 and 1.05 to set the 65% range for all values generated by the assay. This must be done for each separate assay. (c) Determine the 65% variation in the RFU by dividing each respective RFU averaged data point (0%– 100%) by the matching H2 O (control) RFU data point and multiplying by 100. These values are the reference RFU for each test compound. (d) Identify which sample(s) have values that fall outside the 65% value(s) and grade accordingly.
Quench distance from the fluorophore. To determine the distance at which quenching would no longer occur, peptides ranging in length from four amino acids to 22 amino acids with a common core sequence, including a phosphoserine n-1 from the C-terminus and the fluorophore at the N-terminus, were diluted in 20 mM HEPES to a final concentration of 10 mM in 30 ml. As a control, one peptide containing no phosphoryl group, but identical in other respects to the seven amino acid peptide, was diluted in the same buffer at the same final concentration. One hundred twenty microliters of a 0.253 IQ Working Solution was added to the wells, and quench distance efficiency was determined by measuring fluorescence output. Optimization of the IQ assay for PKA. An enzyme titration was performed to determine the optimal concentration of enzyme to use in the inhibition assay. The enzyme was diluted twofold from 80 nM to 0.078 nM in triplicate including a no-enzyme control. To initiate the kinase reaction, 15 ml of substrate containing ATP was added to 15 ml of enzyme solution. The reaction was stopped with the addition of 0.253 IQ Working Solution after a 60min incubation time. The optimal PKA concentration that gave good substrate turnover and was on the linear portion of the titration curve was 1 nM. The assay reaction contained 20 mM kemptide, 10 mM ATP, 20 mM HEPES, pH 7.4, 5 mM MgCl2, 1 mM CHAPS, and 1 mM DTT. A time-course study was performed using the optimal concentration of PKA to determine the linearity of product formation for 100 mM and 10 mM ATP. To initiate the kinase reaction, 15 ml of substrate containing ATP was added to 15 ml of enzyme solution in triplicate. The reaction was stopped at various time intervals by the addition of 0.253 IQ Working Solution. The data were fit to a linear regression equation, and R2 values were re100
Relative Percent Fluorescence
mMolar Product Formed
1.6
80 60 40 20 0
0
25 50 75 100 Percent Phosphorylation, Calibrator Set
FIG. 4. Effects of high concentrations of ATP on detection of phosphorylation using the IQ reagents. For assay conditions refer to Methods section. r , 0mM ATP; j , 5mM ATP, m , 10mM ATP; d , 20mM ATP.
Fluorescence Technology for Primary/Secondary Screening
16000
RFU
12000 8000 4000 0
2 6 8 10 15 20 NonPhos Amino Acid Residues Between Dye and Phosphorylated Residue
FIG. 5. Assessment of the distance-dependence of IQ quenching. Six derivatives of the phosphokemptide substrate (described in Materials and Methods) were analyzed for quench efficiency of the IQ reagents. Maximal quench distance was determined by incubating 30 mM of each derivative with 0.253 IQ Working Solution.
ported for both ATP concentrations. The assay was conducted in 1 nM PKA, 20 mM kemptide, 20 mM HEPES, pH 7.4, 5 mM MgCl2, 1 mM CHAPS, and 1 mM DTT. A Km determination was performed for PKA and kemptide to determine the optimal substrate concentration to use in an inhibitor screen. The substrate was diluted twofold from 75 mM to 0.6 mM in duplicate, including a no-enzyme control. To initiate the kinase reaction, 15 ml of substrate containing ATP was added to 15 ml of enzyme solution. The reaction was stopped at various time intervals from 0 min to 214 min by the addition of 0.253 IQ Working Solution. The linear portion of each time course was determined, and the initial velocity was calculated from those data. The Km was determined to be 1.35 6 0.23 mmol/L using the Michaelis– Menten equation. The assay was conducted at 500 mM ATP, with 1 nM PKA, in 20 mM HEPES, pH 7.4, 5 mM MgCl2 , 1 mM CHAPS, and 1 mM DTT. A Km determination was performed for PKA and ATP to determine the optimal substrate concentration to use in the screen. ATP was diluted twofold from 50 mM to 0.4 mM in duplicate, including a no-enzyme control. A volume of 15 ml of enzyme was added to 15 ml of substrate containing ATP to initiate the kinase reaction. The reaction was stopped at various time intervals from 0 to 90 min with 0.253 IQ Working Solution. The linear portion of each time course was used to determine the initial velocity for each ATP concentration. The assay conditions were 20 mM kemptide, 20 mM HEPES, pH 7.4, 5 mM MgCl2, 1 mM CHAPS, and 1 mM DTT. Validation of the assay. A PKA activity experiment was performed in the presence of known kinase inhibi-
175
tors. The compounds were dissolved in 100% DMSO to a 10 mM stock concentration. Dissolved compounds were further diluted to a 403 stock concentration in 100% DMSO. The 403 solutions were then diluted to 63 and 15% DMSO in buffer. Of this solution, 5 ml was added to the multiwell plate in triplicate. Total DMSO concentration was diluted to 5% by the addition of 10 ml of enzyme solution. The kinase reaction was initiated by adding 15 ml of ATP and substrate containing 5% DMSO to reach a final concentration of 100 mM ATP, 20 mM kemptide, 5% DMSO, and 1 nM PKA. The reaction was stopped after 1 h with 120 ml of 0.253 IQ Working Solution. The buffer for this assay was 20 mM HEPES, pH 7.4, 5 mM MgCl2 , 1 mM CHAPS, and 1 mM DTT. For the inhibitor, PKI, the final concentration of kemptide was 1.0 mM. For staurosporine, the final concentration of ATP used was 10 mM. To demonstrate the HTS capabilities of the IQ assay, 80 Maybridge compounds were screened against PKA to determine effect on activity. The compounds were dissolved in 100% DMSO to a 10 mM stock concentration. Dissolved compounds were further diluted to a 200 mM stock concentration in 100% DMSO. The 200 mM solutions were then diluted to 60 mM and 15% DMSO in buffer. Of this solution, 5 ml was added to the 96-well plate in triplicate. The DMSO concentration was diluted to 5% by the addition of 10 ml of enzyme solution. The kinase reaction was initiated by the addition of 15 ml of ATP and substrate containing 5% DMSO to reach a final concentration of 10 mM ATP, 20 mM kemptide, 5% DMSO, and 1 nM PKA. The reaction was stopped after 1 h with 120 ml of 0.253 IQ Working Solution. The buffer for this assay was 20 mM HEPES, pH 7.4, 5 mM MgCl2 , 1 mM CHAPS, and 1 mM DTT.
FIG. 6. Enzyme titration to determine optimal concentration of PKA. The enzyme activity is measured as relative fluorescence units (RFU). As the substrate is phosphorylated, the fluorescence decreases. For assay conditions refer to Methods section. Inset: X-axis was changed to visualize the linear portion of the curve at low PKA concentrations.
v (RFU/s)
176
Morgan et al.
12 11 10 9 8 7 6 5 4 3 2 1 0.0
Compatibility of ATP and generic assay components
2.5
5.0
7.5
10.0
Kemptide, mmol/L FIG. 7. Determination of Km for kemptide and PKA. Initial velocities were determined from the decrease in fluorescence divided by the time in seconds of the linear portion of the reaction. Nonlinear regression analysis was performed on the resulting Michaelis-Menten plot to determine the Km value of 1.35 6 0.23 mmol/L. For assay conditions refer to Methods section.
The IQ assay quality was characterized using Z9, S/B, and S/N values. The Z9 value25 is a statistical parameter that determines the robustness of an assay based on the following formula adapted from the original to incorporate different percent product formation: (3 3 s0%) 1 (3 3 s10, 15, or 20%) Z9 5 1 2 } } } } } umean RFU 0% 2 mean RFU 10, 15, or 20%u where s is standard deviation. The Z9 measure takes into consideration the fit of each data series using certain reaction conditions compared with the “window” that results from the difference between those reaction conditions and a no-enzyme control. A Z9 value of 0.5–1.0 is considered excellent.
When designing an assay technology, compatibility of the components of the intended assays with the components of the detection reagents is important. Specific to the IQ assay, the fluorophore label and the IQ reagents are key components, so tests were performed to address their particular characteristics. Solvents and local environment can affect the emission spectra and quantum yield of fluorophores. To identify which compounds affect relative fluorescence intensity in the presence of the IQ reagents, a large group of substances was analyzed using multiple dilutions, and the results are shown in a compatibility chart on the Pierce website.26 Additional tests were conducted with ATP versus the IQ reagents at high concentrations of ATP, because the IQ reagents bind to phosphate-containing moieties and ATP is an important component of kinase assays. This fact is important to consider when analyzing kinase activity at saturating ATP levels. In a simulated assay utilizing the calibrator set to mimic product formation and thus eliminating effects of other possible factors, ATP was added at increasing concentrations. ATP did not interfere with assay performance until a final concentration of 20 mM was added (Fig. 4). Additional phosphorylcontaining moieties such as phosphate buffers might lower the concentration of ATP at which a decrease in detection capacity occurs. Importantly, the useable concentration of 10 mM is significantly higher than that of most assay platforms, allowing the researcher to study ATP site-specific inhibitors and kinetics.
5 4
Specificity of the IQ reagent for quenching of phosphoryl versus nonphosphoryl containing peptides and calculation of product formation The effectiveness of quenching by the IQ reagents was evaluated with the Calibrator Set, as described in Materials and Methods. RFU decreased linearly in direct proportion to the change from substrate (unphosphorylated peptide) to product (increasing percentages of phosphorylated peptide), demonstrating that the binding and subsequent quench by the IQ reagents would correlate to turnover in a kinase assay (Fig. 2). This concept was further demonstrated by conducting a PKA reaction and comparing the results in RFU directly with the RFU of the Calibrator Set at the same concentration, thus determining the micromolar product formed (Fig. 3).
v (RFU/s)
Results and Discussion
3 2 1 0
0
10
20
30
40
50
ATP mmol/L FIG. 8. Determination of Km for ATP and PKA. Initial velocities were determined from the decrease in fluorescence divided by the time in seconds of the linear portion of the reaction. Nonlinear regression analysis was performed on the resulting Michaelis-Menten plot to determine the Km value of 5.45 6 0.90 mmol/L. For assay conditions refer to Methods section.
177
Fluorescence Technology for Primary/Secondary Screening TABLE 1.
COMPARISON
OF
% ACTIVITY
Compound
IQ % Activity (20 mM substrate)
1 mM RO-31-8220 1 mM Wortmannin 10 mM H-89 10 mM KN-62 10 mM SB-202190 10 mM SB-203580 50 mM LY-294002 50 mM PD-98059
47 94 7 84 35 84 82 90
FOR
PKA
AT
100 mM ATP
SD
% Activity Literature (30 mM substrate)
SD
4 2 1 4 4 5 5 4
70 97 2 94 66 96 91 106
2 5 1 9 9 4 4 4
The total change in RFU was determined by finding the change in RFU from 100% activity to 0% activity. The change in RFU for the samples was determined by subtracting by the 0% activity value. The percent activity was determined by dividing the change in RFU of the sample by the total change in RFU and dividing by 100%. The 100% activity control contained 5% DMSO but no compound. The 0% activity control contained no enzyme. For assay conditions refer to Methods section.
The IQ reagents consist of a proprietary mixture containing iron; therefore, metal chelators might have an effect on assay performance. Metal chelators, including EDTA, were tested in the assay and are included in the compatibility chart.26 EDTA interferes with the assay above the concentration of 2 mM. Because of the effects of EDTA at concentrations typically used to stop a kinase reaction, EDTA is not recommended as a stop reagent for this detection method. This is not a concern, because the addition of the IQ reagents to the reaction mixture effects a pH change to 5.5 and is sufficient to stop the reaction. Due to potential effects of both metal chelators and phosphate-containing reagents, the IQ reagents were optimized to accommodate high concentrations of any of these additional components. As the IQ reagents are in excess, this also allows for high concentrations of peptide to be utilized in the assay.
assay that consisted of 20–30 amino acids in length and up to 50% charged residues. Although these substrates were not tested in the thorough manner as described here, the researchers were able to obtain results indicative of enzymatic activity showing that longer peptides than typical FRET peptides are fully detectable in this assay platform. Additional studies are in progress to determine the maximum distance at which full quench will occur, because the largest distance tested was 20 amino acids. Optimization of assay for PKA The IQ assay was optimized for PKA to determine ideal concentrations of enzyme, substrate, and ATP to use in later tests containing potential inhibitors. An enzyme titra-
Peptide length studies The maximum distance between the phosphoryl group and the fluorophore at which quenching would occur was evaluated as described in Materials and Methods. As expected, the presence of the IQ reagent did not quench the nonphosphorylated peptide, but effectively quenched the phosphorylated peptides, including the peptide with the largest distance between the phosphoryl group and the fluorophore (Fig. 5). Compared with traditional FRET assays, 95% quench occurs at this distance, which is seven amino acids longer than the typical Förster radius for FRET at which 50% quench occurs. These studies were performed with relatively uncharged amino acids that could render the peptide in a folded conformation, thus bringing the fluorescence dye closer to the IQ reagent. However, many other peptides have been utilized in the
FIG. 9. Time course study to determine linearity of product formation over the one hour incubation period at 10 mM (j ) and 100 mM (m ) ATP. The R2 value of 0.9278 for the 10 mM ATP versus 0.9928 for the 100 mM ATP suggests that the 10 mM ATP reaction is nonlinear in the incubation period.
178
Morgan et al. 50000
RFU
40000
30000
20000
10-4
10-3
10-2
10-1
100
PKI, mM FIG. 10. PKI inhibition of PKA. Nonlinear regression analysis was performed to determine the IC50 value of 2.55 6 0.021 mmol/L.
tion from 0.078 nM to 2 nM in a 1-h reaction generated a linear response (Fig. 6). When the data are converted from RFU to percent product formed, 1 nM represents the amount of enzyme used at which ,20% product was
formed, within the linear dynamic range. The substrate was then titrated across this concentration of enzyme to determine the Km (Fig. 7). Depending on subsequent studies, substrate concentration might be used at Km or at saturating concentrations, illustrating the importance of being able to identify this parameter in the platform used. To date, the majority of commercial inhibitors for kinases have been ATP site-specific, illustrating the importance of knowing the Km of ATP and ensuring that screens are performed with ATP concentration below or equal to Km . An ATP titration was performed and the Km determined (Fig. 8). The Km was determined to be 5.4 mM using the Michaelis–Menten equation. Once these parameters were known, further validation was performed. As mentioned in a previous section, the IQ reagents have been optimized to allow detection of enzyme activity at both high and low concentrations of peptide. Correlation with filter binding assays A key consideration of the IQ assay is that results are consistent with those of other screening methods. To de-
A
B
C
D
FIG. 11. IC50 values were determined for four known kinase inhibitors. (A) The IC50 for H-89 5 21 nM, 95% confidence interval 5 16 nM to 23 nM, (B) PD 98059 5 357 nM, 95% confidence interval 5 294 nM to 434 nM, (C) RO-30-8220 5 224 nM, 95% confidence interval 5 179 nM to 280 nM, (D) SB 202190 5 1.04 mM, 95% confidence interval 5 0.85 mM to 1.28 mM. These values were determined using 10 mM ATP, 20 mM kemptide, and a 1 hour incubation.
179
Fluorescence Technology for Primary/Secondary Screening 100
Percent Inhibition
75
50
25
0
Well Number FIG. 12. PKA activity in the presence of 10 mM Maybridge compounds. The known kinase inhibitor H-89 (black line) was used as the positive control. The total change in RFU was determined by finding the change in RFU from 100% activity to 0% activity. The change in RFU for the samples was determined by subtracting by the 0% activity value. The percent activity was determined by dividing the change in RFU of the sample by the total change in RFU and dividing by 100%. The 100% activity control contained 5% DMSO but no compound. The 0% activity control contained no enzyme.
termine correlation between IQ and a filter binding assay (a “gold standard” assay that is being phased out in many labs due to radioactive waste issues), the IQ assay was compared with previously published filter binding assay data.27 Because the inhibitors were all ATP-site inhibitors, ATP was added at the same concentration as was used for the filter binding assay. Data shown in Table 1 are expressed as percentage activity relative to kinase activity in the absence of any inhibitor. The linearity of the reaction at two independent ATP concentrations was tested to determine validity of the filter binding assay conditions for use in the IQ assay. The inhibition trends are the same, but the reaction conditions were not identical. This may explain differences in percent activity (Fig. 9). The standard deviations were typically lower for the IQ assay than for the filter binding assay. To examine further the correlation between IQ and radioactive assays, other studies were performed with different enzymes, including PKC, protein kinase B, and Src tyrosine kinase. In all instances, the IC50 values generated with known inhibitors correlated well with published results both in the authors’ lab and for independent researchers (data not shown).
Dose-response curves were then generated with several known kinase inhibitors versus PKA. The strong correlation between IC50 data generated for the peptide inhibitor, PKI, in the IQ assay compared with previously published data was important to note. PKI inhibits at the peptide substrate binding site. The peptide used in the IQ assay contains a dye that has the potential to change the affinity of the enzyme for the substrate. The IC50 generated was 2.6 nM (Fig. 10), which corresponds to the published IC50 of 2.3 nM.28 Inhibition of PKA by four known inhibitors utilized in the LOPAC library are also illustrated in Fig. 11. An initial small screen was conducted with 80 compounds, including one known inhibitor to serve as a control. The unknown compounds were randomly chosen from a larger library provided by Maybridge. The compounds were screened as single compounds per well at a concentration of 10 mM in 96-well plates. Hits were identified according to percent inhibition versus a 100% activity control. The known PKA inhibitor showed 88% inhibition at the 10 mM final concentration used in the screen. Of the unknowns, only 3% had inhibition of .50% compared with full enzyme activity (Fig. 12).
180
Those compounds were selected for follow-up studies. Additionally, Z9 values below 20% product formation were generated as previously reported.29 Background fluorescence can be a concern when fluorescence-based technologies are used. Fluorescent compounds often cause false positive or false negative results in FP assays, because the fluorescent compound is at a much higher concentration than the fluorescent substrate/tracer. Although a second analysis of the intensity values might allow the researcher to determine that the data are not valid for a false positive, a different technology is generally required to test those false positives in a format where they will not interfere with the signal. Moreover, false negatives are missed entirely. When using prompt fluorescence as the output and concentrations of the fluorophore at 1 mM, the background can actually be less than the output of the fluorescent substrate and not affect results. When the compound’s fluorescence is great enough to affect results, an assessment of the raw data will identify both false positives and false negatives. Additionally, a null enzyme control in the presence of compound will allow for background subtraction directly in the primary screen and initial hit data. Those data that are determined false by changes in fluorescence intensity can then be followed up by using the same detection technology. Therefore, the IQ assay will result in fewer false negatives and simplify the process. This concept has been tested with a variety of both colored and fluorescent compounds. An in-depth study comparing the effects of colored and fluorescent compounds on detection using fluorescence intensity versus other fluorescent readouts is in process, and these data will be presented in further detail in a future publication. Conclusions The IQ assay has been successfully developed and validated for direct measurement of dye-labeled substrates. The assay is sensitive, homogeneous, and robust. Tolerance to both high and low concentrations of ATP and substrate allows for increased flexibility in screening applications and utility in secondary tests of dose response and kinetic parameters. Because the assay utilizes a proprietary binding/quench reagent that is specific only to phosphoryl groups, any substrate can be used provided the dye and the phosphorylated group are within approximately 20 amino acids of each other. The assay has been validated for multiple enzyme targets through generation of IC 50 values comparable to those found using previously published methods. The IQ technology has been tested for compatibility with the majority of substances that might be encountered in a kinase assay, and detection has not been compromised. Furthermore, the method has been successfully
Morgan et al.
applied to protease assays, where the addition of a phosphate group distal to the fluorophore from the cleavage site allows measurement of an increase in signal when protease acts upon the cleavage site. The technology is ideally suited for HTS kinase screening and secondary studies, and is useful in identifying interferences from compound background. Acknowledgments The authors would like to thank Patricia Ballard for her assistance with illustrations and Tamara Smith for helpful comments on the manuscript. References 1. Cohen P: The origins of protein phosphorylation. Nat Cell Biol 2002;4:E127–E130. 2. Blume-Jensen P, Hunter T: Oncogenic kinase signaling. Nature 2001;411:355–365. 3. Nick JA, Young SK, Brown KK, Avdi NJ, Arndt PG, Suratt BT, Janes MS, Henson PM, Worthen GS: Role of p38 mitogen-activated protein kinase in a murine model of pulmonary inflammation. J Immunol 2000;164:2151–2159. 4. Ways DK, Sheetz MJ: The role of protein kinase C in the development of the complications of diabetes. Vitam Horm 2000;60:149–193. 5. Vlahos CJ, McDowell SA, Clerk A: Kinases as therapeutic targets for heart failure. Nat Rev Drug Discov 2003;2: 99–113. 6. Cohen P: The development and therapeutic potential of protein kinase inhibitors. Curr Opin Chem Biol 1999;3:459– 465. 7. High-Throughput Screening 2002: New Strategies and Technologies. HighTech Business Decisions, Moraga, CA, 2002. 8. Muller MO, Meylan-Bettex M, Eckstein F, Martinoia E, Siegenthaler PA, Bovet L: Lipid phosphorylation in chloroplast envelopes. Evidence for galactolipid CTP-dependent kinase activities. J Biol Chem 2000;275:19475–19481. 9. Versteeg HH, Nijhuis E, van den Brink GR, Evertzen M, Pynaert GN, van Deventer SJ, Coffer PJ, Peppelenbosch MP: A new phosphospecific cell-based ELISA for p42/p44 mitogen-activated protein kinase (MAPK), p38 MAPK, protein kinase B and cAMP-response-element-binding protein. Biochem J 2000;350:717–722. 10. Sills MA, Weiss D, Pham Q, Schweitzer R, Wu X, Wu JJ: Comparison of assay technologies for a tyrosine kinase assay generates different results in high throughput screening. J Biomol Screen 2002;7:191–214. 11. Wu JJ, Yarwood DR, Pham Q, Sills MA: Identification of a high-affinity anti-phosphoserine antibody for the development of a homogeneous fluorescence polarization assay of protein kinase C. J Biomol Screen 2000;5:23–30. 12. Amir-Zaltsman Y, Mazor O, Gayer B, Scherz A, Salomon Y, Kohen F: Inhibitors of protein tyrosine phosphorylation: preliminary assessment of activity by time-resolved fluorescence. Luminescence 2000;15:377–380. 13. Yeh RH, Yan X, Cammer M, Bresnick AR, Lawrence DS: Real time visualization of protein kinase activity in living cells. J Biol Chem 2002;277:11527–11532.
181
Fluorescence Technology for Primary/Secondary Screening 14. Fowler A, Swift D, Longman E, Acornley A, Hemsley P, Murray D, Unitt J, Dale I, Sullivan E, Coldwell M: An evaluation of fluorescence polarization and lifetime discriminated polarization for high throughput screening of serine/threonine kinases. Anal Biochem 2002;308:223–231. 15. Comley J: Assay interference—a limiting factor in HTS? Drug Discov World 2003;4:91–98. 16. Turek TC, Small EC, Bryant RW, Hill WA: Development and validation of a competitive AKT serine/threonine kinase fluorescence polarization assay using a productspecific anti-phospho-serine antibody. Anal Biochem 2001; 299:45–53. 17. Sorensen ES, Petersen TE: Identification of two phosphorylation motifs in bovine osteopontin. Biochem Biophys Res Commun 1994;198:200–205. 18. Sun T, Campbell M, Gordon W, Arlinghaus RB: Preparation and application of antibodies to phosphoamino acid sequences. Biopolymers 2001;60:61–75. 19. Hawkins J, Zheng S, Frantz B, LoGrasso P: p38 map kinase substrate specificity differs greatly for protein and peptide substrates. Arch Biochem Biophys 2000;382:310– 313. 20. Biondi RM, Cheung PC, Casamayor A, Deak M, Currie RA, Alessi DR: Identification of a pocket in the PDK1 kinase domain that interacts with PIF and the C-terminal residues of PKA. EMBO J 2000;19:979–988. 21. Kojima K, Kitada S, Ogishima T, Ito A: A proposed common structure of substrates bound to mitochondrial processing peptidase. J Biol Chem 2001;276:2115–2121. 22. Neininger A, Thielemann H, Gaestel M: FRET-based detection of different conformations of MK2. EMBO Rep 2001;2:703–708. 23. Turek-Etienne TC, Kober TP, Stafford JM, Bryant RW: Development of a fluorescence polarization AKT serine/ threonine kinase assay using an immobilized metal ion
24.
25. 26. 27. 28.
29.
affinity-based technology. Assay Drug Dev Technol 2003; 1:545–553. Muszynska G, Dobrowolska G, Medin A, Ekman P, Porath JO: Model studies on iron(III) ion affinity chromatography. II. Interaction of immobilized iron(III) ions with phosphorylated amino acids, peptides and proteins. J Chromatogr 1992;604:19–28. Zhang J-H, Chung T, Oldenburg K: A simple statistical parameter for use in evaluation and validation of high throughput screening assays. J Biomol Screen 1999;4:67–73. www.Piercenet.com/drugdiscovery. Davies SP, Reddy H, Caivano M, Cohen P: Specificity and mechanism of action of some commonly used protein kinase inhibitors. Biochem J 2000;351:95–105. Knighton DR, Zheng JH, Ten Eyck LF, Xuong NH, Taylor SS, Sowadski JM: Structure of a peptide inhibitor bound to the catalytic subunit of cyclic adenosine monophosphate-dependent protein kinase. Science 1991;253: 414–420. McCauley TJ, Stanaitis ML, Savage MD, Onken J, Millis SZ: IQ technology: development of a universal, homogeneous method for high-throughput screening of kinase and phosphatase activity. JALA 2003;8:36–40.
Address reprint requests to: Sherri Z. Millis, Ph.D. Group Leader, Drug Discovery Systems Research and Development Pierce Biotechnology 3747 N. Meridian Road Rockford, IL 61101 E-mail:
[email protected]