Research article Received: 17 November 2010,
Accepted: 10 December 2010
Published online in Wiley Online Library: 4 March 2011
(wileyonlinelibrary.com) DOI 10.1002/bmc.1608
Development and validation of a highly sensitive LC‐MS/MS method for simultaneous quantitation of acetyl‐CoA and malonyl‐CoA in animal tissues Ravindra Reddy Gilibili, Murugesh Kandaswamy, Kuldeep Sharma, Sanjeev Giri, Sriram Rajagopal and Ramesh Mullangi* ABSTRACT: A highly sensitive and specific LC‐MS/MS method was developed for simultaneous estimation of acetyl co‐ enzyme A (ACoA) and malonyl co‐enzyme A (MCoA) in surrogate matrix using n‐propionyl co‐enzyme A as an internal standard (IS). LC‐MS/MS was operated under the multiple reaction‐monitoring mode using the electrospray ionization technique. Simple acidification followed by dilution using an assay buffer process was used to extract ACoA, MCoA and IS from surrogate matrix and tissue samples. The total run time was 3 min and the elution of both analytes (ACoA, MCoA) and IS occurred at 1.28 min; this was achieved with a mobile phase consisting of 5 mM ammonium formate (pH 7.5)–acetonitrile (30:70, v/v) delivered at a flow rate of 1 mL/min on a monolithic RP‐18e column. A linear response function was established for the range of concentrations 1.09–2187 and 1.09–2193 ng/mL for ACoA and MCoA, respectively. The intra‐ and inter‐day precision values for ACoA and MCoA met the acceptance as per FDA guidelines. ACoA and MCoA were stable in a battery of stability studies viz. bench‐top, auto‐sampler and long‐term. The developed assay was used to quantitate ACoA and MCoA levels in various tissues of rat. Copyright © 2011 John Wiley & Sons, Ltd. Keywords: acetyl Co‐A; malonyl Co‐A; LC‐MS/MS; method validation; rat; tissues
Introduction
1352
Acetyl co‐enzyme A (ACoA; CAS no: 72‐89‐9; Fig. 1) is an important biomolecule existing in many organisms and a precursor for fatty acid biosynthesis in organisms. Malonyl co‐ enzyme A (MCoA; CAS no. 524‐14‐1; Fig. 1) is an important compound in fatty acid biosynthesis, formed by carboxylation of ACoA in an enzymatic reaction catalyzed by ACoA carboxylase (ACC). MCoA is a substrate for fatty acid synthase. A decrease in intracellular MCoA concentration in response to fasting is expected to decrease fatty acid synthesis in lipogenic tissues such as liver and fat (Prip‐Buus et al., 1990; Rasmussen et al., 2002). As all the tissues have endogenous levels of ACoA and MCoA, the method was validated in surrogate matrix and application was demonstrated to quantitate the endogenous levels of these co‐enzymes in animal liver, heart and soleus muscle tissue samples. Similar approach was used by previous researchers for quantification of these co‐enzymes (Minkler et al., 2006; Gao et al., 2007). To date only two LC‐MS methods have been reported for quantification of MCoA alone (Minkler et al., 2006) or along with other short‐chain acyl‐CoAs (Gao et al., 2007) in biological matrices. Hayashi and Satoh (2006) reported quantification of ACoA and MCoA in germinating seeds using LC‐MS/MS. The LC‐MS method reported by Minkler et al. (2006) utilized 13C3‐MCoA as an IS and acidification followed by solid‐ phase extraction (SPE) method for quantification of MCoA in rat liver, heart and skeletal muscle with a lower limit of quantification (LLOQ) of 50 pmol. Subsequently, Gao et al. (2007) developed a method for quantification of MCoA along with several
Biomed. Chromatogr. 2011; 25: 1352–1359
short‐chain acyl CoAs (free co‐enzyme, β‐hydroxyl‐butyryl‐CoA, 3‐hydroxyl‐3‐methyl‐glutaryl‐CoA, propionyl‐CoA, succinyl‐CoA and isobutyryl‐CoA) in rat tissues such as liver, heart and soleus muscle using an ion‐pairing LC‐MS method with an LLOQ of 0.225 pmol. Moreover, both LC‐MS methods utilized a gradient mobile phase for the elution (Minkler et al., 2006; Gao et al., 2007) and the mass spectrometer was operated in negative ion mode. Hayashi and Satoh (2006) utilized an ion‐pairing reagent to attain an LLOQ of 0.1 and 0.5 pmol for ACoA and MCoA, respectively, on LC‐MS/MS operated in negative mode with a run time of 15 min. This method demands an SPE process for the extraction of ACoA and MCoA from the processed samples. In this paper, we are presenting a novel, specific, sensitive and reproducible LC‐MS/MS method (operated in positive ion mode) for simultaneous quantification of ACoA and MCoA with an LLOQ of 1.09 ng/mL (0.02 pmol), which is 10‐fold lower than the reported LC‐MS method in tissues (Gao et al., 2007) and 5‐ and 20‐fold lower than the reported LC‐MS/MS method in germinating seeds for ACoA and MCoA, respectively (Hayashi and
* Correspondence to: Ramesh Mullangi, Jubilant Biosys, 2nd Stage, Industrial Suburb, Yeshwanthpur, Bangalore560 022, India. E–mail: mullangi_
[email protected] Jubilant Biosys, 2nd Stage, Industrial Suburb, Yeshwanthpur, Bangalore560 022, India Abbreviations used: ACC, ACoA carboxylase; ACoA, acetyl co‐enzyme A; MCoA, malonyl co‐enzyme A; MRM, multiple reaction‐monitoring mode
Copyright © 2011 John Wiley & Sons, Ltd.
LC‐MS/MS quantification of acetyl‐CoA and malonyl‐CoA H N
S
R
OH
O O N H
O
NH2
O
O P
P
N
OH
N
O
O
N
O
OH
N
H
Composition of assay buffer O
Coenzyme A
HO
OH
P
OH
O O
Acetyl CoA
Propionyl CoA
The assay buffer was composed of 2 M KOH, 0.4 M KCl and 0.4 M imidazole in Milli‐Q water.
OH
O
R=
monitoring the transition of the m/z 810 precursor ion to the m/z 303 product ion for ACoA, m/z 854 precursor ion to the m/z 347 product ion for MCoA and m/z 824 precursor ion to the m/z 317 product ion for IS. Quadrupole Q1 was set on low resolution where as Q3 was set on unit resolution. The dwell time was 300 ms. The analytical data were processed by Analyst software (version 1.5).
O
O
Malonyl CoA
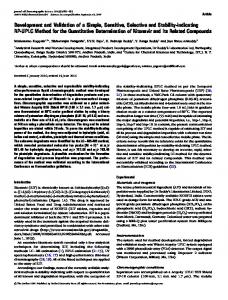
Figure 1. Structural representation of ACoA (acetyl co‐enzyme A), IS (propionyl co‐enzyme A) and MCoA (malonyl co‐enzyme A).
Satoh, 2006). The main advantages of our method over published methods are higher sensitivity, low sample volume, single‐step acidification for sample processing, usage of isocratic mobile phase, no requirement of ion‐pairing agent and high through put (3 min per run).
Experimental Chemicals and reagents Acetyl CoA, malonyl CoA and n‐propionyl CoA (Fig. 1) were purchased from Sigma Chemical (St Louis, MO, USA). HPLC‐grade acetonitrile and methanol were purchased from Rankem, Ranbaxy Fine Chemicals Limited, New Delhi, India. Analytical grade ammonium formate and perchloric acid were purchased from SD Fine Chemicals, Mumbai, India. Potassium hydroxide, potassium chloride and imidazole were purchased from SD Fine Chemicals, Mumbai, India.
Preparation of stock and standard solutions Primary stock solutions of ACoA and MCoA for preparation of standard and quality control (QC) samples were prepared from separate weighing. The primary stock solutions were prepared in methanol (1000 μg/mL). The IS stock solution of 1000 μg/mL was prepared in methanol. The stock solutions of ACoA, MCoA and IS were stored at 4°C, and were found to be stable for one month (data not shown). They were successively diluted with methanol to prepare working solutions to prepare the calibration curve (CC). Another set of working stock solutions of ACoA and MCoA was made up in methanol (from primary stock) for preparation of QC samples. Appropriate dilutions of ACoA and MCoA stock solution were made in methanol to produce working stock solutions. A working IS solution (100 ng/mL) was prepared in methanol. Working stock solutions were stored approximately at 4°C for a week (data not shown). Working stocks were used to prepare calibration standards in surrogate matrix (i.e. spiked in Milli‐Q water and subsequent to IS addition, diluted proportionately with 10% perchloric acid and assay buffer) on the day of analysis. Samples for the determination of precision and accuracy were prepared by spiking into milli‐Q water in bulk with ACoA and MCoA at appropriate concentrations [for ACoA, 1.09 (LLOQ), 3.28 (low quality control, LQC), 984 (medium quality control, MQC) and 1750 (high quality control, HQC) ng/mL; for MCoA, 1.09 (LLOQ), 3.29 (LQC), 987 (MQC) and 1755 (HQC) ng/mL] and 100 μL aliquots were distributed into different tubes. All the samples were stored at −80 ± 10°C. QC samples were diluted similar to calibration standards using acidification and subsequent neutralization using assay buffer.
Rat tissue sample preparation HPLC operating conditions A Shimadzu HT (Shimadzu, Japan) LC system equipped with degasser (DGU‐20A5) and binary pump (LC‐20AD) along with an autosampler (SIL‐ HTC) was used to inject 25 μL aliquots of the processed samples on a Chromolith Performance, RP‐18e (100 × 4.6 mm, Merck, Darmstadt, Germany) which was maintained at 40 ± 2°C in the column oven (CTO‐ 10AS). The isocratic mobile phase, a mixture of 5 mM ammonium formate (pH 7.5):acetonitrile (30:70, v/v) was filtered through a 0.45 μm membrane filter (XI5522050; Millipore, USA) or equivalent and then degassed ultrasonically for 5 min was delivered at a flow rate of 1 mL/min with splitter 50% into the mass spectrometer electrospray ionization chamber.
Mass spectrometry operating conditions
Biomed. Chromatogr. 2011; 25: 1352–1359
Validation procedures At present there is no specific regulatory guidance on quantitation of biomarkers, but a ‘fit‐for‐purpose’ stragey is recommended to prove the efficiency of the method. A partial validation according to the FDA guidelines (US DHHS et al., 2001) was performed in surrogate matrix. Matrix effect. The post column infusion method, defined by Bonfiglio et al. (1999) was used to evaluate matrix effect. Briefly, an infusion pump delivers a constant amount of analyte in to LC system outlet entering the mass spectrometer inlet. The mass spectrometer was operated in MRM mode to follow the analyte signal. The rat tissue sample extract was injected on the LC column under the same chromatographic conditions. Since the analyte was infused at a constant rate, a steady ion
Copyright © 2011 John Wiley & Sons, Ltd.
wileyonlinelibrary.com/journal/bmc
1353
Quantitation was achieved by MS/MS detection in positive ion mode for analytes and IS using a MDS Sciex (Foster City, CA, USA) API‐4000 mass spectrometer, equipped with a Turboionspray™ interface at 450°C. The common parameters, viz. curtain gas, nebulizer gas, auxillary gas and collision gas, were set at 10, 40, 45 and 12 psi, respectively. The compounds parameters, viz. declustering potential, collision energy, collision exit potential and entrance potential for ACoA, MCoA and IS were 76, 43, 36 and 10 V; 76, 43, 33 and 10 V; and 98, 44, 30 and 10 V, respectively. Detection of the ions was performed in the multiple reaction monitoring (MRM) mode,
Simple acidification, for denaturing the proteinaceous content of the tissue samples, followed by neutralization using assay buffer method, was followed for extraction of ACoA and MCoA from tissue homogenates, viz. liver, heart and soleus muscle from fasted and fed rats. Following spiking of IS solution (10 μL of 100 ng/mL) to an aliquot of 100 μL tissue homogenate, it was acidified with 300 μL of 10% perchloric acid and neutralized with equal volume of assay buffer to pH ~7 and centrifuged for 5 min at 14,000 rpm on a centrifuge (Heraus, Germany) at 10°C. From the supernatant 25 μL was injected onto LC‐MS/MS system for analysis.
R. R. Gilibili et al.
(a)
(b)
(c)
Figure 2. Product ion spectra of (a) ACoA (b) MCoA and (c) IS.
1354
response was obtained as a function of time. Any endogenous compound that elutes from the column and causes a variation in the ESI (electro spray ionization) response of the infused analyte was seen as
wileyonlinelibrary.com/journal/bmc
a suppression or enhancement in the response of the infused analyte. Separate experiments were conducted for ACoA and MCoA, i.e. each analyte was assessed separately for matrix effect.
Copyright © 2011 John Wiley & Sons, Ltd.
Biomed. Chromatogr. 2011; 25: 1352–1359
LC‐MS/MS quantification of acetyl‐CoA and malonyl‐CoA
(a)
(B)
(b)
(c)
Figure 3. Typical MRM chromatograms of ACoA (left panel) and IS (right panel) in (a) surrogate matrix; (b) surrogate matrix spiked with ACoA at LLOQ (1.09 ng/mL) and IS; and (c) a soleus muscle sample showing ACoA peak.
Calibration curve. The eight‐point calibration curve (1.09, 2.18, 10.9, 109, 546, 1093, 1640 and 2187 ng/mL for ACoA and 1.09, 2.19, 10.9, 109, 548, 1096, 1645 and 2193 ng/mL for MCoA) was constructed by plotting the peak area ratio of each analyte:IS against the nominal concentration of calibration standards in surrogate matrix. Following the evaluation of different weighing factors, the results were fitted to linear regression analysis with the use of 1/x2 (x = concentration) weighting factor. The calibration curve had to have a correlation coefficient (r) of 0.99 or better. The acceptance criteria for each back‐ calculated standard concentration were 85–115% accuracy from the nominal value except at the LLOQ, which was set at 80–120% (US DHHS et al., 2001).
Biomed. Chromatogr. 2011; 25: 1352–1359
Stability experiments. The stability of ACoA, MCoA and IS in the injection solvent was determined periodically by injecting replicate preparations of processed assay samples for up to 24 h (in the autosampler maintained at 4°C) after the initial injection. The peak‐ areas of the analyte and IS obtained at initial cycle were used as the reference to determine the stability at subsequent points. Stability of ACoA and MCoA in surrogate matrix during 8 h (bench‐top) was determined at ambient temperature (24 ± 2°C) at LQC and HQC in six replicates. Freezer stability of ACoA and MCoA in surrogate matrix was assessed by analyzing the LQC and HQC samples stored at −80 ± 10°C for at least 30 days. The samples were processed using the same procedure as described in the Rat Tissue Sample Preparation section. Samples were considered stable if assay values were within the acceptable limits of accuracy (i.e. 85–115% of the nominal value) and precision (i.e. 15% RSD).
Copyright © 2011 John Wiley & Sons, Ltd.
wileyonlinelibrary.com/journal/bmc
1355
Precision and accuracy. The intra‐assay precision and accuracy were estimated by analyzing six replicates containing ACoA and MCoA at four different QC levels [for ACoA, 1.09 (LLOQ), 3.28 (LQC), 984 (MQC) and 1750 (HQC) ng/mL; for MCoA, 1.09 (LLOQ), 3.29 (LQC), 987 (MQC) and 1755 (HQC) ng/mL] in surrogate matrix. The inter‐assay precision was determined by analyzing the four levels QC samples on four different runs. The criteria for acceptability of the data included accuracy within
85–115% accuracy from the nominal values and a precision of within 15% relative standard deviation (RSD) except for LLOQ, where it should be within 80–120% for accuracy and less than 20% of RSD (US DHHS et al., 2001).
R. R. Gilibili et al.
(a)
(B)
(b)
(c)
Figure 4. Typical MRM chromatograms of MCoA (left panel) and IS (right panel) in (a) surrogate matrix; (b) surrogate matrix spiked with MCoA at LLOQ (1.09 ng/mL) and IS; and (c) a soleus muscle sample showing MCoA peak.
Animal study
1356
All the experiments were approved by animal ethical committee. Male Sprague–Dawley rats (n = 8, 198–212 g) were procured from Bioneeds, Bangalore, India. The animals were housed in Jubilant Biosys animal care facility in a temperature‐ and humidity‐controlled room with a 12:12 h light:dark cycles, with free access to food (Lipton India) and water. Before the experimentation animals were divided into two groups. One set of animals were kept for overnight (12 h) fasting and another set of animals had access to food. Next day all the animals were sacrified by decapitation. From each animal the liver, heart and soleus muscle were quickly excised and frozen in liquid nitrogen. The collected tissues were stored under liquid nitrogen and mechanically powdered. During analysis time, to the tissue powder 10% perchloric acid solution (1:3, v/v) was added, homogenated with a homogenizer (Miccra D‐9) and processed as mentioned in the Rat Tissue Sample Preparation section. Along with tissue samples, QC samples at low, medium and high concentrations (made in surrogate matrix) were assayed in duplicate and were distributed among unknown samples in the analytical run. The
wileyonlinelibrary.com/journal/bmc
criteria for acceptance of the analytical runs encompassed the following: (i) not more than 33% of the QC samples must have an accuracy within 85–115% of the nominal concentration; and (ii) not less than 50% at each QC concentration level must meet the acceptance criteria. Tissue concentration of ACoA and MCoA were estimated using surrogate calibration curve.
Results and discussion Liquid chromatography and mass spectroscopy The feasibility of various mixture(s) of solvents such as acetonitrile and methanol using different buffers such as ammonium acetate, ammonium formate and formic acid along with altered flow‐rates (in the range 0.5–1.2 mL/min) were tested for proper chromatographic elution of ACoA, MCoA and IS (data not shown). The most suitable elution profile of peaks was achieved with 5 mM
Copyright © 2011 John Wiley & Sons, Ltd.
Biomed. Chromatogr. 2011; 25: 1352–1359
LC‐MS/MS quantification of acetyl‐CoA and malonyl‐CoA
(a)
(b)
Figure 5. Overlay chromatograms showing the matrix effect for (a) ACoA and (b) MCoA.
Biomed. Chromatogr. 2011; 25: 1352–1359
824 precursor ion to the m/z 317 was used for quantification purpose (Fig. 2c). We believe that combination of Chromolith column usage (for chromatographic separation) and positive ion mode for quantification of ACoA and MCoA on mass spectrometry, enabled us to achieve very low LLOQ compared with the earlier reported values (Gao et al., 2007; Hayashi and Satoh, 2006). Specificity and selectivity Figure 3(a–c) shows chromatogram for the control surrogate matrix (free of analytes and IS), surrogate matrix spiked with ACoA at LLOQ and IS and a soleus muscle sample showing peak of ACoA, respectively. Figure 4(a–c) shows chromatogram for the control surrogate matrix (free of analytes and IS), surrogate matrix spiked
Copyright © 2011 John Wiley & Sons, Ltd.
wileyonlinelibrary.com/journal/bmc
1357
ammonium formate (pH 7.5):acetonitrile (30:70, v/v) with a flow rate of 1.0 mL/min, on a Chromolith Performance, RP‐18e (100 × 4.6 mm, Merck, Darmstadt, Germany), which was maintained at 40 ± 2°C and was found to be suitable for the determination of the electrospray response for ACoA, MCoA and IS. In order to optimize ESI conditions for ACoA, MCoA and IS, quadrupole full scans were carried out in positive ion detection mode. During a direct infusion experiment, the mass spectra for ACoA, MCoA and IS revealed peaks at m/z 810, 854 and 824, respectively, as protonated molecular ions, [M + H]+. Following detailed optimization of mass spectrometry conditions an m/z 810 precursor ion to the m/z 303 was used for quantification of ACoA (Fig. 2a) and an m/z 854 precursor ion to the m/z 347 was used for quantification of MCoA (Fig. 2b). Similarly, for IS an m/z
R. R. Gilibili et al. with MCoA at LLOQ and IS and a soleus muscle sample showing peak of MCoA, respectively.
‘blank’ matrix, analytes were spiked in deionized water. Individual analytes’ response was compared with the pooled analyte response and no significant effect was found (data not shown).
Matrix effect The post column infusion method, defined by Bonfiglio et al. (1999), was used to evaluate the matrix effect. Figure 5(a and b) shows the matrix effect chromatogram overlaid by an surrogate matrix standard chromatogram to indicate the elution profile for the analyte over the analyte infusion matrix effect baseline for ACoA and MCoA, respectively. No significant signal suppression was observed for ACoA and MCoA. Owing to the endogeneous presence of ACoA and MCoA in biological matrices and therefore the lack of an appropriate
Calibration curve The calibration standard curve had a reliable reproducibility over the standard concentrations across the calibration range. The calibration curve was prepared by determining the best fit of peak‐area ratios (peak area analyte/peak area IS) vs concentration, and fitted to the y = mx + c using weighing factor 1/x2. The average regression (n = 4) was found to be ≥0.995. The lowest concentration with the RSD