µg/mL, 50 µg/mL and 60 µg/mL concentrated solutions to 50 µg/mL ... Column oven temperature was set at 25°C. The mobile phase consists of water pH 3.0 with ...
Available online www.jocpr.com
Journal of Chemical and Pharmaceutical Research, 2015, 7(8):774-782
Research Article
ISSN : 0975-7384 CODEN(USA) : JCPRC5
Development and validation of a simple and sensitive stability indicating RP-HPLC assay method for determination of Nintedanib and stress degradation studies Dasari Purnachand1*, Arava Veerareddy1, Bhoomireddy Ramadevi2, Ch. V. S. L. Kameswarrao1, Gogireddy Surendra Reddy1 and Bethi Madhusudhanreddy1 1
Research & Development Centre, Suven Life Sciences Limited, Hyderabad, India 2 Department of Chemistry, J.N.T. University, Hyderabad, India
_____________________________________________________________________________________________ ABSTRACT A Novel stability indicating Reverse Phase-Liquid Chromatography (RP-HPLC) method has been developed and validated for the determination of Assay of Nintedanib Drug Substance in the presence of degradation products generated from forced degradation studies. Chromatographic separation was achieved on YMC Pack ODS-AQ (C18) column (Size: 250 x 4.6 mm; 5 µm particle size) at flow rate 1.0 mL/min. with 210 nm detection. The mobile phase was Water: Acetonitrile (pH of water was adjusted to 3.0 with Orthophosphoric acid) through gradient elution. Product was subjected to stress conditions like acid, base, peroxide, thermal and photolytic degradation. No new impurities were observed during thermal and Photolytic degradation. Two new impurities were observed during acid degradation, one impurity was observed in base degradation and another impurity was observed in peroxide degradation. However, degradation products did not interfere with the detection of Nintedanib. Developed method was validated as per ICH guidelines using validation parameters like specificity, linearity, LOQ, accuracy, precision, robustness and ruggedness. LOQ value was achieved at 2 µg/mL concentration. Good linearity (r2 > 1.00) was obtained ranging from 25 µg/mL to 150 µg/mL concentrations. Recovery was verified by spiking 40 µg/mL, 50 µg/mL and 60 µg/mL concentrated solutions to 50 µg/mL concentrated solution. Hence newly developed RP-HPLC method is capable for estimating assay of Nintedanib Drug Substance and the present method is effectively separated the Nintedanib from its major degradation products. Keywords: Nintedanib, Development & Validation, RP-HPLC, Assay, Degradation, LC-MS _____________________________________________________________________________________________ INTRODUCTION Nintedanib is being used to treat some types of non-small-cell lung cancer and for idiopathic pulmonary fibrosis (IPF). Nintedanib is a small molecule tyrosine-kinase inhibitor, targeting vascular endothelial growth factor receptor (VEGFR), fibroblast growth factor receptor (FGFR) and platelet derived growth factor receptor (PDGFR). Nintedanib (formerly BIBF 1120) is originally developed by Boehringer Ingelheim and marketed under the brand names OFEV and VARGATEF [1-9]. Nintedanib (Mol. wt. 539.62) is available as Esylate salt (Mol. wt. 649.76) in stable form. The development and validation of the suitable analytical method for determination of Assay of Nintedanib Drug Substance (Fig. 1) was not reported in literature. It was felt essential to develop and validate a simple and sensitive stability indicating chromatographic method for determination of Assay of Nintedanib Drug Substance. Hence the objective of the current research was: (i) to study the degradation pattern of Nintedanib Drug Substance; (ii) to develop chromatographic stability indicating method for determination of Assay of Nintedanib Drug Substance; (iii)
774
Dasari Purnachand et al
J. Chem. Pharm. Res., 2015, 7(8):774-782
_____________________________________________________________________________________ validation of the analytical method for quantitative determination of Nintedanib in accordance with the National and International guidelines [10-13]. Fig. 1 Chemical Structures of Nintedanib Esylate
O
H N
O
O NH
N N N
O O
S
O
OH
Nintedanib Esylate C33H39N5O7S Mol. Wt.: 649.76
EXPERIMENTAL SECTION 2.1 Standards and Reagents: Nintedanib sample was obtained from In-house R&D laboratory of Suven Life Sciences. Nintedanib was well characterized by Infrared Spectroscopy (IR), Proton Nuclear Magnetic Resonance Spectroscopy (1H-NMR), Carbon Nuclear Magnetic Resonance Spectroscopy (13C-NMR), and Mass Spectroscopy. Hydrochloric acid, Sodium Hydroxide, Hydrogen Peroxide, Ortho Phosphoric acid (OPA) of AR grade were obtained from RANKEM Chemicals. Acetonitrile of HPLC grade was obtained from RANKEM Chemicals. Water was used from Milli-Q water purification system (Make: MILLIPORE / Integral 5). 2.2 Instrumentation and Software: The analytical method development and validation is performed on High Performance Liquid Chromatograph (Make & Model: Shimadzu; Pump: LC-20AD XR, Auto Injector: SIL-20AC XR, PDA Detector: SPD-M20A) equipped with binary solvent delivery pump, degasser, auto-sampler and column thermostat using Empower Software (Version 3, Future release 1). Chromatographic separation was achieved on YMC Pack C18 column (size: 250 x 4.6 mm; 5 µm particle size) using a gradient program at a flow rate of 1.0 mL/min and an injection volume of 10 µL with wavelength detection at 210 nm. Column oven temperature was set at 25°C. The mobile phase consists of water pH 3.0 with orthophosphoric acid (MP-A) and Acetonitrile (MP-B) as per the gradient program given in Table 1. Table 1. HPLC Gradient Program
Time (min.) 00:00 04:00 05:00 09:00 09:10 12:00
Composition Mobile Phase-A Mobile Phase-B (Water pH 3.0 with OPA) (Acetonitrile) 50 50 50 50 0 100 0 100 50 50 50 50
2.3 Preparation of Solutions Diluent / Blank Solution Acetonitrile:Water (90:10)
775
Dasari Purnachand et al
J. Chem. Pharm. Res., 2015, 7(8):774-782
_____________________________________________________________________________________ Stock Solution An accurately weighed 25 mg of Nintedanib was transferred into 25 mL volumetric flask, sufficient amount of diluent was added to dissolve it and volume is made upto 25 mL to obtain 1000 µg/mL concentrations. Standard Solution An aliquot of 5 mL from the Stock Solution was transferred into 50 mL volumetric flask, and volume is made upto 50 mL with diluent to obtain 100 µg/mL concentrations. Linearity Solutions An aliquots of Stock Solution (1.75, 2.5, 3.75, 5.0, 6.25 & 7.5 mL) were transferred separately into 50 mL volumetric flasks and volume is made upto 50 mL with diluent to obtain 25, 50, 75, 100, 125 and 150 µg/mL concentrations. RESULTS AND DISCUSSION 3.1 Optimization of Chromatographic Conditions: Presence of polar functional groups in the molecular structures of Nintedanib such as Ester and amide (Fig. 1), makes a Reversed Phase (RP) HPLC method with Photo Diode Array (PDA) detector which is suitable for determination. Prior to the method development, detection wavelength was determined by injecting sample of Nintedanib into HPLC system connected with Photo Diode Array (PDA) detector to obtain the λ-max value. From the obtained spectra (Fig. 2), wavelength detection at 210nm was preferred to achieve a good response. Selection of an appropriate column is an important task for successful development of HPLC method. Several RPHPLC columns are commercially available with different characteristic like particle size, length and inner diameter. In order achieve the good peak shape (asymmetry factor), most commercially available C18 column was preferred for method development work. Initially several experiments were conducted to achieve the good tailing factor, and obtained the tailing factor 1.49, purity angel 0.21 and purity threshold 9.00 using a isocratic program (50:50) at a flow rate of 1.0 mL/min and an injection volume of 10 µL with wavelength detection at 210 nm. Column oven temperature was set at 25°C. The mobile phase consists of water pH 3.0 with orthophosphoric acid (MP-A) and Acetonitrile (MP-B). Further, preliminary degradation studies were conducted at acidic, basic, peroxide, thermal and photolytic conditions and the samples were injected into HPLC system with isocratic elution and observed that the impurities formed in the acidic and peroxide degradation studies were not eluting in the above method. In order to achieve the separation of degradation impurities from Nintedanib a series of developmental activities were attempted and obtained the suitable separation between degradation impurities and Nintedanib through gradient elution. Fig. 2 3D Spectrum of Nintedanib 0.65 0.60 0.55 0.50 0.45 0.40
AU
0.35 0.30 0.25 0.20 0.15 0.10 0.05 0.00
200.00 250.00 300.00 350.00
0.00
1.00
2.00
3.00
4.00
5.00
6.00
7.00
8.00
9.00
10.00
11.00
400.00 12.00
Minutes
3.2 Final Optimized Method: Chromatographic separation was achieved on YMC Pack C18 column (size: 250 x 4.6 mm; 5 µm particle size) using a gradient program at a flow rate of 1.0 mL/min and an injection volume of 10 µL with wavelength detection at 210 nm. Column oven temperature was set at 25°C. The mobile phase consists of water pH 3.0 with orthophosphoric
776
Dasari Purnachand et al
J. Chem. Pharm. Res., 2015, 7(8):774-782
_____________________________________________________________________________________ acid (MP-A) and Acetonitrile (MP-B) through gradient elution. The composition of MP-A and MP-B were varied as per the gradient program given in Table 1. 3.3 Results of Forced Degradation Experiments: Forced degradation studies were conducted to check the possible degradation of the active pharmaceutical ingredient when exposed to various stress conditions like acidic, basic, peroxide, thermal and photolytic conditions. The developed analytical method was used to estimate the analyte response in the presence of its degradation products. 3.4 Acid Degradation, Base Degradation & Oxidative Degradation: Acid degradation of Nintedanib was performed at two different conditions. Degradation was initiated by dissolving an accurately weighed 25 mg of each Nintedanib sample in 5 mL of 0.1N Hydrochloric acid. First sample is stored at 25°C temperature for 60 minutes and second sample refluxed at 95°C temperature for 60 minutes. Base and oxidative degradation studies were performed similarly by employing 0.1 N Sodium Hydroxide and 3% hydrogen peroxide respectively. 3.5 Thermal Degradation: Thermal degradation of Nintedanib was performed at four different conditions. Each sample is exposed to 105°C temperature for 12 hours, 24 hours, 36 hours and 48 hours respectively. 3.6 Photolytic Degradation: The photolytic degradation studies were performed by placing Nintedanib exposed sample into a Petri dish, which was placed under an ultraviolet (UV) lamp of 200 watt hours / square meter. After completion of the study at each condition, samples were analyzed by HPLC at 100µg/mL concentration. Areas obtained in the standard (n=6) was compared with the degradation samples (n=2) and calculated the % of Assay and data is given in Table 2. Chromatograms of all degradation parameters were shown in Fig. 3. Table 2. Forced degradation data Condition % of Assay % of Degradation Tailing Factor Purity Angle Purity Threshold Nintedanib Sample 100.0% -1.24 0.17 2.68 0.1N HCl (1 hour RT) 95.24 4.76 1.41 0.07 2.59 0.1N HCl (60 min. Reflux) 66.17 33.83 1.17 0.14 2.94 0.1N NaOH (60 min. RT) 97.03 2.97 1.56 0.12 2.16 0.1N NaOH (60 min. Reflux) 91.03 8.97 1.59 0.12 2.25 3.0% H2O2 (1 hour RT) 95.11 4.89 1.18 0.04 2.26 3.0% H2O2 (60 min. Reflux) 41.23 58.77 0.94 0.39 6.41 Thermal (12 hours) 98.58 1.42 1.26 0.18 2.75 Thermal (24 hours) 98.36 1.64 1.26 0.18 2.67 Thermal (36 hours) 99.02 0.98 1.26 0.17 2.75 Thermal (48 hours) 98.04 1.96 1.26 0.17 2.56 Photolytic 98.12 1.88 1.26 0.21 2.59
Degradation was observed in the Acid, Base & Oxidative conditions. No degradation was observed in the thermal and photolytic conditions. Two new impurities were observed during acid degradation (about RT 1.9 & 8.3), one impurity was observed in base degradation (about RT 2.1) and another impurity was observed in peroxide degradation (about RT 5.7). However no interference was observed between the new degradation impurities with Nintedanib peak. Fig. 3 (a) HCl, (b) NaOH, (c) H2O2, (d) Thermal, (e) Photolytic degradation chromatograms
(a)
(b)
777
Dasari Purnachand et al
J. Chem. Pharm. Res., 2015, 7(8):774-782
_____________________________________________________________________________________
(c)
(d)
(e)
3.7 Identification of Degradation Impurities: Nintedanib degradation samples were analyzed by Liquid Chromatography-Mass Spectrometry (LC-MS) for getting preliminary idea about the identification of degradation impurities. Mass spectra were recorded on Applied Bioscience instrument (API 2000) mass spectrometer operating at 5500 eV. Same HPLC method was used; however Mobile Phase was changed from Water pH 3.0 with OPA to Water pH 3.0 with Formic acid. Fig. 4 (a) HCl, (b) NaOH, (c) H2O2 degradation LC-MS Spectrums
(a)
(b)
778
Dasari Purnachand et al
J. Chem. Pharm. Res., 2015, 7(8):774-782
_____________________________________________________________________________________
(c)
The LC-MS spectrums of the degradants are represented in Fig. 4a–c. The m/z value of the impurity obtained during acid degradation (RT 2.16) was 263.4, during base degradation (RT 2.26) was 526.6 and during peroxide degradation (RT 6.18) was 472.3. However degradant observed in acid degradation at RT about 8.3 (Fig. 3a) was not detected during LC-MS analysis. Further development work needs to be carried out for identification. Further identification and characterization of all degradants were not attempted, since limited availability of the sample, low level of degradation, and product is still under development. These degradation impurities might be identified during commercial scale-up. 3.8 Method Validation: 3.8.1 Specificity / Selectivity The specificity of an analytical method is defined as the ability to unequivocally determine an analyte in the presence of additional components such as impurities, degradation products and blank matrix. Specificity was evaluated by injecting the blank solution and standard solution to observe the interference at the retention time of principle peak, and it was observed that there was no interference from the blank solution. For system specificity, six replicates of standard solution were injected into chromatographic system and the parameters like theoretical plates, tailing factor, Purity Angel and Purity Threshold were studied. The results are tabulated in Table 3. As there is no blank interference is observed at the retention time of Nintedanib, the HPLC method presented in this study is specific for Nintedanib. Table 3. Specificity Parameters of Nintedanib Preparation USP Plate Count 1 5320 2 5180 3 5175 4 5106 5 4927 6 4898 Mean 5101.00 Std. Dev . 161.98 % RSD 3.18
USP Tailing 1.530 1.590 1.590 1.620 1.680 1.690 1.62 0.06 3.75
Purity Angle 0.176 0.184 0.180 0.181 0.182 0.231 0.19 ---
Purity Threshold 2.155 2.134 2.111 2.086 2.155 2.311 2.16 ---
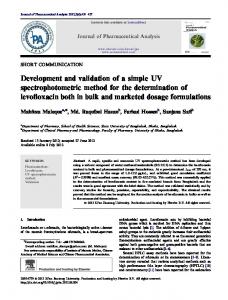
3.8.2 Linearity / Range of detector response: The linearity of an analytical procedure is its ability (within a given range) to obtain test results which are directly proportional to the concentration (amount) of analyte in the sample. Linearity of detector response for Nintedanib was established by injecting a series of solutions (n=3) of Nintedanib at the concentrations ranging from 25% to 150% level of test concentration with an interval at 50%, 75%, 100% and 125% (i.e., 25, 50, 75, 100, 125 and 150 µg/mL) concentration. The final concentration of each solution in µg per mL was plotted against peak area response. Slope and correlation coefficient (R) were found satisfactory. The results are tabulated in Table 4. The Linearity graph of Nintedanib was represented in Fig. 5.
779
Dasari Purnachand et al
J. Chem. Pharm. Res., 2015, 7(8):774-782
_____________________________________________________________________________________ Table 4. Linearity Data of Nintedanib Conc. (µg/mL) 25 50 75 100 125 150
Inj.-1 827833 1649411 2440445 3270578 4087989 4915837
Inj.-2 823330 1623223 2450465 3274747 4097289 4910134
Inj.-3 824866 1622508 2443758 3269598 4086671 4893905 Corel SLOPE STYEX LOQ
Avg. 825343 1631714 2444889 3271641 4090650 4906625 1.000 32697 5990 2 (µg/mL)
Fig. 5 Linearity Graph of Nintedanib
Nintedanib 5000000
Response
4000000 3000000 2000000 1000000 0 25
50 75 100 125 Concentration (µg/mL)
150
3.8.3 Limit of Quantitation (LOQ) The Limit of Quantitation (LOQ) values were calculated from Slope and STYEX of the linearity study. The LOQ value for Nintedanib was found to be 2 µg/mL. 3.8.4 Limit of Quantitation (LOQ) – Precision Verified the Precision at LOQ concentration by preparing solutions at concentration 2 µg/mL (n=6) and obtained the Relative Standard Deviation (RSD) for RT and Areas. The % RSD values for RTs and Areas were 0.25% and 1.15% respectively. The %RSD of peak RTs and peak areas for Nintedanib was tabulated at Table 6. 3.8.5 Accuracy / Recovery: The accuracy / recovery of the method was carried out by adding known amounts of Nintedanib (Drug Substance) corresponding to three concentration levels; 80%, 100%, and 120% (40, 50 & 60 µg/mL respectively) to the sample solution of 50 µg/mL. The percentage recoveries at each level and each replicate were determined. The mean percentage recoveries found to be 99.46 to 100.81 (Table 5). It was confirmed from obtained results that the method is highly accurate. Table 5. Accuracy data of Nintedanib S. No. 1 2 3 1 2 3 1 2 3 1 2 3
Concentration
Area Amount Found (µg/mL) Amount Recover (µg/mL) % of Recovery Average %RSD 1665041 50.34 --50 µg/mL 1666233 50.37 --50.38 0.08 1667788 50.42 --2998016 90.64 40.26 100.65 40 µg/mL Spike 2999754 90.69 40.31 100.78 100.74 0.08 3000083 90.70 40.32 100.81 3315245 100.23 49.85 99.70 50 µg/mL Spike 3313621 100.18 49.80 99.60 99.59 0.12 3311297 100.11 49.73 99.46 3643940 110.17 59.79 99.65 110.34 59.97 99.94 60 µg/mL Spike 3649856 99.80 0.15 3647187 110.26 59.89 99.81
780
Dasari Purnachand et al
J. Chem. Pharm. Res., 2015, 7(8):774-782
_____________________________________________________________________________________ 3.8.6 System Precision: The repeatability of the system precision was evaluated by analyzing replicate injections (n=6) of standard solution (100µg/mL). The %RSD for retention times (RT) and peak areas were determined to assess the system precision. The % RSD values for RTs and Areas were 0.28% and 0.13% respectively. The %RSD of peak RTs and peak areas for Nintedanib was tabulated at Table 6. This indicates that there is no significant difference between the mean value and individual values, thus the method is suitably precise and reproducible. 3.8.7 Method Precision: The repeatability of the method precision was evaluated by analyzing six replicate preparations of sample solution (100µg/mL). Each preparation was injected into chromatographic system (n=2) and estimated the average assay with standard preparation. The %RSD for Assay was determined to assess the method precision and found 0.66%. The %RSD of Assay for Nintedanib sample preparations was tabulated at Table 6. This indicates that there is no significant difference between the mean value and individual values, thus the method is suitably precise and reproducible. Table 6. System Precision, Method Precision & Limit of Quantitation Precision values of Nintedanib Injection / Preparation 1 2 3 4 5 6 Avg STDEV %RSD
System Precision Method Precision (Assay) RT Area 2.22 3291400 99.73 2.21 3291379 100.45 2.23 3296187 99.23 2.22 3299132 100.17 2.22 3298736 99.10 2.22 3301372 100.71 2.22 3296368 99.90 0.01 4193 0.66 0.28 0.13 0.66
LOQ Precision RT Area 2.22 51092 2.22 50402 2.22 50729 2.23 50646 2.23 49545 2.23 49839 2.23 50376 0.01 581 0.25 1.15
3.8.8 Robustness & Ruggedness: The robustness of the method was determined by varying (i) buffer pH with 2.8 & 3.2; (ii) mobile phase flow Rate with 0.8mL/min & 1.2mL/min; (iii) column oven temperature with 23°C & 27°C. The ruggedness of the method was determined by verifying with second column, second chemist on different day. Standard solution and Test solutions (n=3) were prepared as per the test procedure and analysed at each varied condition. Assay was calculated at each varied condition with respective to standard solution. The %RSD for Assay was determined to assess the Robustness & Ruggedness of the method and results were tabulated at Table 7. Table 7. Robustness & Ruggedness values of Nintedanib Parameter pH Flow (mL/Min.) Column Temp. (°C) Column-2 by Chemist-2
Variation 2.8 3.2 0.8 1.2 23 27 1.0 mL/Min. & 25°C
Pre.-1 99.47 99.87 99.50 99.21 100.28 100.88 100.45
Assay Pre.-2 100.33 101.44 100.47 100.74 100.59 100.40 101.58
Pre.-3 102.04 100.28 100.45 100.11 101.36 99.67 99.17
% of RSD 1.30 0.81 0.55 0.77 0.55 0.61 1.20
The robustness results obtained from assay of the test solutions demonstrate that there was no affect by varying the conditions like pH, Flow rate and column oven temperature. The results were in accordance with the results for original conditions (method precision). The ruggedness results obtained from assay of the test solutions demonstrate that there was no affect by changing the column and analyzing with second analyst. The results were in accordance with the results for original conditions (method precision). The robustness and robustness results indicates that there is no significant difference between the method precision and robustness/ruggedness results, thus the method is suitably precise and reproducible during slight variations in buffer pH, flow rate, column oven temperature and different column/analyst.
781
Dasari Purnachand et al
J. Chem. Pharm. Res., 2015, 7(8):774-782
_____________________________________________________________________________________ 3.8.9 Bench Top Stability of Test Solution: Bench top stability of standard solution (100 µg/mL concentration) of Nintedanib drug substance was conducted over a period of 24 hours. Solutions were injected into chromatographic system (n=2) at an intervals of 4 hours, 8 hours, 12 hours and 24 hours and found that test solution is stable on Bench top for 24 hours. Data obtained during Bench Top Stability of Test Solution were tabulated at Table 8. Table 8. Bench Top Stability of Test Solution Duration 4 Hours 8 Hours 12 Hours 24 Hours Average STDEV % RSD
Average RT 2.25 2.25 2.25 2.25 2.25 0.00 0.00
Average Area 3357695 3326824 3344798 3354202 3345879.75 11970.29 0.36
USP Tailing 1.84 1.85 1.86 1.85 1.85 0.01 0.38
CONCLUSION An experimental design methodology was applied for development and validation of RP-HPLC method for determining assay of Nintedanib Drug Substance. A newly developed RP-HPLC method was capable for well separation between degradation impurities and Nintedanib. Degradation study reveals that new impurities were formed and can be separated with the same method without any interference. The LOQ value was established by using Slope and STYEX method. The method was validated according to the ICH guidelines showing satisfactory data for all the method validation parameters tested. The results demonstrate that method is rapid, specific, accurate, precise, rugged and robust. Since no analytical method was reported, the proposed method could find good practical application for estimating assay of Nintedanib Drug Substance for routine testing in quality control. Acknowledgements The authors would like to acknowledge Suven Life Sciences, Hyderabad, India for supporting this work. Authors are grateful to Mupparaju Usha Kiran and Muginaru Udayasankar Reddy for valuable suggestions during literature review and preparation of manuscript. The authors also would like to acknowledge Kokkalla Praveen Kumar for his helpful discussions and co-operation in preliminary laboratory work. REFERENCES [1] Nintedanib, 2015. https://en.wikipedia.org/wiki/Nintedanib (Accessed August 23, 2015). [2] Nintedanib, 2015. http://www.drugs.com/cdi/nintedanib.html (Accessed August 23, 2015). [3] Nintedanib, 2015. http://pubchem.ncbi.nlm.nih.gov/compound/9809714#section=Top (Accessed August 23, 2015). [4] L Wollin; I Maillet; V Quesniaux; A Holweg; B. Ryffel. J Pharmacol Exp Ther., 2014, 349(2), 209-220. [5] D Xu; Y Zhang; J Dai; Y Bai; Y Xiao; M Zhou. Anal. Methods, 2015, DOI: 10.1039/C5AY01207D. [6] GJ Roth; A Heckel; R Walter; JV Meel; N Redemann; U Tontschgrunt; W Spevak; F Hilberg. US Patent 6762180, 2004. [7] GJ Roth; G Linz; P Sieger; W Rall; F Hilberg; T Bock. US Patent 7119093, 2006. [8] GJ Roth; G Linz; P Sieger; W Rall; F Hilberg; T Bock. US Patent 7989474, 2011. [9] GM Maier; A Baum; B Betzemeier; M Henry; R Herter; U Reiser; P Sini; D Weber; U Werthmann; SK Zahn. US Patent 2014/0018372, 2014. [10] ICH Q1A(R2): Stability testing of new drug substances and products. Geneva, Switzerland, 2000. [11] ICH Q1B: Stability Testing: Photostability Testing of New Drug Substances and Products. Geneva, Switzerland, 1996. [12] ICH Q2(R1): Validation of Analytical Procedures: Text and Methodology. Geneva, Switzerland, 2005. [13] ICH Q3A(R2): Impurities in New Drug Substances. Geneva, Switzerland, 2006.
782