Firouzi et al. Genome Medicine 2014, 6:46 http://genomemedicine.com/content/6/6/46
METHOD
Open Access
Development and validation of a new highthroughput method to investigate the clonality of HTLV-1-infected cells based on provirus integration sites Sanaz Firouzi1, Yosvany López2, Yutaka Suzuki2, Kenta Nakai3, Sumio Sugano1, Tadanori Yamochi1* and Toshiki Watanabe1*
Abstract Transformation and clonal proliferation of T-cells infected with human T-cell leukemia virus type-I (HTLV-1) cause adult T-cell leukemia. We took advantage of next-generation sequencing technology to develop and internally validate a new methodology for isolating integration sites and estimating the number of cells in each HTLV-1-infected clone (clone size). Initial analysis was performed with DNA samples from infected individuals. We then used appropriate controls with known integration sites and clonality status to confirm the accuracy of our system, which indeed had the least errors among the currently available techniques. Results suggest potential clinical and biological applications of the new method.
Background It has been more than 30 years since human T-cell leukemia virus type-I (HTLV-1) was shown to be the causative agent of adult T-cell leukemia (ATL) [1,2]. However, understanding the true nature of the multiple leukemogenic events [3] that are essential for this aggressive transformation remains elusive [4-9]. Although approximately 5% of HTLV-1-infected individuals develop ATL after a long latency period, the majority remain asymptomatic carriers (ACs) throughout their lifetimes. However, there are not enough clear determinants to distinguish between individuals who eventually develop ATL and those who remain as ACs [10,11]. To discover the factors associated with disease development, long-term prospective studies have assessed the correlation between disease outcome and proviral load (PVL), that is, the percentage of infected cells among the total peripheral blood mononuclear cells (PBMCs) [10-12]. The ‘Joint Study on Predisposing Factors of ATL Development’ * Correspondence:
[email protected];
[email protected] 1 Department of Medical Genome Science, Graduate School of Frontier Sciences, The University of Tokyo, 4-6-1 Shirokanedai, Minato-ku, Tokyo 108-8639, Japan Full list of author information is available at the end of the article
(JSPFAD) [13] showed that a PVL higher than 4% is one of the indications of risk for progression to ATL [10]. Although an elevated PVL is currently the best characterized factor associated with a high risk of ATL development, a high PVL alone is not sufficient for disease prediction, suggesting the need to discover additional predictive factors [10,11]. Because ATL is a malignancy caused by HTLV-1 infection, both the integration of provirus into the host genome and the clonal expansion of infected cells are highly critical leukemogenic events [6,7,14,15]. Although many studies have addressed these aspects, the mechanism of HTLV-1 clonal expansion has not been elucidated [15-35]. Accurate monitoring for changes in clonality occurring before, during, and after ATL development is of great interest and of major clinical significance not only to clarify the underlying mechanisms but also to discover reliable predictive biomarkers for disease progression. A broad range of evidence strongly supports that most neoplasms are composed of clonally expanded cell populations [36-38]. Owing to its biological significance, the concept of clonal expansion in cancer biology has been investigated using a variety of approaches in many tumor types [36-39], including ATL [6,15,16,18-20,22,24,29-32].
© 2014 Firouzi et al.; licensee BioMed Central Ltd. This is an Open Access article distributed under the terms of the Creative Commons Attribution License (http://creativecommons.org/licenses/by/4.0), which permits unrestricted use, distribution, and reproduction in any medium, provided the original work is properly credited. The Creative Commons Public Domain Dedication waiver (http://creativecommons.org/publicdomain/zero/1.0/) applies to the data made available in this article, unless otherwise stated.
Firouzi et al. Genome Medicine 2014, 6:46 http://genomemedicine.com/content/6/6/46
Clonal proliferation of HTLV-1-infected cells was first detected as monoclonal-derived bands by southern blotting [33]. Early studies found that monoclonal integration of HTLV-1 is a hallmark of ATL cells [16]. Furthermore, it was suggested that detecting a monoclonal band is useful for diagnosis and is associated with a high risk of ATL development [29,30]. Subsequent PCR-based methods included inverse PCR, linker-mediated PCR, and inverse long PCR, which enabled analysis of samples with clonality below the detection threshold of southern blotting [17,25,31,34]. Based on the observed banding patterns, the clonality of the samples was described as having undergone monoclonal, oligoclonal, or polyclonal expansion. Such PCR-based analyses revealed that, in addition to a monoclonal proliferation of infected cells, a monoclonal or polyclonal proliferation occurs even in non-malignant HTLV-1 carriers [31,35]. Moreover, considering the stability of the HTLV-1 proviral sequence, it was hypothesized that maintaining a high PVL is achieved by persistent clonal proliferation of infected cells in vivo [25]. This hypothesis was further supported by the detection of a particular HTLV-1 clone in the same carrier over the course of several years [18]. Two Miyazaki cohort studies focused on the maintenance and establishment of clonal expansion: Okayama et al. analyzed the maintenance of a preleukemic clone in an AC state several years prior to ATL onset [19], and Tanaka et al. assessed the establishment of clonal expansion by comparing the clonality status of long-term carriers with that of seroconverters. They showed that some of the clones from long-term carriers were stable and large enough to be consistently detectable by inverse long PCR; however, those from seroconverters were unstable and rarely detectable over time [20]. Knowledge provided by conventional studies has shed light on the next challenges worthy of further investigation. Owing to technical hurdles, however, previous studies isolated small numbers of integration sites from highly abundant clones and detected low abundant clones in a non-reproducible manner [22,34]. Furthermore, conventional techniques could not provide adequate information regarding the number of infected cells in each clone (clone size) [22]. To effectively track and monitor HTLV-1 clonal composition and dynamics, we considered devising a new method that would not only enable the highthroughput isolation of integration sites but also provide an accurate measurement of clone size. PCR is a necessary step for the integration site isolation and clonality analysis. However, bias in the amplification of DNA fragments (owing to issues such as extreme fragment length and high GC content) is intrinsic to any PCR-based method [40-45]. Different fragment amplification efficiencies make it difficult to calculate the amount of starting DNA (the original distribution of template DNA) from
Page 2 of 15
PCR products. Hence, estimating HTLV-1 clonal abundance, which requires calculating the number of starting DNA fragments, is only achievable by avoiding the PCR bias. Recently, Bangham’s research group analyzed HTLV-1 clonality and integration site preference by a highthroughput method [22]. In the method developed by Gillet et al., clone sizes were estimated using length of DNA fragments (shear sites generated by sonication) as a strategy for removing PCR bias [22]. Owing to the limited variation in DNA fragment size observed with shearing, the probability of generating starting fragments of the same lengths is high, leading to a nonlinear relationship between fragment length and clone size [22,46]. Therefore, Gillet et al. used a calibration curve to statistically correct the shear site data [22]. Later, Berry et al. introduced a statistical approach, and further addressed the difficulties of estimating clone size from shear site data [46]. Their approach estimates the size of small clones with little error, but estimates for larger clones have greater error [46]. A parameter adopted from the Gini coefficient [47,48] and termed the oligoclonality index was used to describe the size and distribution of HTLV-1 clones [22]. It has been demonstrated that the oligoclonality index differs between malignant and nonmalignant HTLV-1 infections, and also a high PVL of HTLV-1-associated myelopathy is due to cells harboring large numbers of unique integration sites [22]. Furthermore, genome-wide integration site profiling of clinical samples revealed that the abundance of a given clone in vivo correlates with the features of the flanking host genome [22,24]; although there was not a specific hotspot, HTLV-1 more frequently integrated in transcriptionally active regions of the host genome [22,24]. These findings further clarified the characteristics of HTLV-1 integration sites, and strongly suggested the importance of HTLV-1 clonal expansion in vivo. Here we introduce a method that overcomes many of the limitations of currently available methods. Taking advantage of next-generation sequencing (NGS) technology, nestedsplinkerette PCR, and a tag system, we designed a new high-throughput method that enables specific isolation of HTLV-1 integration sites and, most importantly, allows for the quantification of clonality not only from the major clones and high-PVL samples but also from low-abundance clones (minor clones) and samples with low PVLs. Moreover, we conducted comprehensive internal validation experiments to assess the effectiveness and accuracy of our new methodology. A preliminary validation was conducted by analyzing DNA samples from HTLV-1-infected individuals with different PVLs and disease status. Subsequently, an internal validation was performed that included an appropriate control with known integration sites and clonality patterns. We present our methodology, which illustrates
Firouzi et al. Genome Medicine 2014, 6:46 http://genomemedicine.com/content/6/6/46
that employing the tag system is effective for improving quantification of clonal abundance.
Methods Our clonality analysis method included two main aspects: (1) wet experiments, and (2) in silico analysis (Additional file 1: Figure S1). A general explanation of materials and methods is provided here, and detailed protocols of the wet experiments are included in Additional file 1: Notes. The in silico analysis is further described in Results and discussion. NGS data have been deposited in the Sequence Read Archive of NCBI with access number of (SRP038906). Wet experiments Biological samples: specimens and cell lines
Specimens: In total five clinical samples were provided by a biomaterial bank of HTLV-1 carriers, JSPFAD [13,49]. The clinical samples were a part of those collected with an informed consent as a collaborative project of JSPFAD. The project was approved by the Institute of Medical Sciences, the University of Tokyo (IMSUT) Human Genome Research Ethics Committee. Information about the disease status of samples was obtained from JSPFAD database in which HTLV-1-infected individuals were diagnosed based on the Shimoyama criteria [50]. In brief, genomic DNA from PBMCs was isolated using a QIAGEN Blood kit. PVLs were measured by real-time PCR using the ABI PRISM 7000 Sequence Detection System as described in [10]. Cell lines: An IL2-dependent TL-Om1 cell line [51] was maintained in RPMI 1640 medium supplemented with 10% heat-inactivated fetal calf serum (GIBCO), 1% penicillin-streptomycin (GIBCO), and 10 ng/mL IL2 (R&D systems). The same conditions as those of patient samples were used to extract DNA and measure PVL. Illumina-specific library construction
We employed a library preparation protocol specifically designed to isolate HTLV-1 integration sites. The final products in the library that we generated contained all the specific sequences necessary for the Illumina HiSeq 2000 platform (Additional file 1: Figure S2). These products included a 5′-flow cell binding sequence, a region compatible with read-1 sequencing primer, 5-bp random nucleotides, 5-bp known barcodes for multiplexing samples, HTLV-1 long terminal repeat (LTR), human or HTLV-1 genomic DNA, a region compatible with read-2 and read-3 sequencing primers, 8-bp random tags, and a 3′-flow cell binding sequence from 5′ to 3′, respectively (Additional file 1: Figure S2B). Incorporating the 5-bp random nucleotides downstream of the region compatible with the read-1 sequencing primer was critical and resulted in high-quality sequence data. We
Page 3 of 15
used a library designed without the first 5-bp of random nucleotides as input for the HiSeq 2000 sequencer in our first samples (S-1, S-2, S-3, and S-4). Because all fragments began with the same LTR sequence, clusters generated in the flow cells could not be differentiated appropriately. These samples resulted in low-quality sequence data (see Additional file 1: Notes). Designing the first 5-bp randomly resulted in high-quality sequence data for the remaining samples because clusters were differentiated with no problem during the first five cycles of sequencing (data not shown). Our library construction pipeline comprised the following four steps (Additional file 1: Figure S2) (Additional file 1: Notes): (1) DNA isolation: DNA was extracted as described above, and the concentration of extracted DNA was measured with a NanoDrop 2000 spectrophotometer (Thermo Scientific). We recommend using 10 μg of DNA as the starting material. However, in practice there are some rare clinical samples with limited DNA available. In order to be able to handle those samples, the method was also optimized for 5 μg and 2 μg of starting DNA. (2) Fragmentation: According to the protocol provided in Supplementary Notes, the starting template DNA was sheared by sonication. The resulting fragments represented a size range of 300 to 700 bp as checked by an Agilent 2100 Bioanalyzer and DNA 7500 kit (Figure 1B). (3) Pre-PCR manipulations: Four steps of end repair, A-tailing, adaptor ligation, and size selection were performed as described in Additional file 1: Notes. (4) PCR: To amplify the junction between the genome and the viral insert, we used nested-splinkerette PCR (a variant of ligation-mediated PCR [52,53]) (Additional file 1: Figure S2). We confirmed that the technique specifically amplifies HTLV-1 integration sites; since there was no non-specific amplification neither from human endogenous retroviruses nor from an exogenous retrovirus such as HIV (see Additional file 1: Table S1 and Additional file 2: Figure S1). Information on oligonucleotides, including adaptors and primers, and the LTR and HTLV-1 reference sequences [54] are provided in Additional file 1: Table S1. The final PCR products were sequenced using the HiSeq 2000 platform. In silico analysis
Raw sequencing data were processed according to the workflow described in the Results and discussion section.
Firouzi et al. Genome Medicine 2014, 6:46 http://genomemedicine.com/content/6/6/46
Page 4 of 15
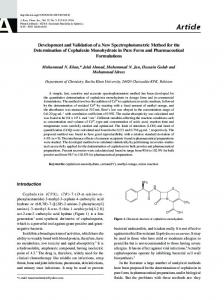
Figure 1 Estimating clone size by ‘shear sites’. Also see Additional file 2: Figure S2 for a simple image from an integration site and its shear sites. (A) Depicted is the complex population of uninfected cells (grey circles) together with infected clones (circles of different colors). A clone is shown as a group of sister cells (circles of the same color) having the same integration site (IS). Different clones are distinguishable based on differing integration sites, and thus the number of integration sites represents the number of infected clones. For example, the six different unique integration sites refer to six unique clones. (B) Genomic DNA fragmented by sonication generates random shear sites (fragments of different length). Fragment size, measured by an Agilent Bioanalyzer, ranged from 300 to 700 bp. This size range can theoretically provide approximately 400 variations. (C) The size distribution of fragments decreased following amplification by integration-site-specific PCR. From the deep sequencing data, the original number of starting fragments could be estimated by removing PCR duplicates and counting fragments with different lengths. For example, five different lengths of PCR amplicons represent five infected sister cells. (D) We analyzed four samples, including (S-1: asymptomatic carrier (AC), (8% PVL)), (S-2: smoldering (SM), (9% PVL)), (S-3: smoldering, (31% PVL)), and (S-4: acute, (33% PVL)). Using our method, the clone sizes were quantified by considering only shear sites. The first major clone (the largest clone) of each sample was mapped to (chr 11-41829319 (+)), (chr 15: 59364370 (+)), (chr 4-563543 (-)), and (chr X - 83705328 (-)), respectively. The shear site variations of each major clone were 209, 119, 242, and 222, respectively. Different colors on the pie graphs indicate different integration sites, and the size of each piece represents the clone size.
The initial forward read (100-bp) was termed Read-1 and the reverse read (100-bp) was termed Read-3 and an index read (8-bp) was termed Read-2. In brief, analysis programs were written in Perl language and run on a supercomputer
system provided by The University of Tokyo’s Human Genome Center at The Institute of Medical Science [55]. The sequencing output was check for quality using the FastQC tool [56]. The regions corresponding to the LTR
Firouzi et al. Genome Medicine 2014, 6:46 http://genomemedicine.com/content/6/6/46
and HTLV-1 genome were subjected to a blast search against the reference sequences described in Additional file 1: Table S1. Following isolation of the integration sites, the flanking human sequences were mapped to the human genome (hg19) (the UCSC genome browser [57]) by Bowtie 1.0.0 [58]. The final processed data included information about shear sites (R1R3), tags (R1R2), and a combination of tags and shear sites (R1R2R3). Fitting the data to the zero truncated Poisson distribution for retrieving correlation coefficients were done by the R-package ‘gamlss.tr’ [59]. The Gini coefficient was calculated by StatsDirect medical statistics software [60].
Results and discussion
Page 5 of 15
make them unique prior to PCR amplification. Thus, if each DNA fragment could be marked with a unique feature, it would then be possible to calculate its frequency based on the frequency of that unique feature. When a single unique stretch of DNA is amplified by PCR, the resulting product is a cluster of identical fragments termed PCR duplicates. Therefore, to estimate the frequency of starting DNA fragments, one should count the number of clusters with unique features. The remaining technical question then becomes how to mark the starting DNA prior to PCR amplification. In the following section, we compare and discuss two main strategies, namely (1) shear sites and (2) a tag system, which enable DNA fragments to be uniquely marked.
General concepts
We originally designed our method to overcome the limitations of conventional techniques [31,34] and to make improvements in the only existing high-throughput method [22]. In general, our method includes two main sets of wet experiments and an in-silico analysis. We used genomic DNA as the starting material to prepare an appropriate library for Illumina sequencing. Subsequently, deepsequencing data were analyzed by a supercomputer. The resulting information represents the clonality status of each sample (Additional file 1: Figure S1). There are complex populations of infected clones and uninfected cells in a given HTLV-1 infected individual. High-throughput clonality analysis requires monitoring two main characteristics of clones: HTLV-1 integration sites and the number of infected cells in each clone (clone size). Each HTLV-1-infected cell naturally harbors only a single integration site [23]. Therefore, the number of detected unique integration sites corresponds to the number of infected clones. Based on our analysis, which is consistent with the data of Gillet et al. [22], employing high-sensitivity deep sequencing allowed for the isolation of a large number of unique integration sites (UISs), including samples with low PVLs (Figure 1). We analyzed four samples from HTLV-1-infected individuals with different PVLs, disease status, and expected clonality patterns. The samples include S-1: AC (8% PVL); S-2: smoldering ATL (SM) (9% PVL); S-3: SM (31% PVL); and S-4: acute ATL (33% PVL). Based on the final optimized conditions, 1030, 39, 265, and 384 UISs were isolated from each sample, respectively (Figure 1). The most challenging aspect of our clonality analysis was estimating the number of infected cells in each clone. Although a necessary step in the analysis, PCR introduces a bias in the frequency of starting DNA material [40-45]. Because amplification causes significant changes in the initial frequency of starting materials, PCR products cannot be used directly to estimate the amount of the starting DNA material. To overcome this problem, we needed to manipulate DNA fragments to
Estimating the size of clones by shear sites
The first strategy, described by Gillet et al., relies on shearing DNA by sonication, resulting in fragments of random length [22]. Sonication-derived shear sites were thus used as a distinguishing feature to make fragments unique prior to PCR. Clone sizes were then estimated by statistical approaches [22,46]. To directly assess the effectiveness of the shear site strategy, we analyzed the clonality of the aforementioned clinical samples (S-1, S-2, S-3, and S-4). Genomic DNA was cleaved by sonication with fragments in the 300- to 700-bp range, theoretically providing approximately 400 possible variations in fragment size (Figure 1A and B). Following library construction, however, the final product represented smaller size ranges, implying a relatively limited number of variations (Figure 1C). Finally, the number of PCR amplicons with unique shear sites was retrieved from deep-sequencing data. See Additional file 2: Figure S2 for a simple image from an integration site and its shear sites. The data obtained from the shear site experiments were not fitted to calibration curves or statistical treatments, which were used by Gillet et al. and Berry et al., respectively (See Additional file 1: Notes) [22,46]. For clarity, only the information relating to the major clone of each sample is provided in Figure 1D. The shear-site variations of the major clone were 209, 119, 242, and 222 for samples S-1 through S4, respectively. Even in the case of control samples with 100% PVLs, the shear sites did not provide more than 225 variations (see Validation of the methodology). However, it was expected that samples with differing PVLs and disease status would harbor varying numbers of sister cells, at least in their major clones. Similar variations of shear sites were observed in major clones of AC, SM, and acute samples. These data suggest that, because the number of sister cells in each clone exceeded the shear site variations, the size of the clones was underestimated (Figure 1). This is most problematic in the case of large clones and leads to an underestimation of the clone size.
Firouzi et al. Genome Medicine 2014, 6:46 http://genomemedicine.com/content/6/6/46
Measuring the size of clones by the tag system
We developed an alternate strategy to remove PCR bias and to estimate starting DNA. We designed a tag system in which 8-bp random nucleotides are incorporated at the end of DNA fragments during adaptor ligation step. Each tag acts as a molecular barcode, which gives each DNA fragment a unique signature prior to PCR. Information on the frequency of observed tags from the deepsequencing data can be used to remove the PCR duplicates and thereby estimate the original clonal abundance in the
Page 6 of 15
starting sample. Owing to their random design, the tags could theoretically provide approximately 65,536 variations. This degree of potential variation is expected to provide a unique tag for a large number of sister cells in each clone (Figure 2). We analyzed samples S-1, S-2, S-3, and S-4 to assess the effectiveness of our tag system for estimating clone size. The major clone of each sample showed tag variations of 393, 142, 1751, and 2675, respectively (Figure 2D). Similar variations of tags and shear sites were observed in the
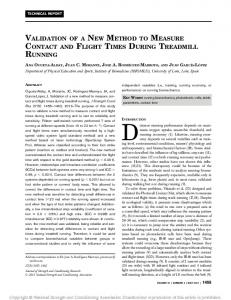
Figure 2 Measuring clone size using the tag system. (A) The depiction above shows that shear site variations are not able to cover all sister cells in large clones. As the number of the sister cells in a given clone increases, the probability of DNA shearing at the same site increases. (B) Prior to PCR, we incorporated 8-bp random tags into each DNA fragment to uniquely mark them. Random tags could theoretically provide approximately 65,536 variations. The number of potential variations is expected to amply cover large numbers of the sister cells. (C) The tag information was used to remove PCR duplicates and to estimate the original number of starting fragments. If the fragments had the same shear sites but different tags, they were counted separately. For example, here five different combinations of tags and shear sites represent five infected cells. (D) Samples: S-1, S-2, S-3, and S-4 were analyzed by the final optimal condition (Bowtie parameters: -v 3 - - best, and filtering condition: (merging approach) JT-10). Clone size was measured by tags only or by the combination of shear sites and tags. The covered variations were (393,142, 1751, and 2675) and (269, 119, 1192, and 2038), respectively.
Firouzi et al. Genome Medicine 2014, 6:46 http://genomemedicine.com/content/6/6/46
largest clones of S-1 and S-2 ((shear sites vs. tags): (209 vs. 393) and (119 vs. 142)) (Figure 1D and Figure 2D). In all four samples, those variations were also similar in the minor clones of which the clone sizes did not exceed shear sites variations (approximately