http://dx.doi.org/10.5935/0103-5053.20150345 J. Braz. Chem. Soc., Vol. 27, No. 5, 912-918, 2016. Printed in Brazil - ©2016 Sociedade Brasileira de Química 0103 - 5053 $6.00+0.00
Article
Development and Validation of a New Spectrophotometric Method for the Determination of Cephalexin Monohydrate in Pure Form and Pharmaceutical Formulations Muhammad N. Khan,* Jalal Ahmad, Muhammad N. Jan, Hussain Gulab and Muhammad Idrees Department of Chemistry, Bacha Khan University, 24420 Charsadda-KPK, Pakistan A simple, fast, sensitive and accurate spectrophotometric method has been developed for the quantitative determination of cephalexin monohydrate in dosage form and in commercial formulations. The method involves the addition of CeIV to cephalexin in acidic medium, followed by the determination of residual CeIV by reacting with a fixed amount of methyl orange, and the absorbance was measured at 510 nm. Beer’s law was obeyed in the concentration range of 0.6-20 µg mL-1 with correlation coefficient of 0.992. The molar absorptivity was calculated and was found to be 9.8 × 10⁴ L mol-1 cm-1. Different variables affecting the reaction conditions such as concentration and volume of CeIV, type and concentration of acids used, reaction time and temperature were carefully studied and optimized. The limit of detection (LOD) and limit of quantification (LOQ) were calculated and found to be 0.221 and 0.736 µg mL-1, respectively. The proposed method was found to have good reproducibility with a relative standard deviation of 4.4% (n = 9). The interference effects of common excipients found in pharmaceutical preparations were studied. The developed method was validated statistically by performing recoveries studies and successfully applied for the determination of cephalexin in bulk powder and pharmaceutical preparations. Percent recoveries were calculated and found to range from 90.6 to 102.9% for bulk powder and from 98.7 to 104.8% for pharmaceutical preparations. Keywords: cephalexin monohydrate, cerium(IV), methyl orange, redox reaction
Introduction C e p h a l ex i n ( C P X ) , ( 7 R ) - 7 - ( D - α - a m i n o - α phenylacetamido)-3-methyl-3-cephem-4-carboxylic acid hydrate or (6R,7R)-7-{[(2R)-2-amino-2-phenylacetyl] amino}-3-methyl-8-oxo-5-thia-1-azabicyclo[4.2.0] oct-2-ene-2 carboxylic acid hydrate (Figure 1) is a first generation1 semi-synthetic derivative of cephalosporin, which is a powerful tool against gram-positive and gramnegative bacteria. It exhibits a broad spectrum of activities, which have the ability to weakly bond with blood protein, therefore, have no metabolites, low toxicity and rapid absorptivity.2 It is a hydrosoluble, amphoteric compound, having isoelectric point of 4.3.3 The drug is, therefore, widely used for the clinical chemotherapy like middle ear infections, strep throat, bone and joint infections, pneumonia, skin infections, and urinary tract infections. It may be used to prevent *e-mail:
[email protected]
NH2 H N O
S N CH3
O O
OH
Figure 1. Chemical structure of cephalexin monohydrate.
bacterial endocarditis, and is taken orally. It is not effective against methicillin-resistant Staphylococcus aureus. It may be used in those who have mild or moderate allergies to penicillin but is not recommended to those having severe allergies. It has no effect against viral infections.4 Actually cephalosporins operate by inhibiting bacterial cell wall biosynthesis.5 In the literature a large number of analytical methods have been proposed for the determination of cephalexin in pure form, in pharmaceutical preparations, and in biological fluids. But the problems with these methods are: they
Vol. 27, No. 5, 2016
Khan et al.
913
are expensive, time consuming and have environmental effect, mostly temperature dependence. These methods include chromatographic,6-9 spectrofluorimetric,10-12 atomic absorption,13,14 capillary electrophoresis15 and flow injection analysis.16,17 However few spectrophotometric methods have been reported in the literature18-22 for the determination of cephalexin and most reported methods involve multistep procedures, and have poor selectivity and sensitivities and narrow linear ranges. Spectrophotometry is considered as one of the most suitable analytical techniques for the analysis of pharmaceutical compounds, because of its low cost, simplicity, wide linear dynamic range and wide availability. The present study is an effort of developing a simple, fast, inexpensive, accurate, sensitive and free of pronounced environmental effects method, which enable the determination of species of interest with a higher sensitivity and greater reproducibility. The method involves the addition of CeIV to cephalexin in acidic medium, followed by the determination of residual CeIV by reacting with a fixed amount of methyl orange and the absorbance was measured at 510 nm. The amount of CeIV reacted corresponds to the amount of cephalexin and measured absorbance was found to increase linearly with the concentration of cephalexin.
Preparation of reagents solutions
Experimental
An appropriate volume of cephalexin stock solution diluted to give final concentration of 0.6-20 µg mL-1 was added in a set of reaction flasks. 2.0 mL of 1.0 mol L-1 nitric acid was added followed by 1.5 mL of 2 × 10⁻³ mol L-1 CeIV. The contents of the flasks were set aside for 15 minutes with occasional shaking. Finally, 1.5 mL of 6 × 10⁻⁴ mol L-1 methyl orange solution was added to each flask. The solutions were transferred to 10 mL volumetric flasks and the volume was adjusted up to the mark with distilled water. The absorbance of each solution was measured at 510 nm against the corresponding reagent blank.
Materials and reagents
All reagents used were of analytical or of high grade purity and used without further purification. Distilled water was used throughout the work. Cerium sulfate tetrahydrate (Ce(SO4)2.4H2O) (Riedel-deHaën), nitric acid 65% (Sigma-Aldrich) and methyl orange (Fisher Chemical UK Limited), were used in this work. Standard reference cephalexin was gifted by pharmaceutical company. Commercial formulations of cephalexin Ceporex capsules 250 mg (manufactured by Glaxo SmithKlin, GSK, Pharmaceuticals Pakistan Limited Korangi Industrial area Karachi), and Nenflex capsules 500 mg (manufactured by Nenza Pharmaceuticals Industries, Pvt, Ltd, Industrial State Hayatabad Peshawar Pakistan) were purchased locally. Instruments
A double-beam UV-1800, ENG 240V spectrophotometer Shimadzu with 1 cm matched quartz cells was used to measure absorbance. A digital analytical balance (OHAUS Corporation USA) and digital water bath, Labacon, model LWB-104, single hexode was also used.
Nitric acid (1.0 mol L-1) solution was prepared fresh daily by dissolving 3.21 mL of HNO3 in distilled water and diluted to 50 mL with distilled water. CeIV (2 × 10⁻³ mol L-1) solution was prepared by dissolving 0.0404 g of Ce(SO4)2.4H2O in 5 mL H2SO4 (1.00 mol L-1) and diluted to 50 mL with distilled water. Methyl orange (1 × 10⁻³ mol L-1) solution was prepared by dissolving 0.0163 g of the reagent in distilled water and diluted up to 50 mL with distilled water. Working solutions of the required concentration (6 × 10⁻⁴ mol L-1) was prepared fresh daily by diluting appropriate volume of the stock solution with distilled water. Preparation of standard solution
A standard stock solution of cephalexin (100 µg mL-1) was prepared by dissolving 0.01 g of standard cephalexin in distilled water with heating (70 ºC) and diluted to 100 mL with the same solvent. Working solutions of required concentrations were prepared fresh daily before use from stock solution by dilution with distilled water. Recommended procedures for preparation of analytical curve
Application to pharmaceutical preparations
The contents of three tablets of each sample, i.e., Ceporex (250 mg per capsule) and Nenflex (500 mg per capsule) were weighed separately to get the average weight of one capsule. Powder equivalent to 0.01 g (100 µg mL-1) of cephalexin were then dissolved in distilled water with heating (70 ºC). The resultant solutions were then filtered and diluted to 100 mL with distilled water. An appropriate volume of this solution was then diluted with distilled water to obtain a cephalexin concentration within the working range. Aliquots of these solutions were then analyzed using the procedure described for the preparation of analytical
914
Development and Validation of a New Spectrophotometric Method for the Determination of Cephalexin
J. Braz. Chem. Soc.
curve and actual cephalexin contents in samples were calculated using the calibration equation.
Results and Discussion Ce IV has been used as an oxidizing agent in the determination of many pharmaceutical compounds by spectrophotometric23,24 and spectrofluorimetric25-27 methods or by both of them28,29 and chemiluminescence.30 The proposed method involves the addition of CeIV to cephalexin in acidic medium, followed by the determination of residual CeIV by reacting with a fixed amount of methyl orange, and the absorbance was measured at 510 nm (Figure 2).
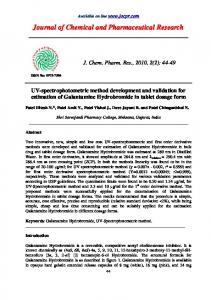
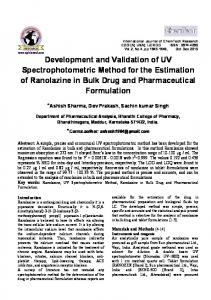
Figure 3. Effect of CeIV concentration. Conditions: 20 µg mL-1 cephalexin, 2 mL of nitric acid (1 mol L-1), 1 mL of CeIV (1 × 10⁻⁴-4 × 10⁻³ mol L-1), 1.5 mL of methyl orange (5 × 10⁻⁴ mol L-1), diluted to 10 mL, λmax 510 nm.
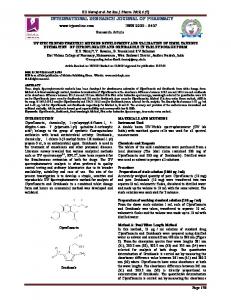
to determine the most suitable acid for optimum reaction development. Maximum absorbance was obtained by using 1.0 mol L-1 HNO3 (Figure 4).
Figure 2. Absorption spectrum of cephalexin. Conditions: 20 µg mL-1 cephalexin, 2 mL of nitric acid (1 mol L-1), 1 mL of CeIV (5 × 10⁻³ mol L-1), 1.5 mL of methyl orange (5 × 10 -4 mol L -1), diluted to 10 mL, λ 440‑620 nm.
Optimization of reaction conditions
A series of experiments was conducted to establish the optimum experimental variables at which maximum and reproducible analytical results were achieved. The parameters optimized included the effect of acidity, CeIV, dye and time. Effect of CeIV concentration
The influence of CeIV on the color intensity of the reaction was studied. To find the optimum concentration of CeIV, the effect of CeIV concentration was investigated in the range of 1 × 10⁻⁴-4 × 10⁻³ mol L-1. Maximum and constant absorbance of color product was obtained with 2 × 10⁻³ mol L-1 CeIV solution (Figure 3). The volume of CeIV solution was also optimized and 1.5 mL of 2 × 10⁻³ mol L-1 CeIV solution produced maximum colored formation. Effect of acid type and concentration
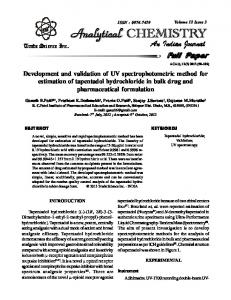
The oxidation reaction was carried out in acidic medium to avoid the precipitation of hydrated ceric oxide CeO2.H2O. Different acids such as H2SO4, HCl and HNO3 were tried
Figure 4. Effect of acid type and concentration. Conditions: 20 µg mL-1 cephalexin, 2 mL of H2SO4, HCl and HNO3 (1 mol L-1), 1 mL of CeIV (2 × 10⁻³ mol L-1), 1.5 mL of methyl orange (5 × 10⁻⁴ mol L-1), diluted to 10 mL, λmax 510 nm.
Effect of dye concentration
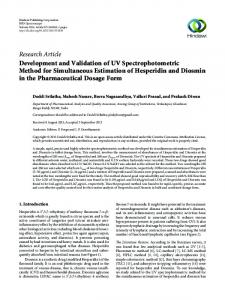
The effect of dye concentration on the intensity of color developed was tested using different concentration of dye. To find the optimum concentration of methyl orange, the effect of methyl orange concentration was studied in the range 3-8 × 10⁻⁴ mol L-1. Maximum colored formation was observed with 6 × 10⁻⁴ mol L-1 of methyl orange (Figure 5). The effect of volume of methyl orange solution was also investigated and 1.5 mL of 6 × 10⁻⁴ mol L-1 of methyl orange solution give maximum absorbance. Effect of time and temperature
The reaction between cephalexin and Ce IV in the presence of HNO3 was completed after 10 min of mixing, but 15 min was sufficient to get maximum absorbance. The absorbance for minimum and maximum times is 0.537 and 0.753, respectively. The effect of temperature was
Vol. 27, No. 5, 2016
915
Khan et al.
Figure 5. Effect of methyl orange concentration. Conditions: 20 µg mL-1 cephalexin, 2 mL of HNO3 (1 mol L-1), 1 mL of CeIV (2 × 10⁻³ mol L-1), 1.5 mL of methyl orange (3-8 × 10 -4 mol L -1), diluted to 10 mL, λmax 510 nm.
studied in the range of 25-70 oC. Raising the temperature does not accelerate the oxidation process and does not give reproducible results, so the reaction was carried out at room temperature. The color produced from the reaction between the remaining unreacted CeIV and methyl orange develops immediately.
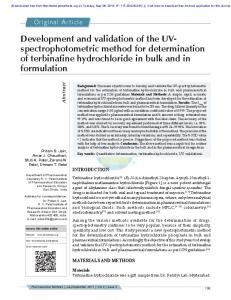
strong correlation coefficient of 0.992 (Figure 7). The limit of detection (LOD) was calculated by using the minimum level of concentration at which cephalexin can be detected reliably (3.3 × standard deviation, SD) using nine replicates determination and was found to be 0.221 µg mL-1. The limit of quantification (LOQ) was similarly calculated by using the lowest concentration of cephalexin that can be measured with satisfactory precision and accuracy (10 × SD) and was found to be 0.736 µg mL-1. The optical characteristic such as the linear regression equation, intercept, slope, correlation coefficient, and relative standard deviation of the response factor are given in Table 1. The molar absorptivity was calculated and was found to be 9.8 × 10⁴ L mol-1 cm-1. The sensitivity of the proposed method is compared with other reported methods in Table 2, which shows that sensitivity of the present method is greater than those of previously reported methods. Only the spectroflurometric method has greater sensitivity than the present method due to its lower limit of detection but it has a narrow range as compared to the present method.
Stability of the complex
The stability of the complex was investigated by measuring absorbance regularly for up to 60 minutes. It was observed that no change in absorbance occurred. Thus the complex formed is stable and will not affect the results of analysis even if the absorbance is measured after 1 hour of dilution (Figure 6).
Figure 7. Effect of concentration of cephalexin on absorbance. Conditions: 0.6-20 µg mL-1 cephalexin, 2 mL of HNO3 (1 mol L-1), 1 mL of CeIV (2 × 10⁻³ mol L-1), 1.5 mL of methyl orange (6 × 10⁻⁴ mol L-1), diluted to 10 mL, λmax 510 nm. Table 1. Optical characteristics and statistical analysis of calibration graphs for the determination of cephalexin by the proposed method Parameter
Value
Wavelength (λmax) / nm Linear range / (µg mL ) -1
Figure 6. Effect of time on stability of reaction product after dilution. Conditions: 20 µg mL-1 cephalexin, 2 mL of HNO3 (1 mol L-1), 1 mL of CeIV (2 × 10⁻³ mol L-1), 1.5 mL of methyl orange (6 × 10⁻⁴ mol L-1), diluted to 10 mL, λmax 510 nm.
Analytical figures of merit
Under the optimum experimental conditions of the proposed method, a linear correlation was found between absorbance and cephalexin concentration. Beer’s law was obeyed in the concentration range of 0.6‑20 µg mL-1 with a
Molar absorptivity / (L mol-1 cm-1) Limit of detection / (µg mL-1) Limit of quantification / (µg mL-1) Regression equation
510 0.6-20 9.8 × 10⁴ 0.221 0.736 y = 0.145x − 0.191
Slope (b)
0.145
Intercept (a)
−0.191
Determination coefficient (R2)
0.992
Standard deviation / (µg mL-1)
0.026
Relative standard deviation / %
4.4
916
Development and Validation of a New Spectrophotometric Method for the Determination of Cephalexin
J. Braz. Chem. Soc.
Table 2. Comparison of the present method and other reported methods for the determination of cephalexin levels Method
Linear range / (µg mL-1)
Limit of detection (LOD) / (µg mL-1)
Reference
Spectrophotometry
1.5-10
0.90
2
Spectrofluorimety
0.04-0.4
7.76a
10
Atomic absorption spectroscopy
5-50
1.66
14
Spectrophotometry
5-60
1.22
18
10-110, 10-120
2.236, 2.090
31
0.6-20
0.221
present method
HPLC
b
Spectrophotometry
Unit: ng mL-1; bHPLC: high-performance liquid chromatography.
a
Effect of interferences
The effects of interferences from the commonly used excipients such as sucrose, starch, glucose and fructose used in pharmaceutical preparations of cephalexin were investigated (Figure 8). Under the optimized experimental conditions, to a known amount of drug (cephalexin 0.6 µg mL-1), excipients in different concentration in the ratio of 1:1, 1:2, 1:4, 1:6, 1:8 and 1:10 were added and investigated by the proposed method. A 5% error criterion was adopted. None of these common excipients was found to cause interferences at lower concentrations. But at higher concentration the sucrose and fructose was found to produce non-significant interferences.
Table 3. Accuracy and precision of the present method using standard cephalexin solution Amount takena / Amount founda / Recovery ± RSDb / % (μg mL-1) (μg mL-1) 0.6 0.544 90.6 ± 1.1 0.8 0.812 101.6 ± 1.4 1.0 1.029 102.9 ± 3.6 Mean 98.4 Standard deviation ± 6.7 0.42 (4.303) t-test a Results are the averages of three separate analyses; bRSD: relative standard deviation. Table 4. Evaluation of accuracy and precision of the present method for cephalexin determination in pharmaceutical preparations Pharmaceutical preparation
Amount takena / Amount founda / (μg mL-1) (μg mL-1) 0.6 0.592 Ciporex capsule 0.8 0.791 (250 mg) 1.0 1.026 0.6 0.629 Nenflex capsule 0.8 0.830 (500 mg) 1.0 1.048 a Results are the averages of three separate analyses; standard deviation.
Figure 8. Effect of common excipients on determination of cephalexin by the proposed method.
Reliability of the method
The precision of the developed method was investigated by determining cephalexin in pure form and pharmaceuticals preparations using three different concentrations within the calibration curve range, in triplicate. Results are listed in Table 3 for the standard and in Table 4 for pharmaceutical preparations. The percent recoveries obtained ranged from 90.6 to 102.9% for the standard and 98.7 to 104.8% for pharmaceutical preparations with narrow relative
Recovery ± RSDb / % 98.7 ± 7.2 98.9 ± 5.9 102.6 ± 3.1 104.8 ± 2.2 103.7 ± 5.2 104.8 ± 1.4 b RSD: relative
standard deviations, indicating that proposed method has good reproducibility. The accuracy of the present method was investigated by standard addition method using two different brands of drugs Ciporex capsule (250 mg) and Nenflex capsule (500 mg). Certain amounts of standard cephalexin solution were added to tablet solutions and analyzed by the proposed method. Recoveries were calculated by comparing the results obtained before and after adding standard cephalexin solution, and percent recoveries ranged from 95.7 to 103.2% (Table 5). Applicability of the proposed method
The devised method was successfully applied to the determination of cephalexin in the two pharmaceutical
Vol. 27, No. 5, 2016
Table 5. Evaluation of cephalexin recovery percent in commercial formulations (capsules) using the standard addition method Pharmaceutical preparation
917
Khan et al.
Amount takena / Amount founda / (μg mL-1) (μg mL-1)
Recovery ± RSDb / %
Ciporex capsule (250 mg)
0.6 0.8 1.0
0.590 0.779 0.977
98.4 ± 2.4 97.4 ± 3.6 97.7 ± 2.9
Nenflex capsule (500 mg)
0.6 0.8 1.0
0.581 0.826 0.957
96.8 ± 2.9 103.2 ± 1.5 95.7 ± 1.5
Acknowledgments The authors are grateful to the Bacha Khan University Charsadda KPK, Pakistan for providing facility to conduct this research.
References 1. Panda, S. S.; Kumar, R. V. V. B.; Dash, R.; Mohanta, G.; Sci. Pharm. 2013, 81, 1029.
Results are the averages of three separate analyses; RSD: relative standard deviation.
2. Hassan, O. R.; Chem. Sci. Trans. 2013, 2, 1110.
preparations: Ciporex capsule (250 mg) and Nenflex capsule (500 mg). The results obtained were in close agreement with the label quantities (Table 6), which shows that the proposed method can be used to determine cephalexin quantities in pharmaceutical formulations.
4. Alhamd, J. K. A.; World J. Pharm. Pharm. Sci. 2014, 3, 1185.
a
b
3. Li, F. Y.; Han, J.; Wang, Y.; Ma, J. J.; Yan, S. Y.; J. Chem. 2013, 1.
Table 6. Determination of cephalexin in pharmaceutical preparations (capsules)
5. El-Shaboury, S. R.; Mohammed, F. A.; Saleh, G. A.; Rageh, A. H.; Nat. Sci. 2010, 2, 432. 6. Hu, Q. L.; Yin, L. C.; Du, H. Y.; Zeng, P. Z.; J. Anal. Methods Chem. 2012, 1. 7. Carroll, M. A.; White, E. R.; Jancsik, Z.; Zarembo, J. E.; J. Antibiot. 1977, 30, 397. 8. Hsu, M. C.; Lin, Y. S.; Chung, H. C.; J. Chromatogr. A 1995,
Label value / (mg per capsule)
Found valuea ± SDb
Recovery ± RSDc / %
Ciporex capsule
250
250.9 ± 0.9
100.4 ± 2.2
Nenflex capsule
500
522.3 ± 0.2
104.5 ± 0.6
Brand name
Results are the averages of three separate analyses; bSD: standard deviation; cRSD: relative standard deviation. a
692, 67. 9. Jeswani, R. M.; Sinha, P. K.; Topagi, K. S.; Damle, M. C.; Int. J. Pharm. Tech. Res. 2009, 1, 527. 10. El-Wasseef, R. D.; Spectrosc. Lett. 2007, 40, 797. 11. Dani, M. A. M. R.; Elbashir, A. A.; Int. J. Pharm. Chem. Res. 2013, 2, 1. 12. Zhang, J.; Wang, Z.; Mi, T.; Wenren, L.; Wen, K.; Food Anal.
Conclusions
Methods 2014, 7, 879. 13. Al-Noor, H. T.; Jarad, J. A.; Hussein, O. A.; Int. J. Chem. Process
A fast, simple, sensitive, selective and inexpensive spectrophotometric method was developed for quantification of cephalexin that is widely available in the market and manufactured by the indigenous units. The developed method was found to have a wider linear range and lower limits of detection and quantification than other reported methods. The method is rapid and less tedious than many reported spectrophotometric methods. The present method can be applied at ambient temperature; color development is instantaneous and does not require strict pH control or tedious liquid-liquid extraction step. The change in the acid was proven to be responsible for twice improvement in sensitivity. The method employs inexpensive and easily available chemicals and instrument. The color formed is highly stable leading to very precise results. These advantages make the method a valuable alternative to many existing methods for the determination of cephalexin levels in commercial tablet formulations with good recovery and excellent reproducibility. Finally, excipients commonly found in pharmaceutical preparations did not interfere with the analysis.
Eng. Res. 2014, 11, 109. 14. Al-Ghannam, S. M.; J. Food Drug Anal. 2008, 16, 19. 15. Hancu, G.; Kelemen, H.; Rusu, A.; Gyeresi, A.; J. Serb. Chem. Soc. 2013, 78, 1413. 16. Meyer, U. J.; Zhi, Z. L.; Loomans, E.; Spener, F.; Meusel, M.; Analyst 1999, 124, 1605. 17. Zhi, Z. L.; Meyer, U. J.; Van den Bedem, J. W.; Meusel, M.; Anal. Chim. Acta 2001, 442, 207. 18. Patel, S. A.; Patel, J. N.; Int. Res. J. Pharm. 2011, 2, 123. 19. Omar, M. A.; Abdelmageed, O. H.; Attla, T. Z.; Int. J. Anal. Chem. 2009, 1. 20. El-Shaboury, S. R.; Mohammed, F. A.; Saleh, G. A.; Rageh, A. H.; Nat. Sci. 2010, 2, 432. 21. Alwarthan, A. A.; Fattah, S. A.; Zahran, N. M.; Talanta 1992, 39, 703. 22. Saleh, G. A.; Askal, H. F.; Radwan, M. F.; Omar, M. A.; Talanta 2001, 54, 1205. 23. Rajendraprasad, N.; Basavaiah, K.; J. Anal. Chem. 2010, 65, 482. 24. Devi, O. Z.; Basavaiah, K.; Revanasiddappa, H. D.; Vinay, K. B.; J. Anal. Chem. 2011, 66, 490.
918
Development and Validation of a New Spectrophotometric Method for the Determination of Cephalexin
25. Shah, J.; Jan, M. R.; Khan, M. N.; Inayatullah; J. Appl. Spectrosc. 2013, 79, 922. 26. Shaalan, R. A.; Cent. Eur. J. Chem. 2010, 8, 892.
J. Braz. Chem. Soc.
30. Yu, F.; Chen, L.; Chen, F.; Microchim. Acta 2008, 161, 185. 31. Abdulghani, A. J.; Jasim, H. H.; Hassan, A. S.; Pak. J. Chem. 2012, 2, 1.
27. Tabrizi, A. B.; J. Food Drug Anal. 2007, 15, 242. 28. Abdellatef, H. E.; El-Henawee, M. M.; El-Sayed, H. M.; Ayad, M. M.; Spectrochim. Acta, Part A 2006, 65, 996. 29. Mahgoub, H.; J. Pharm. Biomed. Anal. 2003, 31, 767.
Submitted: August 31, 2015 Published online: December 7, 2015