method for determination of quercetin in green tea simpler and faster than other available methods. RP. HPLC analysis was performed by isocratic elution with a ...
ISSN 1061�9348, Journal of Analytical Chemistry, 2013, Vol. 68, No. 10, pp. 906–911. © Pleiades Publishing, Ltd., 2013.
ARTICLES
Development and Validation of a New RP�HPLC Method for Determination of Quercetin in Green Tea1 Ivan M. Savic, Vesna D. Nikolic, Ivana M. Savic, Ljubisa B. Nikolic, and Mihajlo Z. Stankovic Faculty of Technology, University of Nis Bulevar oslobodjenja 124, Leskovac, 16000 Serbia Received February 14, 2012; in final form December 13, 2012
Abstract—Green tea (Camellia sinensis) contains quercetin as a bioactive compound. Quercetin has anti� inflammatory and anticancer effects. The aim of this paper was to develop and validate an RP�HPLC method for determination of quercetin in green tea simpler and faster than other available methods. RP� HPLC analysis was performed by isocratic elution with a flow rate of 1.0 mL/min. Pure methanol was used as a mobile phase, while the quantification was effected at 370 nm. The separation was performed at 35°C using a C18 column (4.6 × 250 mm, 5 µm). The results showed that the peak area response is linear within the concentration range of 10–70 µg/mL (r = 0.9986). The values of LOD and LOQ were 1.2 and 4 µg/mL, respectively. For the intra�day and intra�instrument reproducibility, RSD were in the range of 0.05–0.84% and 0.89–1.55%, respectively. The results of accuracy for the different concentrations of quercetin (40, 50 and 60 μg/mL) were 101.3, 98.4, and 98.2%. The developed and validated method was successfully applied to the determination of quercetin in green tea extract. Keywords: development, validation, RP�HPLC, quercetin, green tea DOI: 10.1134/S1061934813100080 1
Green tea (Camellia sinensis) originates from Chi� na and has anticancer, antiinflammatory and antioxi� dative activity. Green tea has attracted significant at� tention for its health benefits in a variety of disorders, ranging from cancer to weight loss [1]. Tea is the most consumed drink in the world after water [2].
A plant extract of tea contains quercetin as a bio� active compound [3, 4]. The estimated amounts of quercetin are in the range of 2–2.5 g/kg of the plant material. Otherwise, a quercetin (3,3',4',5,7�pen� tahydroxyflavone) belongs to a group of polyphe� nols and is the most abundant dietary flavonoid [5 ⎯ 8]. The structural elements of quercetin are three rings and five hydroxyl groups, which are the building blocks for other flavonoids. Several chromatographic techniques have been employed to separate, characterize, and quantify indi� vidual polyphenols in teas [9]. The different methods for monitoring the quercetin concentration in the green tea extract were described in the literature. Wang et al. [10] optimized the conditions for hydrolyzing and determining flavonols in tea leaves and tea infu� sions in an isocratic elution HPLC system. The two high resolution, gradient elution reverse�phased HPLC systems for the separation of over 30 flavonols, flavan�3�ols, and related compounds in green and black teas and their identification by diode array de� tection and electrospray mass spectrometry (MS) us� 1 The article is published in the original.
ing an ion trap instrument with a MSn facility was de� scribed [11]. Analysis of the constituents of extracts of tea (Camellia sinensis L.) and Rooibos (Aspalathus lin� earis) leaves using thin�layer chromatography (TLC) was conducted by Ligor et al. [12]. Recently, Horie and Kohata [13] suggested capillary electrophoresis as a rapid technique for the estimation of those compo� nents of green tea that contribute to tea quality. The primary advantage of capillary electrophoresis is the relatively short analysis time (about 10 min compared to 30 min for HPLC). Direct analysis of infusions of green tea with electrospray ionization mass spectrom� etry operated in the negative ionization mode met with limited success in terms of the identification of prom� inent polyphenols and other minor components [14]. In the literature, there are the different methods for simultaneous monitoring of polyphenols in tea, but with a long time of analysis and complex procedure. Thus, the object was to develop and validate a simple RP�HPLC method for rapid, precise, accurate and sensitive determination of quercetin in the ethanol extracts from green tea. EXPERIMENTAL Samples and reagents. Standard quercetin sample was purchased from Merck Chemicals Ltd. (United Kingdom). Methanol was HPLC grade, while ethanol (96%) was analytical grade. Those were obtained from Sigma�Aldrich (United States).
906
DEVELOPMENT AND VALIDATION OF A NEW RP�HPLC METHOD
Plant material. Green tea (Camellia sinensis) was purchased from AD Aleva (Novi Knezevac, Serbia). Plant material was dried at room temperature, and groud in ellectrical mill to produce a fine powder of the average particle size of 0.4 mm. Apparatus. The method development was per� formed with an Agilent 1100�Series HPLC system. It consists of a DAD detector and Agilent 1100�Series autosampler (Faculty of Technology, Leskovac). The system was controlled and data analyses were tested by Agilent HPLC Data Analysis software. The assays were reproduced using another LC system for repeat� ability. This system contained an Agilent 1100�Series binary pump and Agilent 1100�Series DAD detector (Zdravlje�Actavis, Leskovac). The detector was set and the peak areas were integrated automatically by the computer using the Agilent HPLC Data Analysis software program. Extraction of quercetin from green tea. Plant mate� rial (green tea, Camellia sinensis) was disintegrated in laboratory mill and about 2 g was transferred into the round�bottom flask of 100 mL. After adding of 96% ethanol in the solid to liquid ratio of 1 : 25 (m/V), the mixture was put under reflux for 1 h at the boiling tem� perature of solvent. The extraction temperature was maintained using a water bath. The solid matrix was separated from liquid extract by filtering. Then, the extract was evaporated under reduced pressure on the rotary evaporator. The extract was dried to the con� stant mass in a desiccator. Preparation of samples for HPLC analysis. The dried plant extract (0.05 g) was transferred into a 10 mL flask and dissolved in 5 mL of 6 M hydrochloric acid and 5 mL of a mobile phase. The sample was sonificated for 15 min, filtered through a cellulose membrane of 0.45 μm (Econofilters, Agilent Technologies, Germa� ny), and an aliquot of 20 μL was injected into the HPLC system. Quercetin was identified using retention time of the quercetin standard. Chromatographic conditions. RP�HPLC analysis was performed by isocratic elution with a flow rate of 1.0 mL/min. Methanol was used as a mobile phase, which was filtered through a 0.45 μm Millipore filter before injecting into column. The injected volume of samples was 20 μL, while the detection wavelength was 370 nm. The separation was carried out at temperature of 35°C using a ZORBAX Eclipse XDB�C18 column (4.6 × 250 mm, 5 μm), Agilent Technologies, USA. Analytical method validation. Linearity. The se� ries of quercetin standard solutions in the range from 10−100 μg/mL were prepared to establish the linearity of proposed method. Accuracy. To determine the accuracy of the pro� posed method, different concentrations of quercetin (40, 50 and 60 μg/mL) were prepared from indepen� dent stock solutions and analyzed (n = 10). Accuracy was assessed as the percentage accuracy and mean % recovery. To provide an additional support to the ac� JOURNAL OF ANALYTICAL CHEMISTRY
Vol. 68
907
curacy of the developed assay method, standard ad� dition method was employed. It involves the addition of different concentrations of pure quercetin (5, 10 and 15 μg/mL) to a known pre�analyzed sample. Precision. Inter�day, intra�day and inter�instru� ment variation were studied to determine the interme� diate precision of the proposed analytical method. Three different concentrations of quercetin (40, 50 and 60 μg/mL) were analyzed for three days (three times, n = 3) to study the intra�day variation. The same procedure was followed for three different days to study the inter�day variation (n = 10). One set of different concentrations was reanalyzed by proposed method using another HPLC Agilent 1100�Series sys� tem to study inter�instrument variation (n = 10). Limit of detection (LOD) and limit of quantitation (LOQ). The LOD and LOQ of quercetin were deter� mined using calibration standards. LOD and LOQ were calculated as 3.3 σ/S and 10 σ/S, respectively, where S is the slope of the calibration curve and σ is the standard deviation of y�intercept of regression equation (n = 10). Robustness. Robustness is tested by deliberately in� troducing small changes during the development of the analytical procedure and examining the effect in a particular aspect of its performance, normally its accuracy [15]. Robustness of method can be tested by use of experimental design [16–21]. The influence of independent variables on the response value is possi� ble to investigate using this methodology. A full fac� torial design was used for robustness investigation, where a temperature and flow rate of mobile phase was used as independent variables. The tested tem� perature was 30, 35 and 40°C, while the flow rate was 0.8, 1.0 and 1.2 mL/min. The required number of ex� perimental runs was nine, which were repeated three times. A StatSoft Statistica Version 8.0 (StatSoft Inc., Tulsa, USA) was used to generate the experimental designs, statistical analysis and regression model. Ex� perimental data were fitted by the second�order poly� nomial model. RESULTS AND DISCUSSION HPLC method optimization. An RP�HPLC meth� od was developed and validated for the determination of quercetin in the plant extract. The chromatographic conditions were optimized to provide a good perfor� mance of the assay. During the optimization of the method, different stationary phases like C18 and C8, different mobile phases and organic modifiers like ac� etonitrile in the mobile phase were tried. The satisfac� tory separation was achieved on a ZORBAX Eclipse XDB�C18 column (4.6 × 250 mm, 5 μm) using meth� anol as a mobile phase during analysis of quercetin standard. If acetonitrile was used in combination with methanol, the separation of quercetin in the extract was unsatisfactory. The maximum absorption of quer� No. 10
2013
908
SAVIC et al. 2.420
mAU
400 300 200
3.606 3.855 4.280
100 0 2
4
6
8
10
12
14 min
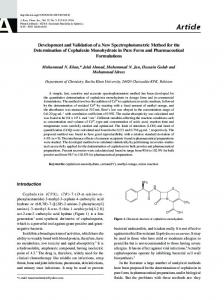
Fig. 1. The chromatogram of standard solution of quercetin.
cetin was detected at 370 nm, and this wavelength was chosen for quercetin determination. The retention times of quercetin in the standard solution (50 μg/mL) was 2.420 min (Fig. 1). The chromatographic parameters such as column efficiency and peak asymmetry were reconsidered for the quercetin standard. According to the obtained Number of Theoretical Plates (N = 1568), the conclu� sion is that the column efficiency is satisfactory (HETP = 159). The asymmetry peak of 0.41 value in� dicates that the peak is not ideally symmetric, this is not a Gauss’s peak. Having in mind that Wab < Wbc, there is certain interaction between the stationary phase and the investigated component. Table 1. Validation parameters of the RP�HPLC method of quercetin Parameter Regression Slope, S.E.a
101.36 (0.455)
Intercept, S.E. a
513.33 (0.112)
Regression coefficient, r
0.9980
Validation parameters Linearity, µg/mL
10–70
Limit of detection, LOD, µg/mL
1.2
Limit of quantification, LOQ, µg/mL
4
Note: a⎯standard error of mean
Validation. The linearity range for quercetin esti� mation was 10–70 μg/mL (r = 0.9980) (Table 1). A high value of regression coefficient indicates a good fitting of the curve. The precision of the fit was further confirmed from the S.E. at 95% confidence limits, values of the intercept and slope. A one�way analysis of variance (ANOVA) test was performed based on the values observed for each pure standard substance concentration during the rep� licate measurement of the standard solutions. The cal� culated F�value (Fcalc) was found to be less than the crit� ical F�value (Fcrit) at 5% significance levels (Table 2). The accuracy was determined in the range from 40 to 60 μg/mL (Table 3). The excellent mean recovery values, close to 100%, and their low standard deviation values (RSD < 1.0) represent high accuracy of the analytical method. The validity and reliability of the proposed method was fur� ther assessed by recovery studies via standard addition method. The mean recoveries (%RSD) for the con� centration of 50 μg/mL are shown in Table 4. These results revealed that any small change in the quercetin concentration in the solution could be accu� rately determined by the proposed analytical method. Precision was determined by studying the repeat� ability and the intermediate precision. Repeatability (% RSD) ranged from 40 to 60 μg/mL at all three lev� els of quercetin concentrations (Table 5). The results of repeatability studies indicate the pre� cision under the same operating conditions over a short interval of time and the inter�assay precision. The intermediate precision expresses within�labora� tory variations in different days and with different instruments. In the intermediate precision study, % RSD values were not more than 2.0% in all cases
JOURNAL OF ANALYTICAL CHEMISTRY
Vol. 68
No. 10
2013
DEVELOPMENT AND VALIDATION OF A NEW RP�HPLC METHOD
909
Table 2. One�way ANOVA test for linearity of quercetine solution by the proposed method F�value Source of variation Degree of freedom, d.f. Sum of squares, SS Between group Within group Total
Mean sum of squares, MS
3.13 × 1.11 × 109 1.11 × 10⁹
3.13 × 1.11 × 109
109
1 10 10
Fcalc
Fcrit
0.078
1.432a
109
Note: a⎯theoretical value of F (1, 10) based on one�way ANOVA test at p = 0.05 level of significance
Table 3. Accuracy and precision data for the developed method (n = 10) Predicted concentration, mg/mL Level
Mean recovery, %
40 mg/mL 50 mg/mL 60 mg/mL
mean, ±SD
RSD, %
40.5 ± 0.3 49.2 ± 0.5 58.9 ± 0.3
0.79 0.67 0.53
Total drug Pure drug found, added, µg/mL µg/mL, ±SD
% recovery, RSD, %
50
0
50.2 ± 0.3
100.4 ± 0.6
50
5
54.3 ± 0.3
98.8 ± 0.5
50
10
60.3 ± 0.4
100.5 ± 0.6
50
15
63.8 ± 0.4
98.2 ± 0.5
1.3 –1.5 –1.8
LOD and LOQ for quercetin were found to be 1.2 and 4 μg/mL (Table 1), respectively. Stability of solution. Different concentrations of quercetin (40, 50 and 60 μg/mL) were used to deter� mine the stability of the test solutions. The initial con� centration of quercetin was compared to the concentra� tion of quercetin in same solutions after 24 and 48 h. Test and standard solutions were stored in autosampler vials at ambient temperature. The obtained results for test and standard solutions are shown in Table 6. Robustness of method. A full factorial design for two variables at three levels was successfully applied for monitoring of method robustness. An interaction be� tween two process parameters has a small impact on the number of theoretical plates. This interaction, pre� sented in the form of three�dimensional diagram, is shown in Fig. 2. Thus, the number of theoretical plates has almost negligible effect on the performance of HPLC system and what is confirmed by use of ANO� VA test. The proposed method stays stable even after
Table 4. Determination of quercetin by standard addition method (n = 10) Concentration, µg/mL
101.3 98.4 98.2
Accuracy, %
(Table 5). RSD values found for the proposed analyti� cal method were well within the acceptable range indi� cating that the method has excellent repeatability and intermediate precision. %RSD values for the precision studies with real samples of quercetin were found to be less than 2. Table 5. System precision study (n = 10)
Estimated concentration Concentration, µg/mL
intra�day reproducibility, RSD, % (n = 10)
Intra�instrument reproducibility, RSD, % n = 10
day 1
day 2
day 3
40
38.95 (0.81)
40.94 (0.67)
40.48 (0.51)
39.06 (0.89)
50
51.85 (0.05)
50.12 (0.21)
49.78 (0.08)
50.83 (1.41)
60
59.55 (0.18)
58.51 (0.84)
60.15 (0.08)
59.34 (1.55)
JOURNAL OF ANALYTICAL CHEMISTRY
Vol. 68
No. 10
2013
910
SAVIC et al.
Table 6. Stability of quercetin solutions Time elapsed
Sample
c, μg/mL
% Recovery
50.00
100.0
49.31
98.6
48 h
51.02
102.0
Initial
40.00
100.0
39.21
98.0
48 h
41.04
102.6
Initial
50.00
100.0
50.84
101.6
48 h
48.92
97.8
Initial
60.00
100.0
58.65
97.7
60.97
101.6
Initial 24 h
24 h
24 h
24 h
st
1
2
3
48 h
remained unaffected by the variations introduced in the experimental design. The occurrence of significant effects on qualitative response is then in general of a minor importance to decide on its robustness. Applicability of the proposed method. The devel� oped and validated method was successfully applied for the determination of quercetin in the extract of green tea. The peak of quercetin in the extract was at 2.399 min (Fig. 3). The amount of quercetin in this ex� tract was found to be 0.5 g per 100 g of the dried ex� tract. *** A simple, rapid and reliable RP�HPLC method was developed and validated for routine analysis of quercetin in the plant extract of green tea. This method has advantages over all available methods for monitoring the quercetin concentration in green tea extracts, because it is faster and mobile phase compo� sition is simpler than other available HPLC methods in the literature.
the nominal changes of parameters, such as flow rate and temperature. Finally we would like to point out that the occur� rence of significant effects not always leads to a non� robust method. In a robustness test one should focus first on the qualitative response. The absence of signif� icant effects on this response indicates that the method
ACKNOWLEDGMENTS The authors are grateful to the colleagues of Phar� macy and Chemical Industry Zdravlje�Actavis, Serbia for the given practical help. This work was supported by the Ministry of Education, Science and Technolog� ical Development of the Republic of Serbia under the project TR�34012. Ivan Savic is a recipient of a schol�
N 10000 8000
>8000