Vishnu Choudhari et al. | Int. J. Res. Pharm. Sci. Vol-1, Issue-3, 253-258, 2010
ISSN: 0975-7538 Research Article www.ijrps.pharmascope.org
Development and validation of a RP-HPLC-PDA method for simultaneous estimation of Drotaverine and Aceclofenac in a combined dosage form Vishnu Choudhari*, Kunal Ingale, Madhusmita Sahoo, Pratima Syal, Snehal Ingale, Santosh Shinde, Abhijit Sutar, Bhanudas Kuchekar MAEER’S Maharashtra Institute of Pharmacy, S. No. 124, MIT Campus, Paud Road, Kothrud, Pune - 411038, MS, India ABSTRACT A simple, precise, rapid and accurate RP-HPLC-PDA method has been developed for the simultaneous estimation of drotaverine HCl (DRT) and aceclofenac (ACE) in combined tablet dosage form. Formulation containing DRT with ACE are used as antispasmodic and anti-inflammatory agent. The chromatographic separation was achieved on Qualisil BDS C8 column (250 mm x 4.6 mm, 5.0 μ particle size) using methanol: THF: acetate buffer (68:12:20 v/v) pH adjusted to 5.0 with acetic acid, flow rate was 1.0 mL min -1 and column was maintained at 50 0C. Quantification -1 and linearity was achieved at 298 nm over the concentration range of 1 - 150 μg mL for Drotaverine HCl and 1.25 -1 – 187.5 μg mL for Aceclofenac. The method was validated for specificity, linearity, accuracy, precision, LOD, LOQ and robustness. The proposed method was optimized and validated as per the ICH guidelines. Keywords: Drotaverine; Aceclofenac; RP-HPLC-PDA; Method Validation; Column Liquid Chromatography. INTRODUCTION Drotaverine hydrochloride [DRT], 1-[(3, 4-diethoxy phenyl) methylene]-6, 7-diethoxy-1, 2, 3, 4-tetra hydro isoquinolene is an analogue of papaverine [The Merck Index 13th, 2001]. It acts as an antispasmodic agent by inhibiting phosphodiesterase IV enzyme, specific for smooth muscle spasm and pain, used to reduce excessive labor pain [Sethi SD., 2004]. Drotaverine hydrochloride is official in Polish Pharmacopoeia [Dahivelkar PP et al., 2007]. A few UV spectrophotometric [Dahivelkar PP et al., 2006; Metwally FH et al., 2006; Abdellatif HE et al., 2006] and HPLC [Panigrahi D et al., 2006; Mezei J et al., 1984; Dahivelkar PP et al., 2009] methods have been reported individually or in combination with other drugs for estimation of drotaverine hydrochloride. Aceclofenac [ACE] is chemically designated as 2-(2, 6Dichloroanalino) phenyl acetoxy acetic acid. It is a NSAID, used in the management of osteoarthritis, rheumatoid arthritis, and ankylosing spondylitis [The Merck th th Index 13 , 2001; Martindale 36 , 2009]. Aceclofenac is official in Indian pharmacopoeia [Indian pharmacopoeia 2007]. Various UV and HPLC methods for aceclofenac have been reported for its estimation individually or in combination with other drugs [Nikam AD et al., 2008; Shah R et al., 2008; Rajmane VS et al., 2009; * Corresponding Author Email:
[email protected] Contact: +91-9421081141 Received on: 23-04-2010 Revised on: 15-05-2010 Accepted on: 18-05-2010 ©Pharmascope Foundation | www.pharmascope.org
Momin MY et al., (2006); Musmade P et al., 585 (2007); Hasan NY et al., (2003)]. Authors have developed Ratio Derivative and Area Under Curve Spectrophotometeric methods for the combinations in the same laboratory. To our knowledge there is no HPLC method reported for the combination, availability of HPLC method with high sensitivity and selectivity will be very useful for the estimation of DRT and ACE in combined pharmaceutical dosage forms. Therefore the aim of the study was to develop a sensitive, precise, accurate and specific HPLC method for the determination of DRT and ACE simultaneously in formulation. The present work describes a simple RP-HPLC PDA method for the determination of DRT and ACE in tablets. The method was validated according to ICH guidelines and was found to be reproducible with good resolution between DRT and ACE. EXPERIMENTAL MATERIALS AND REAGENTS Tablets used for analysis were ESNIL manufactured by Dewcare, (Ahmadabad, India) were used for analysis containing DRT 80 mg and ACE 100 mg per tablet. Pure drug sample of DRT (98.5%) and ACE (99.8%) were obtained as a gift sample from Alkem Laboratories (Mumbai, India) and Curex pharmaceuticals (Jalgaon, India). HPLC grade Methanol and tetrahydrofuran (THF) were procured from Merck and Qualigens fine Chemicals, respectively (Mumbai, India). Ammonium Acetate and Acetic Acid was procured from Research Lab Fine Chem (Mumbai, India). Double distilled water and tablet placebo was made at lab scale only. 253
Vishnu Choudhari et al. | Int. J. Res. Pharm. Sci. Vol-1, Issue-3, 253-258, 2010
INSTRUMENTATION AND CHROMATOGRAPHIC CONDITIONS The HPLC system consisted of a binary pump (model Waters 515 HPLC pump), auto sampler (model 717 plus Auto sampler), column heater, and PDA detector (Waters 2998). Data collection and analysis were performed using Empower- version 2 software. Separation was achieved on Qualisil BDS C8 column (250 mm × 4.6 0 mm, 5.0 µ) columns maintained at 50 C using column oven. Isocratic elution with Methanol: THF: acetate buffer pH 5 (68:12:20v/v) mobile phase at the flow rate -1 of 1.0 mL min was carried out. The detection was monitored at 298 nm and injection volume was 20 µL. The peak purity was checked with the photodiode array detector. PREPRATION OF STANDARD SOLUTIONS AND CALIBRATION CURVE Mixture of Standard stock solution of DRT and ACE (in ratio 1:1.25 mg mL-1) was prepared in methanol. To study the linearity range of each component, serial dilutions of DRT and ACE were made from 1.0 to 150 µg mL-1and 1.25 to 187.50 µg mL-1, respectively in mobile phase and injected on to column. Calibration curves were plotted as concentration of drugs versus peak area response. From the standard stock solutions, a mixed standard solution was prepared containing the analytes in the given ratio and injected on to column. The system suitability test was performed from six replicate injections of mixed standard solution. ANALYSIS OF TABLET FORMULATIONS Twenty tablets were weighed accurately and a quantity of tablet powder equivalent to 80 mg of DRT (100 mg of ACE) was weighed and dissolved in the 80 mL of methanol with the aid of ultrasonication for 10 min and solution was filtered through Whatman paper No. 41 into a 100 mL volumetric flask. Filter paper was washed with the solvent, adding washings to the volumetric flask and volume was made up to mark. The solution was suitably diluted with mobile phase to get 80 μg mL 1 of DRT & 100 μg mL-1 of ACE. A typical chromatogram obtained from a sample solution is shown in Fig. 1.
METHOD DEVELOPMENT The HPLC method was validated in terms of precision, accuracy and linearity according to ICH guidelines. Assay method precision was determined using nine independent test solutions. The intermediate precision of the assay method was also evaluated as inter-day and intra-day precision. The accuracy of the assay method was evaluated with the recovery of the standards from excipients. Three different quantities (low, medium and high) of the authentic standards were added to the placebo. The mixtures were extracted and analyzed using the developed HPLC method. Linearity test solutions were prepared as described in Formulation analysis. The Limit of Detection (LOD) and Limit of Quantification (LOQ) for analytes were estimated by injecting a series of dilute solutions with known concentration. Values of LOD and LOQ were calculated by using σ (standard Deviation of response) and b (Slope of the calibration curve) and by using equations, LOD = (3.3 x σ)/ b and LOQ = (10 x σ)/ b. To determine the robustness of the method, the final experimental conditions were purposely altered and the results were examined. The drug solution was determined using the samples for short-term stability by keeping at room temperature for 12 hrs and then analyzing. The long-term sta0 bility was determined by storing at 4 C for 30 days. Auto-sampler stability was determined by storing the samples for 24 hrs in the auto-sampler. For method development and optimization, retention factor (k) was calculated by using parameters tR (retention time) and tM (elution time of the solvent front) and by using the equation k = (t R − t M)/ tM. METHOD OPTIMIZATION Well defined symmetrical peaks were obtained upon measuring the response of eluent under the optimized conditions after thorough experimental trials that can be summarized. Two columns were used for performance investigations, including Kromasil C18 (4.6×250mm, 5 micron) and Qualisil C8 (4.6×250mm, 5 micron), Kromasil C18 showed broad, unsymmetrical peak therefore it was replaced with Qualisil C8 column which produced symmetrical peaks with good resolution. The UV detector response of DRT and ACE was studied and the best wavelength was found to be 298 nm showing highest sensitivity. Mobile phase composition
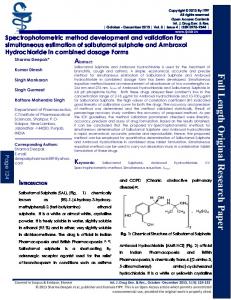
Figure 1: Chromatogram of working standard mixture of DRT (80 µg mL-1) and ACE (100 µg mL-1) with structure of analytes
©Pharmascope Foundation | www.pharmascope.org
Several modifications in the mobile phase composition were performed in order to study the possibilities of changing the selectivity of the chromatographic system. These modifications included the change of the type and ratio of the organic modifier, the pH, the concentration of acetate buffer, the flow rate, the temperature and the stability of DRT and ACE was also studied in methanol and mobile phase. The results obtained are shown in Table 1.
254
Vishnu Choudhari et al. | Int. J. Res. Pharm. Sci. Vol-1, Issue-3, 253-258, 2010
Figure 2: Effect of pH (A) and ionic strength (B) of Acetate Buffer in mobile phase on Retention times of DRO and ACE Table 1: System suitability parameters and results of precision at optimized chromatographic conditions System Suitability Name of Analyte
DRT ACE
Parameter
Value
Therotical platesa Peak Tailinga % R.S.D. Therotical platesa USP resolutiona Peak Tailinga % R.S.D.
3754 1.14 0.78 5394 3.61 1.02 0.52
Precision of the Methodb (n=5) Measured conc. (µg mL-1), Actual % R.S.D Conc. (µg mL-1) Intra-day Inter-day 60 60.03, 1.38 59.03, 1.35 80 79.01, 0.75 80.01, 0.70 100 100.01, 0.47 99.02, 0.29 75 74.43, 0.93 75.04, 1.76 100 100.05, 0.39 99.32, 0.75 125 124.79, 0.36 124.75, 0.45
a
USP-NF 29 section 621, pp. 2135. b Data expressed as mean for “measured concentration” values Type of organic modifier was investigated using mobile phases of pH ranging from 3.0-6.0. Fig. 2(A) shows that a pH of 5.0 was the Initially acetonitrile and water in different ratios were most appropriate one giving well-resolved peaks and tried. But in that, both drugs showed peak broadening highest no. of theoretical plates. There were always and the resolution was very less. So acetonitrile was asymmetric and broad peaks of ACE at pH values > 5.0. replaced by methanol, THF and water was replaced with various buffers with different pH and concentra- Concentration of Acetate Buffer (Ionic Strength) tion. Hence methanol: THF: acetate buffer pH 5 The effect of changing the concentration of acetate (68:12:20v/v) was suitable to get resolved and sharp buffer on the selectivity and retention times of the test peak. Methanol was the organic modifier of choice solutes was investigated using mobile phases containgiving symmetrical narrow peaks and good Resolution ing concentration of 10,15, 20, 25,30, 40 and 50 millireported in Table 1. moles of acetate buffer. Fig.2(B) shows that 25 milliRatio of organic modifier moles acetate buffer was found to be the most suitable giving best resolution and highest theoretical plate The effect of changing the ratio of organic modifier on count, lower buffer concentrations showed asymmethe selectivity and retention times of the test solutes tric and tailing problem. was investigated using mobile phases containing concentrations of 60-40% methanol. Table 1 shows that Effect of Flow rate 68% methanol was the best one giving well resolved The effect of flow rate on the formation and separation peaks and higher no. of theoretical plates. Ratios less of peaks was studied by varying the flow rate from 0.6 than 68% resulted in peaks with very long unaccepta-1 1.4; a flow rate of 1 mL min was optional for good ble retention times, where as ratios higher than 68% separation and resolution of peaks in a reasonable resulted in precipitation in the mobile phase. time. Effect of pH Effect of Temperature The effect of changing the pH of the mobile phase on The effect of Temperature on the formation, separathe selectivity and retention times of the test solutes tion and resolution was studied by varying the Tem©Pharmascope Foundation | www.pharmascope.org
255
Vishnu Choudhari et al. | Int. J. Res. Pharm. Sci. Vol-1, Issue-3, 253-258, 2010 0
perature from 35 – 55 C; we found that at lower Temperatures the peaks are not well resolved, whereas at 0 50 C the peaks show good symmetry and resolution. RESULTS AND DISCUSSION METHOD VALIDATION The method was validated, in accordance with ICH guidelines, for linearity, range, accuracy, precision, LOD and LOQ, specificity, ruggedness, and robustness [ICHQ2B, 2006]
also studied in terms of intra-day changes in peak area of drug solution on the same day and on three different days over a period of one week. The intra-day and inter-day variation was calculated in terms of percentage relative standard deviation and the results are given in Table 1. Accuracy of the method was calculated by recovery studies at three levels by standard addition method. The mean percentage recoveries obtained for DRT and ACE were 100.53% and 100.30%, respectively, reported in Table 2.
Table 2: Results of Tablet analysis and accuracy studies Formulation Study (n=6) Batch % Assay Found, Tablet % RSD Batch I 99.74, 1.05
Compound (Tablet Label Claim) Drotaverine (80mg) Aceclofenac (100mg)
Batch II
100.11, 1.23
Batch I
99.80, 0.93
Batch II
100.2, 1.32
Recovery ( accuracy) Study Recovery % Recovery, Level % RSD(n=3) 50 99.68, 1.07 100 100.10, 0.24 150 101.83, 1.0 50 99.46, 0.30 100 100.30, 0.49 150 101.16, 0.56
Table 3: Result of robustness study Factor
Level
Flow rate (mL min-1) Column oven temperature (0C) % of Methanol -1 (1.0 mL min ) Measurement Wavelength (nm)
0.9 1.1 48 52 65 70 296 300 Column I Column II 15 µL 25 µL 4.8 5.2 20 30
Separation Columna Injection volume pH Salt conc. (millimoles) a
Mean % Assay, % R.S.D. of Results Drotaverine Aceclofenac 100.08, 0.27 99.99, 0.06 98.80, 0.20 100.16, 0.22 100.20, 0.45 99.98, 0.24 99.54, 0.55 100.05, 0.77 99.71, 0.44 100.29, 0.25 98.70, 0.58 99.88, 0.87 99.45, 0.53 100.05, 0.77 99.80, 0.47 100.30, 0.28 100.60, 0.92 99.12, 1.29 99.9, 0.83 100.04, 0.94 100.02, 1.04 98.82, 1.05 99.80, 0.95 100.04, 0.89 99.90, 0.78 100.16, 0.06 100.30, 0.18 99.04, 0.22 100.24, 0.67 98.74, 0.34 99.58, 0.98 100.06, 0.45
Qualisil BDS-C8 columns from two different lots was used
Linearity and range For the construction of calibration curves, seven calibration standard solutions were prepared over the concentration range. Linearity was determined for DRT -1 in the range of 1-150 µg mL and for ACE 1.25-187.5 µg -1 mL . The correlation coefficient (‘r2’) values were > 0.999 (n = 7). Typically, the regression equations for the calibration curve was found to be y = 1.7869x−6.9502 for DRT, y=1.5196x−7.1907 for ACE. Precision and Accuracy The precision of repeatability was studied by replicate (n=5) analysis of tablet solutions. The precision was ©Pharmascope Foundation | www.pharmascope.org
Limit of Detection (LOD) and Limit of Quantitation (LOQ) The LOD and LOQ values were found to be 0.13 and 0.39μg mL-1 and 0.15 and 0.45 μg mL-1 for DRT and ACE, respectively. Robustness Robustness of the method was investigated under a variety of conditions including changes of flow rate, column oven temperature, column form different suppliers and wavelength of measurement. The mixed standard solution is injected in three replicates and sample solution of 100% concentration is prepared and 256
Vishnu Choudhari et al. | Int. J. Res. Pharm. Sci. Vol-1, Issue-3, 253-258, 2010
Figure 3: Specificity Chromatogram consists of A) Mobile Phase, B) Placebo, C) formulation, D-H) system suitability standards of DRT (80 µg mL-1) and ACE (100 µg mL-1) and online overlain PDA spectra of analytes injected in triplicate for every condition and % R.S.D. of assay was calculated for each condition. The degree of reproducibility of the results obtained as a result of small deliberate variations in the method parameters has proven that the method is robust Table 3. Specificity The specificity of the HPLC method is illustrated in Fig. 3, where complete separation of DRT and ACE was noticed in presence of tablet placebo. In addition there was no any interference at the retention time of DRT and ACE in the chromatogram of tablet solution. In peak purity analysis with photo diode array detector, purity angle was always less than purity threshold for all the analytes. This shows that the peak of analytes was pure and excipients in the formulation did not interfere the analytes. Solution stability studies Stability as described in method development under experimental section was studied. Result of shortterm, long-term and the auto sampler stability of the DRT and ACE solutions were calculated from nominal concentrations and found concentration. Results of the stability studies were within the acceptable limit (98– 102%). CONCLUSIONS Linear, precise, and accurate RP-HPLC-PDA method has been developed and validated for quantitative determination of DRT and ACE from tablet formulations. The manuscript describes, for the first time simultaneous estimation of the combination. All the parameters for the two titled drugs met the criteria of ICH guidelines for method validation. The method is very simple, specific, reliable, rapid and economic nature as all peaks are well separated and there is no interference by excipients peaks with total runtime of 5 min, which makes it especially suitable for routine quality control analysis work. The method can be extended for determination of analytes in plasma.
ACKNOWLEDGEMENT The authors would like to thank Alkem Laboratories (Mumbai India) and Curex pharmaceuticals (Jalgaon India) for providing gift samples of drugs. Authors are also thankful to the Management of MAEER’s Maharashtra Institute of Pharmacy, Pune for providing necessary facilities. REFERENCES Abdellatif HE, Ayad MM. A comparative study on various spectrometries with thin layer chromatography for simultaneous analysis of drotaverine and nifuroxazide in capsules. Chem. Pharm. Bull. Tokyo. 2006; 54: 807-13. Dahivelkar PP, Bari SB. Simultaneous derivative and multi-component spectrophotometric determination of drotaverine hydrochloride and mefenamic acid in tablets. Indian J. Pharm. Sci. 2007; 69: 812-4. Dahivelkar PP, Bari SB, Bhoir S, Bhagwat AM. High Performance Liquid Chromatographic Estimation of Drotaverine Hydrochloride and Mefenamic Acid in Human Plasma. Iranian J. Pharm. Research. 2009; 8: 209-15. Dahivelkar PP , Surana SJ. spectrophotometric method for simultaneous estimation of drotaverine hydrochloride and mefenamic acid in bulk and tablet formulation. Indian Drugs 2006; 43: 896-900. Hasan NY, Abdel EM, Elzeany BE, Wagieh NE. Stability indicating methods for the determination of aceclofenac. Il Farmaco. 2003; 58: 91-9. Indian Pharmacopoeia. Indian Pharmacopoeia Commission. Ghaziabad: 2007; 2: pp 63-4. ICH-Q2B Validation of analytical procedures: Methodology International Conference on Harmonization of Technical Requirements for Registration of Pharmaceuticals for Human Use, Geneva, Switzerland, 1996. th
Martindale - The Complete Drug Reference, 36 edn. RPS Publishing. Great Britain. 2009; pp 14-5. ©Pharmascope Foundation | www.pharmascope.org
257
Vishnu Choudhari et al. | Int. J. Res. Pharm. Sci. Vol-1, Issue-3, 253-258, 2010
Metwally FH, Abdelkawy M. Determination of nifuroxazide and drotaverine hydrochloride in pharmaceutical preparation by three independent analytical methods. J. AOAC Int. 2006; 89: 78-81. Mezei J, Kuttel S. A new method for high-performance liquid chromatographic determination of drotaverine in plasma. J. Pharm. Sci. 1984; 73: 1489-91. Momin MY, Yeole PG, Puranik MP, Wadher SJ. Reverse phase HPLC method for determination of Aceclofenac and Paracetamol in tablet dosage form. Indian J. Pharm. Sci. 2006; 68: 387-9. Musmade P, Subramanian G., Srinivasan KK. Highperformance liquid chromatography and pharmacokinetics of aceclofenac in rats. Analytica Chimica Acta. 2007; 585: 103–9. Nikam AD, Sampada SP, Gandhi SV. Estimation of paracetamol and Aceclofenac in tablet formulation by ratio spectra derivative spectroscopy. Indian J. pharm. Sci. 2008; 70: 635-7. Panigrahi D, Sharma R. Development and validation of an RP-HPLC method for simultaneous analysis of drotaverine and omeprazole in a tablet dosage form. Journal of Acta Chromatographica. 2008; 20: 439–50. Rajmane VS, Gandhi SV, Patil UP, Sengar MR. Simultaneous Determination of Drotaverine Hydrochloride and Aceclofenac in Tablet Dosage Form by Spectrophotometry. Eurasian J. Anal. Chem. 2009; 4: 184-90. Sethi SD. Textbook of Pharmacology. Elsevier, New Delhi: 2004; pp 831-40. Shah R, Magdum C, Patil SK, Chougule DK and Naikwade N, Validated Spectroscopic Method for Estimation of Aceclofenac from Tablet formulation. Research J. Pharm. and Tech. 2008; 1: 430-2. The Merck Index – An Encyclopedia of chemicals, Drugs, and biologicals, 13th edn, Merk Research Laboratories, Whitehouse station. New Jersey: 2001, pp 6,609-10.
©Pharmascope Foundation | www.pharmascope.org
258