determination of mequitazine. Alex. J. Pharm.1993; 7: 201â202. 7. Kelani KM, Aziz AM, Hegazy MA, Abdel-Fattah L: Assay of famotidine in API forms. Spectrosc.
Journal of Innovations in Pharmaceutical and Biological Sciences (JIPBS) ISSN: 2349-2759 Available online at www.jipbs.com
Research article
Development and validation of colorimetric method for the determination of aminocaproic acid in bulk and pharmaceutical formulation Shaza W. Shantier*, Mohamed E. Adam, Rashida S. Mohamed, Elrasheed A. Gadkariem Department of Pharmaceutical Chemistry, Faculty of Pharmacy, University of Khartoum, Sudan.
Key words: Colorimetric; Aminocaproic acid; Sodium nitroprusside. *Corresponding Author: Shaza W. Shantier, Department of Pharmaceutical Chemistry, Faculty of Pharmacy, University of Khartoum, Sudan.
Abstract Objectives: The aim of this work was to develop a simple, accurate and feasible colorimetric method for the analysis of aminocaproic acid (ACA) in bulk and pharmaceutical formulations. Method: The method was based on the coupling of ACA with sodium nitropurrside (SNP) to give a colored product having maximum absorption at 540 nm. The conditions affecting the reaction (SNP concentration, pH, color-developing time, temperature, and dilutent solvent) were investigated. Results: Under the optimum conditions, good linear relationship (r = 0.9986) was obtained between 0.2-1.0 mg/ml. The limits of detection and quantification were 0.07 mg/mL and 0.26mg/mL, respectively. The percentage recovery for the commercial preparation (Aminocaproic acid injection, 250 mg/ ml) was 100.60 ± 2.05 %, (n=3) which reflected no interference by the injection excipients. Based on the molar ratio, the reaction stoichiometry was found to be 2:1. Conclusion: The developed method was validated according to ICH guidelines and proved to be accurate and precise.
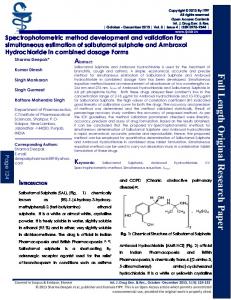
Introduction Introduction Sodium nitroprusside (SNP) has attracted considerable interest at various periods in chemical history. The pharmaceutical interest in SNP is due to its applications as an analytical reagent as well as a strong hypotensive agent. It has been known for many years as a colorforming reagent with thiols and some other sulphur containing compounds or ions [1]. It has been used as a valuable reagent for the detection and determination of wide variety of nucleophilic agents such as primary or secondary aliphatic amines, aldoximes, ketones, nitrils, phenols, pyrroles, quinones, thiols, thioureas and uracils [2-4]. Different techniques adapted SNP as an analytical reagent in their applications [5-7] Aminocaproic acid (Fig. 1) is a derivative and analogue of the amino acid lysine. It is indicated for the treatment of fibrinolysis and blood loss [8], intracranial hemorrhage [9] cirrhosis and hyperfibrinolysis [10].
Figure 1. Aminocaproic acid chemical structure.
Literature review revealed spectrophotometric [11, 12] and chromatographic methods [13, 14] for analysis of ACA in
pharmaceutical formulation and biological fluids, respectively. Although most of the reported methods are useful, yet some of these are either time consuming require sophisticated equipment or complicated for routine analysis especially in developing countries. Therefore, in the present work SNP was utilized for the development of simple and accurate colorimetric method for the determination of ACA in bulk and injection forms. Experimental Materials and methods Sample and standard Aminocaproic acid injection (Amicar® 250mg/ml, Expiry date 2015) was obtained from Hospira, USA. The reference standard was kindly provided by Saudi Arabia Central lab, KSA, Retest 2014. Reagents All reagents used were of analytical grade and were used without any further purification Sodium nitroprusside, British Drug House, England. Sodium borate, Riedel de Haen AG, Germany. Acetone, Scharlau Chemie S.A., Spain. Dimethylsulfoxide (DMSO); Loba Chemie, India. Instrument UV Spectrophotometer-1800, ENG240V, Shimadzu, Japan
©JIPBS, All rights reserved
Shaza W. Shantier et al., JIPBS, Vol 4 (3), 67-70, 2017
Preparation of stock solutions ACA standard solution 0.2 g of ACA standard was accurately weighed and dissolved in distilled water. The solution was then transferred into 10ml volumetric flask and the volume was completed to mark with distilled water (solution A; 20 mg/ml). ACA sample solution 0.8 ml of aminocarpoic acid injection was accurately pipetted and transferred into 10ml volumetric flask. The volume was then completed to mark with distilled water (solution B; 20 mg/ml). Reagent blank 0.5ml of 5%w/v SNP aqueous solution and 3ml of 4%w/v sodium borate were added to 2.5ml of distilled water in 10ml volumetric flask. The volume was then completed to mark using distilled water. Procedure Construction of calibration curve Serial volumes from solution A (0.1-0.5ml) were transferred into amber stoppered glass tubes. Distilled water was added to obtain 2.5ml solutions. 0.5ml of 5%w/v SNP and 3ml of 4%w/v sodium borate were added subsequently to each tube and the volumes were then completed to 10ml using distilled water. Solutions were allowed to stand in dark place for 45minutes. The absorbance values of the reaction product were recorded at 540nm against the reagent blank. Calibration curve was constructed by plotting the measured absorbance values against the corresponding concentration. Assay of ACA injection Serial dilutions of solution B were treated as under calibration curve. The injection content was determined using the slope ratio method. Alternatively, direct sample/standard comparison was done using 0.3ml of the sample solution treated as in the general procedure Stoichiometry of the reaction Serial volumes of 2.4 ×10⁻³ M ACA solution (0.1-0.9ml) were transferred into amber stoppard glass tubes. Distilled water was added to adjust volumes to 2.5ml. 0.25 ml of 2.6×10⁻³M of freshly prepared SNP, 0.25 ml of water and 3ml of 4%w/v sodium borate were added respectively to each tube. Solutions were placed in dark place for 45minutes. The absorbance values were then measured at 540nm against the blank. The molar ratio of the reaction was obtained from a plot of concentration ratio ([ACA]/ [SNP]) vs absorbance values.
Results and Discussion Colorimetry forms one of the methods that can serve multipurpose function. These include introducing a non UV absorbing drug into the visible region, increase sensitivity and selectivity to the assay of the drug. Certain colorimetric methods depend on functional group on drug structure that can be reacted with certain chromogen to form either UV absorbing or fluroscenct drug molecule. The most useful functional groups in this respect are the NH, OH or SH. ACA exhibits low UV absorption at about 220nm which can be attributed to the lone pair of amino and carbonyl groups where interference is usually expected in this area due to solvent, excipient and impurities. The developed method was based on the reaction of ACA depending on its amino group with SNP in alkaline medium to produce a colored reaction product measured at 540 nm. The absorption spectrum of the reaction product is given in Figure 2.
Figure 2. UV/VIS spectrum of the ACA-SNP complex.
Optimization of the reaction conditions The different experimental parameters affecting the color development were studied to determine the optimal conditions for the assay procedure. The reaction of ACA was found dependent on the concentration of SNP solution. One ml of 5% w/v aqueous solution was selected as the optimum reagent concentration. Higher concentrations caused a distinct decrease in the absorbance. The reaction did not proceed in different acidic media (possibly due to the protonation of the amino group), therefore alkaline condition was studied. Different inorganic bases were tested; sodium borate, borax and sodium carbonate. The best results, in terms of stability, were obtained when 4% w/v sodium borate was used. The reaction was also checked at different temperatures (10° C, 25 ° C and 100 ° C) at 15minutes interval. Best color development was obtained at room temperature and away from light. The effect of diluent solvents with different polarity [15], namely water and DMSO, was studied. The maximum absorption intensity was obtained when water was used as diluent. This gave an
68
Shaza W. Shantier et al., JIPBS, Vol 4 (3), 67-70, 2017
advantage of environment safety and low cost for the developed method. The sequence of addition of the reagents as described in the general procedure was found to be essential for best reproducibility .Under these conditions, the maximum color intensity was reached after standing 45minutes in dark place and was stable for at least two hours. Method validation Linearity and sensitivity Calibration curve for the analysis of ACA by its reaction with alkaline SNP was constructed by plotting the absorbance values as a function of the corresponding concentrations. The regression equation for the results was: A = −0.0324+ 0.0006C where A is the absorbance at 540 nm, C the concentration of ACA in mg/ml. The limit of detection (LOD) and limit of quantitation (LOQ) were determined using the formula [16]: LOD= 3.3 δ/ S and LOQ = 10δ/ S Where δ= standard deviation of the intercept of the regression line; S = the slope of the calibration line. The linearity data was calculated at 95% confidence limit and summarized in Table 1. Table 1. Linearity data for the developed method Parameter Developed method Slope ± tsb* 6.15×10⁻⁴ ± 5.1×10⁻⁵ Intercept ± tsa** 0.0324 ± 0.05 Correlation coefficient 0.9986 Range 0.2 ˗ 1.0 mg/ml LOD 0.07 mg/ml LOQ 0.26 mg/ml *Standard error of slope calculated at 95% confidence limit for n-2 degrees of freedom. ** Standard error of intercept calculated at 95% confidence limit for n-2 degrees of Freedom
Accuracy and precision The precision of the proposed method was determined by analyzing three replicates of ACA solution in three different days and within the same day. The precision of the developed method was reflected by the low RSD% values (less than 2%), Table 2. Table 2. Within-day and between-days results for the developed method Concentration Within-day Between-days mg/ml RSD%, n=3 RSD%, n=3 0.2 2.00 1.23 0.6 1.90 2.00 1.0 2.00 1.95
The accuracy and interference liabilities of the developed method were checked out by recovery testing. The percentage recovery value was 100.6 ± 2.05%, n=3, which indicates a suitable random error.
Application of the developed method The validated developed method was applied for the analysis of ACA in pharmaceutical formulations. The mean content percent of three independent analyses was 101.1 ± 1.4%; n=3. Reaction stoichiometry The plot of concentration ratio ([ACA]/ [SNP]) vs absorbance values showed a break point in a mole ratio of 2:1. Based on these results and according to literature [17], the product was suggested to be formed directly from an amine-nitroprusside complex. The first step involves the addition of the amine to the coordinated nitric oxide. The resulting complex reacts with another molecule of amine, with the displacement of the N-nitrosamine Scheme 1.
Scheme 1. Proposed pathway for ACA-SNP reaction
Conclusion The results demonstrated the successful use of SNP in the development of a selective spectrophotometric method for determination of ACA. The proposed method is characterized by its simplicity and reliability of the results. Furthermore, the SNP as an analytical reagent is inexpensive, has excellent shelf life, and is available in any analytical laboratory. The proposed method can be applied in quality control laboratories for the routine analysis of ACA in raw material and pharmaceutical formulations. References 1. 2. 3. 4.
Playfair, in: M.R.F. Ashworth (Ed.), The Determination of Sulphur containing Groups, Academic Press, London, 1976: 205–211. Leeuwenkamp OR, Van Benneekom WP, Bult A, in: K. Florey (Ed.), Analytical Profile of Drug Substances, Academic Press, New York, 1986; 15: 782–789. Rucki R, in: K. Florey (Ed.), Analytical Profile of Drug Substances, Academic Press, New York, 1977, 6: 488–513. Hassan FA, Ibrahim HR, Ibrahim AD, Mostafa AM: Selective spectrophotometric method for determination of rosoxacin antibiotic using sodium nitroprusside as a chromogenic reagent. Spectrochimica Acta Part A 2008; 69: 1287–1291.
69
Shaza W. Shantier et al., JIPBS, Vol 4 (3), 67-70, 2017 5.
Rodenas-Torralba E, Morales-Rubino A, Guradia MDL: Determination of phenols in water using micropumped multicommutation and spectrophortometric detection Anal. Bioanal. Chem. 2005; 383: 138–144. 6. Abdel-Khalek MM, Mahrous MS, Daabees HG: Spectrophotometric determination of mequitazine. Alex. J. Pharm.1993; 7: 201–202. 7. Kelani KM, Aziz AM, Hegazy MA, Abdel-Fattah L: Assay of famotidine in API forms. Spectrosc. Lett. 2002; 35: 543–563. 8. Greilich PE, Jessen ME, Satyanarayana N, Whitten CW, Nuttall GA, Beckham JM, Wall MH and Butterworth JF: The effect of epsilonaminocaproic acid and aprotinin on fibrinolysis and blood loss in patients undergoing primary, isolated coronary artery bypass surgery. Anesth Analg. 2009; 109(1):15-24; 9. Liu-DeRyke X and Rhoney D. Hemostatic therapy for the treatment of intracranial hemorrhage. Pharmacotherapy, J Human Pharmacol Drug Therapy 2008; 28(4): 485-495. 10. Gunawan B and Runyon B: The efficacy and safety of epsilonaminocaproic acid in patients with cirrhosis and hyberfibrinolysis. Aliment Pharmacol Thera. 2006; 23(1): 115-120. 11. Mohamed AA, Shantier SW, Alfangari SA and Elrasheed AG: Development of Spectrophotometric Method for the Assay of
12. 13. 14. 15. 16. 17.
Aminocaproic Acid in Dosage Forms Using Ascorbic Acid. Chemical Science Transactions 2015; 4(2): 478-482 Shantier SW, Elrasheed AG and Rashida M: Development of Colorimetric Method for the Analysis of Aminocaproic Acid Using DCQ. World Journal of Pharmaceutical Research 2015; 4 (4): 234-240. Stanley L: High performance liquid chromatographic assay of amicar in plasma and urine afterpre-column derivatization with o-phthalaldehyde for fluorescence detection. Biomed Chroma. 1990; 4:175-177 Phillips D, Tebbett I and Kalita S: Solid phase extraction and analysis of aminocaproic acid of horse urine. Chromatographia 1990; 30(5-6), 309310. B.S. Furniss, A.J. Hannaford, P.W.G. Smith, A.R. Tatchell, Vogel’s Textbook of Practical Organic Chemistry, fifth ed., Longman Group UK Ltd., England, 1989:1442–1444. Mohamed ME, Shantier SW, Elrasheed AG, Magdi AM: Development of Spectrophotometric Methods for the Analysis of Florfenicol in Bulk and Dosage Forms. Int J Pharm Pharm Sci 2016; 8(4): 347-349. Maltz H, Marilyn AG and Mary CN: Reaction of nitroprusside with amines. J. Org. Chem. 1971; 36(2): 363-364.
70