Sep 10, 2011 - Two simple, rapid, sensitive, precise and economic spectrophotometric methods have been developed for the estimation of Erlotinib in bulk and ...
Journal of Applied Pharmaceutical Science 01 (07); 2011: 176-179
ISSN: 2231-3354 Received on: 03-09-2011 Revised on: 10-09-2011 Accepted on: 17-09-2011
Extractive colorimetric method development and validation for erlotinib in bulk and tablet dosage form G. Usha Rani, B. Chandrasekhar, N. Devanna
ABSTRACT
G. Usha Rani Department of Pharmaceutical Chemistry, CMR College of Pharmacy, Medchal, Hyderabad, A.P. India
B. Chandrasekhar Department of Pharmacy, MLR College of Pharmacy, Hyderabad, A.P. India
N. Devanna Department of Analytical Chemistry, JNTU-A, Anantapur, A.P. India
Two simple, rapid, sensitive, precise and economic spectrophotometric methods have been developed for the estimation of Erlotinib in bulk and tablet formulation. During the course of study, it was observed that solution of the drug formed colored ion-pair complexes with Bromocresol Green (BCG) and Methyl Orange (MO) in phosphate buffer pH 2.5, and extracted in chloroform. This property of the drug was followed for the development of colorimetric methods for analysis of drug. The complex of etoricoxib with BCG and MO showed λ max at 418.5 nm and 424.4 nm respectively. The complex was stable up to 22 hrs and obeyed Beer's law over the concentration ranges of 10-1000 µg/ml. Correlation coefficient was found to be 0.9985. In addition we have determined the molar absorptivity, Sandell sensitivity and the optimum conditions for quantitative analysis of erlotinib. These methods were validated statistically. Recovery studies gave satisfactory results indicating that none of common additives and excipients interfere the assay method. The proposed methods are found to be simple, accurate and reproducible that was successfully applied for the analysis of tablet formulation.
Key words: Spectrophotometry, erlotinib, Bromocresol green, Methyl orange, Phosphate buffer, Ion-pair complex
INTRODUCTION
For Correspondence: G. Usha Rani Department of Pharmaceutical Chemistry,CMR College of Pharmacy, Medchal, Hyderabad, A.P. India Phone No: +91-9966858687
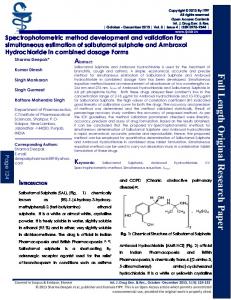
Lung cancer is the leading cause of cancer-related mortality, worldwide, for both men and women. Tyrosine kinase receptors are over-expressed or deregulated in various types of solid tumours, including non-small cell lung cancer (NSCLC) (Baselga et al., 2002). Erlotinib received approval from the US Food and Drug Administration in November 2004 for the treatment of NSCLC after the failure of more than one or two courses of previous chemotherapy (Zielinski, 2004; Shepherd, et. al., 2005). Erlotinib is a small molecule with the chemical name N-(3ethynylphenyl)-6,7- bis(2-methoxyethoxy)-4-quinazolinamine that reversibly and selectively inhibits the intracellular autophosphorylation of tyrosine kinase in association with epidermal growth factor receptor (EGFR) (Fig. 1). Erlotinib is available as an oral agent that blocks transduction of propagation signals mediated by the EGFRs in a concentration-dependent manner (Hidalgo et. al., 2001). Erlotinib has demonstrated inter-patient variability in food and drug pharmacokinetic clinical studies (Hidalgo et. al., 2003; Birner, 2003) it also has the potential to cause drug-drug interactions when given in conjunction with agents that are classified as CYP3A4 inducers. Based on the above data, the need to develop an analytical method to determine erlotinib concentrations in patients is expedient before attempting to draw any correlation between drug dose and biological effects. Our aim was the development and validation of a simple colourimetric
Journal of Applied Pharmaceutical Science 01 (07); 2011: 176-179
400-800 nm and the λmax was found to be 424.4 nm. Then calibration curve was plotted. The sample solutions prepared were also treated in similar manner and the exact amount of erlotinib present was deduced from the calibration graph. Fig 1: Molecular Structure of erlotinib.
method for the determination of erlotinib, which can be implemented easily for routine use in quality control laboratories. MATERIALS AND METHODS Apparatus and Instruments: Double beam UV-visible spectrophotometer (Shimadzu, model 160-A) having two matched quartz cells with 1cm light path. Shimadzu-Libror AEG-220 balance, Digital pH meter (Systronic 335), Reagents All chemicals used were of analytical reagent grade and double distilled water was used throughout. BCG and MO reagent supplied by BDH chemicals, India. Aqueous solution of BCG (0.5% w/v), and MO (0.05%) and buffer solutions pH 2.5 were prepared. Etoricoxib as generously supplied by M/s Systopic Laboratories Pvt. Ltd., New Delhi, India was used as such without further purification. The commercially available tablets of etoricoxib were procured from local market labeled to contain 60 mg etoricoxib/tablet. Preparation of standard stock solution Standard stock solution of Erlotinib was prepared by dissolving 100 mg in 100 ml of water to get concentration of 1 mg/ml. From this a working standard of 800 µg/ml. Preparation of phosphate buffer pH 2.5 Dissolve 100 gm of potassium dihydrogen phosphate in 800ml of water adjust the pH to 2.5 with Hydrochloric acid and add sufficient water to produce 1000ml. Preparation of 0.05% methyl orange dye solution for 25 ml: Weigh 0.125 gm of dye sample and dissolve in 10ml of water and make up to 25ml.
Method B Working standard of drug solution of Erlotinib 800µg/ml (0.5 ml), Dye solution of Bromo Cresol Green 0.5% (1ml), Phosphate buffer pH 2.5 (2ml) transferred into separating funnel, chloroform (10 mL) was added to the separating funnel and contents were shaken for 2 minutes. The two phases were allowed to separate and the absorbance of the chloroform layer was scanned in the range of 400-800 nm and the λmax was found to be 418.5 nm. Then calibration curve was plotted. The sample solutions prepared were also treated in similar manner and the exact amount of erlotinib present was deduced from the calibration graph. Optimization of conditions Condition under which reaction of etoricoxib with dyes fulfils the essential requirements was investigated. All conditions studied were optimized at room temperature (32°±2°C). RESULTS AND DISCUSSION The optical characteristics such as Beer's law limits, sandell's sensitivity, molar absorptivity, per cent relative standard deviation were calculated and the results are summarized in Table1. Regression characteristics like slope, intercept, correlation coefficient and LOD, LOQ values were calculated and shown in Table-1. The optimum conditions for colour development for method A and B, have been established by varying the parameters one at a time and keeping the other parameters fixed and observing the effects of product on the absorbance of the coloured species and incorporated in the procedures. Spectral characteristics Absorption spectra of the pale yellow color ion-pair complex of MO and deep yellow colour ion-pair complex of BCG is shown in Fig. 2, with a maximum absorbance (λ) at 424.4 and 418.5 respectively. The colored complex was stable for at least 24 h at room temperature (25 ºC) determined by proposed method.
Preparation of 0.5% Bromo Cresol Green dye solution for 25ml Weigh 0.25 gm of dye sample and dissolve in 10ml of water and make up to 25ml and filter it using filter paper. PROCEDURE Method A Working standard of drug solution of Erlotinib 50µg/ml (1 ml), Dye solution of Methyl Orange 0.05% (1ml), Phosphate buffer pH 2.5 (2ml) transferred into separating funnel, chloroform (10 mL) was added to the separating funnel and contents were shaken for 2 minutes. The two phases were allowed to separate and the absorbance of the chloroform layer was scaned in the range of
Fig 2: Absorption spectrum of Erlonitib with methyl orange and Bromo cresol green.
Journal of Applied Pharmaceutical Science 01 (07); 2011: 176-179
Table 1: Optical Characteristics and Precision Data. Parameters
Fig 3: Calibration curve of Erlotinib with methyl orange.
Methyl Orange
λmax nm Beers Law limit Molar Absorbtivity (micrograms/cm2/0.001 Absorbance unit) Sandell’s sensitivity (micrograms/cm2/0.001 Absorbance unit) Regression equation y Slope (m) Intercept© Precision( % relative standard deviation)
Bromo Cresol Green
424.4 100-1000 mcg/ml
418.5 100-1000 mcg/ml
9.5 x10³
9.4x 10³
0.266
0.266
0.00127
0.00123
0.01
0.042
Table 2: Recovery studies of erlotinib commercially available brands. Table Brand
Labeled Amount (Mg)
Amount obtained(mg)* By proposed method Method A Method B
Tarceva
25 23.6 25 23.09 * Average of six determinations
24.2 24.65
%Recovery By the Proposed Method * Method A Method B 94.4 95.6
96.8 98.6
Table 3: Absorbance of Erlotib with Methyl Orange. S. No. 1 2 3 4 5 6
Fig 4: Calibration curve of Erlotinib using Bromocresol Green.
The molar absorptivity and sandell’s sensitivity showed that the methods were sensitive. The optimum conditions for colour development had been established by varying the different parameters involved. The result of analysis of commercial formulation significantly showed low values for standard deviation, standard error of mean, coefficient of variance and percentage range of error (within 95% confidence limits), thus showed precision of the methods results shown in table 2. For testing the accuracy and reproducibility of the proposed methods, recovery studies were performed. The data obtained by recovery studies indicate non-interference from the excipients used in the formulation. The percentage recoveries were close to 100%. This study revealed that the common excipients and other additives such as lactose, starch, gelatine, talc and magnesium stearate that are usually present in the tablet dosage forms do not interfere in the analysis. Thus, it can be concluded that the proposed methods are found to be simple, rapid, sensitive and accurate that can be used for the determination of erlotinib in their pharmaceutical dosage forms in a routine manner. Linearity The linearity was determined for erlotinib. Solutions of the drug at six different concentrations with both the dyes were analyzed and calibration curves were constructed by concentration against the respective absorbance. The method was evaluated by determination of the correlation coefficient and intercept values. The results of linearity for Erlotinib with MO and Erlotinib with BCG are given in Table 3 and 4 respectively. From the calibration plots it was clear that the linear range for erlotinib with MO and BCG was found to be in between 10-1000 µg/ml, with the correlation coefficient 0.99
Concentration(µg) 100 200 400 600 800 1000
Absorbance 0.1276 0.2013 0.4476 .0.7102 0.9553 1.1901
Table 4: Absorbance of Erlotib in with Bromo Cresol Green S. No
Concentration(µg)
absorbance
1 2 3 4 5 6
100 200 400 600 800 1000
0.115 0.181 0.435 0.602 0.762 1.078
CONCLUSION Two simple Spectrophotometric Methods for the determination of ERLOTINIB in pure as well as in its dosage form were developed with Methyl Orange and Bromo Cresol Green the absorbance of chromogen was to be maximum at 424.4 nm and 418.5 nm against the corresponding reagent blank. The method is found to be simple, precise, economic and less time consuming. The method has been statistically evaluated and results obtained are accurate, precise and insensitive and free from the interferences of other additives present in the formulation. REFERENCES Baselga J, Hammond LA. HER-targeted tyrosine-kinase inhibitors. Oncology 2002;63 Suppl 1:6-16. Birner A. Pharmacology of oral chemotherapy agents. Clin J Oncol Nurs 2003;7:11-9. Hidalgo M, Bloedow D. Pharmacokinetics and pharmacodynamics: maximizing the clinical potential of erlotinib (Tarceva). Semin Oncol 2003;303 Suppl 7:25-33. Hidalgo M, Siu LL, Nemunaitis J et al. Phase I and pharmacologic study of OSI-774, an epidermal growth factor receptor
Journal of Applied Pharmaceutical Science 01 (07); 2011: 176-179
tyrosine kinase inhibitor, in patients with advanced solid malignancies. J Clin Oncol. 2001;19:3267-79. Shepherd FA, Rodrigues Pereira J, Ciuleanu T et al. for the National Cancer Institute of Canada Clinical Trials Group. Erlotinib in .
previously treated non-small-cell lung cancer. N Engl J Med. 2005;353:123- 32. Zielinski SL. Tarceva wins approval from FDA. J Natl Cancer Inst 2004;96:1811.