Asian Journal of Chemistry and Pharmaceutical Sciences, Vol 1(1), 2016, 36-40
Development and Validation of UV Spectrophotometric Method for Quantitative Estimation of Clobetasol 17-Propionate Neelam Devi1, Sunil Kumar1, Sunny Rajain1, Jagbir Gagoria2, Sheefali Mahant2 and Rekha Rao3* Department of Pharmaceutical Sciences, Guru Jambheshwar University of Science and Technology, Hisar - 125001, Haryana, India 2 Department of Pharmaceutical Sciences, Maharishi Dayanand University, Rohtak - 124001, Haryana, India 3 Assistant Professor, Department of Pharmaceutical Sciences, Guru Jambheshwar University of Science and Technology, Hisar - 125001, Haryana, India;
[email protected] 1
Abstract Clobetasol 17-propionate is used most potent topical glucocorticoid clinical effective in treatment of topical dermatitis, vitiligo and psoriasis. A rapid, simple, selective and precise UV- Visible Spectrophotometric method has been developed for the determination of Clobetasol 17-Propionate (CP) in bulk forms and dosage formulations. The spectrophotometric detection was carried out at an absorption maximum of 239 nm using ethanol as solvent. The method was validated for specificity, linearity, accuracy, precision, and robustness. The detector response for the CP was linear over the selected concentration range 2 to 40 μg/ml with a correlation coefficient of 0.9999. The accuracy was between 99.1 and 101.4 %. The precision of 4 µg/ml sample preparation three times in a day (intraday) was 0.1325%. The Limit of Detection (LOD) and Limit of Quantification (LOQ) are 0.84 and 2.55 μg/ml, respectively. The recovery of CP was about 101.84%. The results demonstrated that the excipients in the commercial formulation did not interfere with the method and can be conveniently employed for daily routine quality control analysis of CP in bulk drug, marketed formulations.
Keywords: Clobetasol 17-Propionate, ICH Guidelines, UV-Visible Spectroscopy, Validation
1. Introduction
High potency dihalogenated corticosteroid, Clobetasol 17-Propionate (CP) is used for skin diseases such as vitiligo, psoriasis and atopic dermatitis due to its antiinflammatory, vasoconstrictive, antiproliferative and immunosuppressive activities. It has been approved for the topical use in dosage forms like such as gel, cream, ointment, solution and foam1–2. Clobetasol 17-Propionate is used to relieve redness, itching, sweeling, or other discomfort caused by skin conditions. The treatment of more severe skin disorders using CP with or without the inclusion of other drug substances were compared in several clinical studies. CP has demonstrated excellent recovery, rapid relief and reduced relapses of different skin conditions and symptoms3–5. It was also proven to be the * Author for correspondence
first topical corticosteroid that demonstrated satisfactory results in the treatment for psoriasis2,4. Literature search reveals HPLC, RP-HPLC and liquid chromatography methods were reported for determination of various salts of Clobetasol in formulations like ointment, creams and suspensions6–11. Beside these, some simultaneous analytical estimations of Clobetasol 17-Propionate with other drugs have been reported in literature12–16. Till date, no studies have been reported for estimation of CP in bulk and ointment formulation using a validated UV-visible spectrophotometric assay method. Therefore, the aim of the present work is to develop and validate analytical method by UV-Visible spectrophotometer which is simple, rapid and advantageous and in which no complexation agent, extraction, derivatization, or evaporation steps are involved.
Neelam Devi, Sunil Kumar, Sunny Rajain, Jagbir Gagoria, Sheefali Mahant and Rekha Rao
Cl
O HO
O H F
H
O
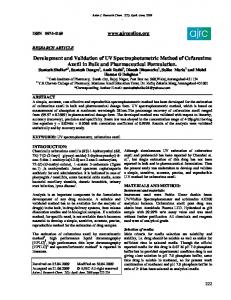
Figure 1. Structure of Clobetasol 17-Propionate.
2. Materials and Method 2.1 Materials
Clobetasol 17-Propionate (CP) was obtained from Sigma Aldrich, USA. Ethanol was procured from S D FineChem Ltd, Mumbai, India. Formulation (ointment) collected from market with drug equivalent to 0.05% w/w of CP. All the other reagents and chemicals used were of analytical grade.
2.2 Method Development 2.2.1 Instrument Double beam UV Visible Spectrophotometer (Variance Carry 5000, India)
2.2.2 Preparation of Standard Stock Solution Accurately weighed 10 mg of standard CP was dissolved in 100 ml of ethanol (standard stock solution). From this standard stock solution, prepare the aliquots of different concentration by suitable dilutions varying in between 2 and 40 µg/ml using ethanol. These diluted solutions were checked for Linearity, Precision, Accuracy, Robustness, Limit of Quantification (LOQ) and Limit of Detection (LOD).
2.2.3 Method Optimization 2.2.3.1 Selection and Optimization of Solvent As reported in literature, the solvent have a profound influence on the shape and quality of the peak17. The choices of solvents for ultra violet method development are: ethanol, methanol, acetone, etc. Various solvents were checked and ethanol was found to fulfill all the conditions relating to quality and non-interference of peak at the specified wavelength.
Vol 1 (1) | 2016 | ww.informaticsjournals.com/index.php/ajcps
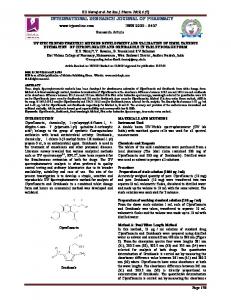
2.2.3.2 Selection of Wavelength In order to determine the wavelength of absorption maxima (ʎmax) of CP, aliquot of 100 µg/ml solution was prepared by taking weighed amount of drug (10 mg) in 100 ml of ethanol and scanned by UV-Visible spectrophotometer in the wavelength range of 400-200 nm against ethanol as a blank. The resulting spectrum was shown in Figure 2 and absorption curve showed characteristic maximum absorption at 239 nm for Clobetasol 17-propionate. The wavelength at which maximum absorption observed is 239 nm, which is selected for further analysis.
Figure 2. UV spectrum of clobetasol 17-propionate in ethanol (ʎmax at 239nm).
2.3 Method Validation
Method validation was performed as per the International Conference on Harmonization (ICH) guidelines Q2 (R1) (ICH, 2005)18,19 and all the parameters were evaluated.
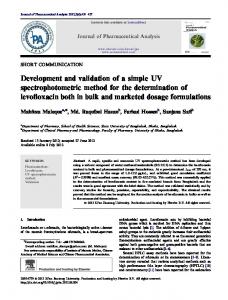
2.3.1 Linearity The linearity of this method was checked at concentrations ranging between 2-40 µg/ml. The curve of absorbance v/s concentration (Figure 3) of CP was found to be linear as given in Table 1. The investigated concentrations followed Beer’s Lambert law20. Table 1. Absorbance for standard curve of clobetasol propionate (CP) at 239 nm Concentration (µg/ml) 2 4 6 8 10 20 40
Absorbance at 239 nm 0.0765 0.1558 0.2327 0.3004 0.3749 0.7273 1.4255
Asian Journal of Chemistry and Pharmaceutical Sciences
37
Development and Validation of UV Spectrophotometric Method for Quantitative Estimation of Clobetasol 17-Propionate
2.3.3 Accuracy Accuracy is defined as closeness between the actual (true) value and value obtained by repeating test method for a number of times. Accuracy may be expressed as % Recovery by the assay of known analyte which is added. It gives exact measure of the analytical method. The preanalyzed samples were spiked with extra 50, 100 and 150% of the standard CP (10 µg/ml) and the mixtures were analyzed using UV visible spectrophotometer. The experiment was performed in triplicate22. Figure 3. Standard curve of clobetsaol 17-propionate in ethanol.
2.3.2 Precision The precision of the UV method was performed by intermediate precision (inter-day) and repeatability (intra-day).
2.3.2.1 Repeatability Repeatability (intra-day) was carried out by analyzing CP having concentration 4 μg/ml, three times a day. To assess the intra-day variation, the % RSD was calculated from absorbance as obtained.
2.3.2.2 Intermediate Precision Intermediate precision (inter-day) was assessed by analyzing 4 µg/ml concentration of CP for three different days. The % RSD was calculated for absorbance thus obtained, to measure the interday variation21. Table 2. Repeatability and intermediate precision Concentration (µg/ml) 4µg/ml 4µg/ml 4µg/ml Mean
Repeatability (n=3) Absorbance at 239 nm 0.1154 0.1152 0.1151 0.1152
Intermediate precision (n = 3) Absorbance at 239 nm 0.1153 0.1153 0.1150 0.1152
2.3.4 LOD and LOQ The Detection Limit (DL) is the lowest concentration of analyte present in a sample, which can be analyzed but not necessarily quantitated. The Quantitation Limit (QL) is the lowest concentration of analyte present in a sample, which can be quantitatively analyzed with acceptable precision and accuracy. The limit of detection and limit of quantification were assessed based on the technique of signal-to-noise ratio10 using the Equations (1) and (2). QL = 10 σ/ S (1) DL = 3.3 σ / S (2) Where, σ is the standard deviation of the intercept of the calibration plot and S is the slope of the calibration curve23.
3. Result and Discussion The CP was found to be soluble in ethanol. The ʎmax of drug was found to be 239 nm as shown in (Figure 1). From the result obtained from Table 1, it was observed that CP obeys linearity within the concentration range of 2 µg/ml-40 µg/ml and coefficient correlation was 0.9999. The regression value from the curve was y = 0.0353x + 0.0162 as shown in Figure 2. The detection and quantitation limits were calculated as LOD (k = 3.3) and LOQ (k = 10) and these were found to be 0.84 µg/ml and
Table 3. Recovery data for the accuracy analysis of the UV method Excess of CP added (%)
50 100 150
38
Concentration of sample (µg/ml)
10 10 10
Theoretical concentration Concentration of spiked of spiked sample (μg/ml) sample ± SD (μg/ml) (n=3)
15 20 25
Vol 1 (1) | 2016 | www.informaticsjournals.com/index.php/ajcps
14.99±0.010 19.95±0.010 25.46±0.025
Recovery± SD (%)
99.93±0.065 99.75±0.050 101.84±0.59
%RSD
0.067 0.050 0.098
Asian Journal of Chemistry and Pharmaceutical Sciences
Neelam Devi, Sunil Kumar, Sunny Rajain, Jagbir Gagoria, Sheefali Mahant and Rekha Rao
Table 4. Validation Parameters Validation parameters ʎmax (nm) Range (µg ml-1) Correlation coefficient Intercept Slope Accuracy Precision (%RSD) LOD (µg ml-1) LOQ (µg ml-1) Precision (%RSD)
Data (Mean±SD) 239 nm 2-40 µg/ml 0.9997±0.00015 0.0162±0.00882 0.03533±0.0016 99.93-101.84% 0.1325 0.84 2.55 Concentration (µg/ml) 4µg/ml
Intra-day (% RSD) 0.1325
Inter-day (%RSD) 0.1503
Table 5. Recovery studies of marketed ointment formulation Conc. Sam- Drug Formulation level ple no. 50% 1 10 ml of 20 µg/ml 2 3 100% 1 10 ml of 10 ml of 30 10g/ml µg/ml 2 3 150% 1 10 ml of 40 µg/ml 2 3
Amount added (μg/ml) 15 µg/ml
20 µg/ml
25 µg/ml
2.55 µg/ml respectively. The precision (measurements of intra-day and inter-day) results demonstrated (Table 2.) significant reproducibility with % RSD below 2.0 observed. This showed that method is highly precise. The percent recovery value (Table 3.), was observed higher than 100%, indicating the accuracy of the method. The estimation of CP in marketed ointment formulation was found to be 98-99%.
5. Conclusion The proposed method was observed as a simple, accurate, precise, sensitive, economical, reproducible and rapid for the routinely estimation of CP. The developed method is specific for estimation commercial formulations like ointments without interference of excipients.
6. Conflicts of Interest All authors have none to declare.
Vol 1 (1) | 2016 | ww.informaticsjournals.com/index.php/ajcps
Abs. 0.5698 0.5676 0.5703 0.7204 0.7302 0.7204 0.9323 0.9335 0.9333
Amount recovered 14.80 14.74 14.81 19.81 19.80 19.81 24.53 24.55 24.55
% recovery 98.67 98.27 98.75 99.05 99.02 99.05 98.10 98.23 98.21
Mean % recov- % RSD ered ± SD (N=3) 98.56±0.25 0.25
99.04±0.01
0.01
98.18±0.07
0.07
7. References 1. Franz TJ, Lehman PA, Feldman SR, Spellman MC. Bioavailability of clobetasol propionate in different vehicles. Skin Pharmacol Appl Skin Physiol. 2003; 16:212–6. 2. Wendt H, Frosch PJ. Clinico-pharmacological models for the assay of topical corticoids. Switzerland: Karger AG; 1982. 3. Sparkes CG, Wilson L. The clinical evaluation of a new topical corticosteroid, clobetasol propionate. Brit J Dermatol. 1974; 90:197–203. 4. Floden CH, Woodbridge P, Samman P, Kurwa AR. Comparison of the response of psoriasis, over a 6-month period, to clobetasol propionate and fluocinolone acetonide ointments. Curr Med Res Opin. 1975; 3:375–81. 5. Christophers E, Schopf E, Kligman AM, Stoughton, RB. Topical corticosteroid therapy: A novel approach to safer drugs. New York: Raven Press Ltd; 1988. 6. Fontana MC, Bastos MO, Beck RCR. Development and validation of a fast RP-HPLC method for the determination of clobetasol propionate in topical nanocapsule suspensions. J Chromatogr Sci. 2010; 48:637–40. 7. Modi P, Vairale A. Cleaning Method: A validated HPLC method for determination of clobetasol propionate resi-
Asian Journal of Chemistry and Pharmaceutical Sciences
39
Development and Validation of UV Spectrophotometric Method for Quantitative Estimation of Clobetasol 17-Propionate
dues on the surface of manufacturing equipment. International Journal of Analytical and Bioanalytical Chemistry. 2012; 2:133–8. 8. Patel AG, Patel RB, Patel MR. Liquid chromatographic determination of clobetasol-17-butyrate in ointment. J Assoc off Anal Chem. 1990; 73:893–5. 9. Sparidans RW, Velsen GA, de Roos MP, Schellens JHM, Carla AFM, Koomen B, Beijnen JH. Liquid chromatography- tendem mass spectrometric assay for clobetasol propionate in human serum from patients with acute dermitis. J Chromatogr B. 2010; 878:2150–4. 10. Musmade PB, Deshpande PB, Dengle SJ, Talole KB, Pathak SM, Adiga MNS, Bhat K, Udupa N, Bairy KL. High performance liquid chromatographic method for determination of clobetasol in rat plasma and its application to skin penetration. J Bioanal Biomed. 2010; 2:1–7. 11. Fauzee AFB, Walker RB. Forced degradation studies of clobetasol 17-propionate in methanol, propylene glycol, as bulk drug and cream formulations by RP-HPLC. J Sep Sci. 2013; 36:849–56. 12. Jakasaniya MA, Shah JS, Maheswari DG. Simultaneous estimation of clobetasol propionate and fusidic acid in cream dosage form by reversed phase high performance liquid chromatographic method. Pharmacophore. 2014; 5:231–8. 13. Malani PS, Raj HA, Jain VC. Development and validation of analytical method for simultaneous estimation of miconazole nitrate and clobetasol propionate in cream by HPTLC method. Pharma Science Monitor. 2014; 5:386–99. 14. Badilli U, Amasya G, zkan SO, Tarimci N. Simultaneous determination of clobetasol propionate and calcipotriol in a novel fixed dose emulgel formulation by LC-UV. Chromatograhia. 2013; 76:133–40.
40
Vol 1 (1) | 2016 | www.informaticsjournals.com/index.php/ajcps
15. Marika K, Katherine F, Jianmin L, Mike CG, Debra F. A sensitive high-throughput hplc assay for simultaneous determination of everolimus and clobetasol propionate. J Chromatogr Sci. 2008; 46:23–9. 16. Turabi ZM, Khatatbeh OA. Simultaneous determination of clobetasol propionate and chlorocresol in cream by stability indicating RP-HPLC method. Int J Pharm Sci Drug Res. 2014; 6:140–4. 17. Ahuja S, Scypinsk S. Handbook of modern pharmaceutical analysis. London: Academic Press; 2001. 18. ICH Guideline Q2 (R1). Validation of analytical procedures: Text and methodology. 2005 Nov. 19. Validation of analytical procedure: Text and methodology. Proceeding of International Conference on Harmonization (ICH); Geneva. 2005. 20. Behera S, Ghanty S, Ahmad F, Santra S, Banerjee, S. UV-visible spectrophotometric method development and validation of assay of paracetamol tablet formulation. J Anal Bioanal Techniques. 2012; 3(6). 21. Debnath SK, Saisivam S, Dash DK, Debnath M. Development and validation of UV-spectrophotometric methods for quantitative estimation of prothionamide in pure and pharmaceutical dosage forms. Int Curr Pharm J. 2015; 4:402–4. 22. Kadam PV, Bhingare CL, Nikam RY, Pawar, SA. Development and validation of UV spectrophotometric method for the estimation of curcumin in cream formulation. Pharmaceutical Methods. 2013; 4:43–5. 23. Kashyap R, Subrahmanyam EVS, Sharbaraya AR. Development and validation of UV spectroscopy method for the estimation of prednisolone in bulk and dosage form. J Chem Pharm Res. 2012; 4:1090–6.
Asian Journal of Chemistry and Pharmaceutical Sciences