Nov 1, 2015 - The linear range, correlation coefficient, detection limit and standard deviation for MOX and. BROM by Spectrophotometry method are shown in.
J Pharm Sci Bioscientific Res. 2015 5(6):572-578
ISSN NO. 2271-3681
Development and Validation of UV Spectroscopic Method for Simultaneous Estimation of Moxifloxacin Hydrochoride and Bromfenac Sodium in Combined Dosage Form 1
2
Shuchi Desai , Hitesh Dalwadi , Kesha Desai
3
1. Reseach scholar, Institute of Pharmacy, JJT University, Jhunjhunu, Rajasthan, India 2. Associate Professor, ROFEL Shri G.M Bilakhia College of Pharmacy, Vapi, Gujarat, India 3. Research scholar, Uka Tarsadia University, Bardoli, Gujarat, India
ABSTRACT: A newer, simple, accurate and sensitive Absorbance ratio method is developed for the simulataneous estimstion of Moxofloxacin Hydrochloride (MOX) and Bromfenac sodium (BROM) in combined dosage form. In Absorbance ratio method MOX and BROM both obeyed Beer’s law in the concentration range of 1 - 16 µg/ml. Absorbance ratio method was developed using two wavelenghts which are 275 nm (isobestic point) and 291 nm (λmax of MOX). Methanol:water (10:90 v/v) was used as a solvent. The results of the analysis were analyzed and validated statistically and recovery studies were carried out as per ICH guidelines. It can be used for routine analysis of both drugs in bulk as well as in pharmaceutical formulations. KEY WORDS: Moxifloxacin Hydrochloride (MOX), Bromfenac Sodium (BROM), Absorbance Ratio Method Article history: Received 29 Jun 15 Revised 11 July 2015 Accepted 11 Jun 15 Available online 01 Nov 2015 Citation: Desai S., Dalwadi H., Desai K. Development and Validation of UV Spectroscopic Method for Simultaneous Estimation of Moxifloxacin Hydrochoride and Bromfenac Sodium in Combined Dosage Form. J Pharm Sci Bioscientific Res. 2015 5(6):410
*For Correspondence: Miss Shuchi Desai Reseach scholar, Institute of Pharmacy, JJT University,
INTRODUCTION: Moxifloxacin is a 4th generation synthetic fluoroquinolone antibacterial Agent. It is chemically 1-cyclopropyl-7-[(1S,6S)-2,8-diazabicyclo[4.3.0]non-8yl]-6-fluoro-8-methoxy-4-oxo-quinoline-3-carboxylic acid. Bromfenac Sodium is Non steroidal anti-inflammatory agent. Chemically it is Sodium [2-amino-3(4-bromobenzoyl) phenyl].Clinically a combination is being used in the treatment of post operative inflammation and pain. The combination of Moxifloxacin and Bromfenac is not official in any official pharmacopoeia. A [1-3] literature survey revealed that only a few methods based on HPLC , [4-11] [12] Spectrometry and HPTLC were reported for the determination of Moxifloxacin and HPLC was reported for the determination of Bromfenac but no single method is reported for the simultaneous estimation of Moxifloxacin and Bromfenac in pharmaceutical dosage form. Hence in the present study a physical mixture of Moxifloxacin and Bromfenac was being taken for simultaneous estimation by UV method. This present investigation describes a rapid, accurate and precise UV method of Moxifloxacin and Bromfenac in combination using Methanol:water (10:90% v/v) as a solvent. In which two wavelengths are used 275 nm (isobestic point) and 291 nm (λmax of MOX).
Jhunjhunu, Rajasthan, India
(www.jpsbr.org)
Desai S. et al
572
J Pharm Sci Bioscientific Res. 2015 5(6):572-578
Figure:1: Structure of Moxifloxacin Hydrochloride
ISSN NO. 2271-3681
100 mg of BROM standard was weighed and transferred to a 100 ml volumetric flask. The drug was dissolved by adding 10 ml of methanol and volume was made up to the mark with water to give a solution containing 1000 µg/ml BROM. From this solution 5 ml was transfer to 100 ml volumetric flask. The volume was adjusted to the mark with the methanol:water (10:90) to give a solution containing 50 µg/ml BROM. Selection of Analytical Wavelength
Figure:2: Structure of Bromfenac Sodium MATERIALS AND METHODS: Apparatus: Instrument used was an UV‐Visible double beam spectrophotometer, SHIMADZU (model UV‐1800, software – UV probe, version 2.42) with a pair of 1 cm matched quartz cells. All weighing was done on Mettler Toledo electronic analytical balance. Reagents and Chemicals: Moxifloxacin Hydrochloride was gifted by Vital Healthcare, Vapi and Bromfenac sodium was gifted by Enaltec Labs, Mumbai. Methanol and water were used as solvents and calibrated glasswares were used throughout the work. Marketed Formulation: Combined eyedrop formulation was purchased from Preparation of Standard solution: Moxifloxacin (MOX) standard stock solution: (1000 µg/ml) 100 mg of MOX standard was weighed and transferred to a 100 ml volumetric flask. The drug was dissolved by adding 10 ml of methanol and volume was made up to the mark with water to give a solution containing 1000 µg/ml MOX. From this solution 5 ml was transfer to 100 ml volumetric flask. The volume was adjusted to the mark with the methanol:water (10:90) to give a solution containing 50 µg/ml MOX. Bromfenac (BROM) standard stock solution: (1000 µg/ml)
Desai S. et al
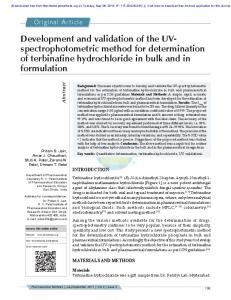
1 - 16 µg/ml solutions of MOX were prepared in methanol:water(10:90) and spectrum was recorded between 200-400 nm. Spectrums for above concentration were obtained with n=3. Similarly 1 -16 µg/ml solutions of BROM were prepared in Methanol:water(10:90) and spectrum was recorded between 200-400nm. MOX showed λmax at wavelength 291 nm and BROM showed λmax at wavelength at 267 nm. The overlain spectrums of MOX and BROM at different concentration were recorded. The Wavelength, for simultaneously detection of both drugs by Absorbance ratio method was 275 nm. Method: Calibration curve for the MOX (1 – 16 µg/ml) Appropriate volume of aliquot from standard MOX stock solution was transferred to different volumetric flasks of 50 ml capacity. The volume was adjusted to the mark with the methanol to obtain concentration of 1, 4, 7, 10, 13 and 16µg/ml. The curve of each solution against the Methanol:water(10:90) was recorded. Absorbance at 291 nm and 275 nm was measured and the plot of absorbance vs. concentration was plotted. The straightline equation was determined. Calibration curve for the BROM (1 - 16 µg/ml) Appropriate volume of aliquot from standard BROM stock solution was transferred to different volumetric flasks of 50 ml capacity. The volume was adjusted to the mark with the methanol to obtain concentration of 1, 4, 7, 10, 13 and 17µg/ml. The curve of each solution against the Methanol:water (10:90) was recorded. Absorbance at 291 nm and 275 nm was measured and the plot of absorbance vs. concentration was plotted. The straightline equation was determined.
573
J Pharm Sci Bioscientific Res. 2015 5(6):572-578
Preparation of Sample solution: From the Ophthalmic formulation , (0.5 % w/v MOX & 0.09 % w/v BROM), 1.1 mL taken in 100 mL volumetric flask and the volume was adjusted to mark with Methanol:water (10:90). This was working sample solution having strength 550 μg/mL of MOX & 1 μg/mL of BROM. From this solution, 10 ml was taken in 100 ml volumetric flask. This was working sample solution having strength 5.5 μg/mL of MOX and 1 μg/mL of BROM.
ISSN NO. 2271-3681
Inter day precision was determined by analyzing both the drugs individually daily for three days at 291 nm and 275 nm. (5) Linearity and Range
Validation of spectrophotometric method:
The linearity of analytical method is its ability to elicit test results that are directly proportional to the concentration of analyte in sample within a given range. The range of analytical method is the interval between the upper and lower levels of analyte that have been demonstrated to be determined within a suitable level of precision, accuracy and linearity.
(1) Accuracy
RESULT AND DISCUSSION:
Accuracy was determined by calculating recovery of MOX and BROM by the standard addition method. Known amounts of standard solutions of MOX and BROM were added to a pre-quantified test solutions of MOX (5.5 µg/mL) and BROM (1 µg/mL). Each solution was measured in triplicate, and the recovery was calculated by measuring absorbance.
From overlain spectra of MOX and BROM it is clear that MOX exhibited λmax at 291 nm and BROM exhibits λmax at 267 nm. The overlain spectra of MOX and BROM reveals that the both the drug exhibits distinct λmax and also isobestic point was found at 275 λmax. For estimation of MOX and BROM using Q Ratio Absorption method was decided to be used. In this method two wavelengths are required. One wavelength is selected at which MOX shows maximum absorbance, while second wavelength is selected as isobestic point.
(2) Precision The precision of an analytical method is the degree of agreement among individual test results when the method is applied repeatedly to multiple samplings of homogenous samples. (3) Repeatability Standard solutions of MOX were prepared of linearity range and spectrums were recorded. Absorbance was measured at 291 nm and 275 nm. The absorbance of the same concentration solution was measured six times and RSD was calculated. In the similar manner solutions of BROM were prepared and spectrums were recorded. Absorbance was measured at 291 nm and 275 nm . The procedure was repeated for six times and RSD was calculated. (4 )Intra and inter day precision Variation of results within the same day (intra day), variation of results between days (inter day) were analyzed. Intraday precision was determined by analyzing MOX and BROM individually for three times in the same day at 291 nm and 275 nm.
Desai S. et al
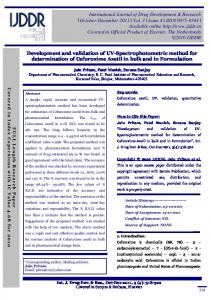
Calibration data at 291 and 275 nm for MOX and 291 and 275 nm BROM are shown in Table. Calibration curves for MOX and BROM were plotted between absorbance and concentration. The following equations for straight line were obtained for MOX and BROM. Linear equation for MOX at 291 nm, Y = 0.0816x + 0.0460 Linear equation for MOX at 275 nm, Y = 0.0399x + 0.0096 Linear equation for BROM at 291 nm, Y = 0.0141x + 0.0539 Linear equation for BROM at 275 nm, Y = 0.0399x + 0.0096 The developed Q Absorption Ratio method was validated. The linear range, correlation coefficient, detection limit and standard deviation for MOX and BROM by Spectrophotometry method are shown in Table. Accuracy was determined by calculating the recovery. The method was found to be accurate with % recovery 98.18- 101.21 % for MOX and 98.00-101.00% for BROM respectively at 275nm and 98.36-100.24% for MOX and 98.00-102.00% for BROM at 291nm. Precision
574
J Pharm Sci Bioscientific Res. 2015 5(6):572-578
was calculated as repeatability and intraday and interday variation for both the drugs. The LOD and LOQ for MOX and BROM was found to be 0.202µg/mL and 0.614 μg/mL at 275 nm respectively and 0.065 and 0.437 μg/mL LOD for MOX and 0.197 and 1.31 μg/mL LOQ for BROM at 291 nm respectively. Summary of validation parameters are shown.
ISSN NO. 2271-3681
Table:1: Result of calibration readings at 275 nm for MOX and BROM in Methanol:water (10:90) Concentrations
Absorbance at 275 nm
(µg/ml)
Mean ± S.D. (n=3)
1
0.050±0.00177
4
0.170±0.00276
7
0.294±0.00264
10
0.399±0.00260
13
0.526±0.00244
16
0.653±0.0025
Marketed formulation was analyzed by the proposed method and assay result of marketed formulation is shown.
0.8 y = 0.0399x + 0.0096 R² = 0.9994
0.6 0.4 Figure:2: Overlain spectra of MOX at 291nm
0.2 0 Series1 5
0
10 Linear (Series1) 15
20
Figure:5: Calibration curve of MOX and BROM at 275nm
Figure:3: Overlain spectra for BROM at 265nm
Concentrations
Absorbance at 291 nm
(µg/ml)
Mean ± S.D. (n=3)
1
0.132±0.00173
4
0.356±0.00234
7
0.623±0.00203
10
0.879±0.000911
13
1.098±0.00151
16
1.349±0.00114
Table:2: Result of calibration readings at 291 nm for MOX in Methanol:water (10:90) Figure:4: Overlay of MOX and BROM (10 µg/ml) at 275 nm
Desai S. et al
575
J Pharm Sci Bioscientific Res. 2015 5(6):572-578
ISSN NO. 2271-3681
1.5 y = 0.0816x + 0.0460 R² = 0.9993
1 0.5 0 0
5 Series1
10
15 Linear (Series1)
0.0096
0.0096
Limit of Detection (μg/ml)
0.202
0.202
Limit of Quantitation (μg/ml)
0.614
0.614
20
Figure:6:Calibration curve of MOX at 291 nm Concentrations
Absorbance at 291 nm
(µg/ml)
Mean ± S.D. (n=3)
1
Table:5: Statistical data for MOX and BROM (at 291 nm) by Q Absorption Ratio method Parameter
MOX (at 291nm)
BROM (at 291nm)
0.068±0.00191
Linear Range (µg/ml)
1-16
1-16
4
0.108±0.00207
Slope
0.0816
0.0141
7
0.154±0.00151
Intercept
0.0460
0.0539
10
0.198±0.000911
Limit of Detection (μg/ml)
0.065
0.437
13
0.235±0.00234
1.32
0.279±0.00250
Limit of Quantitation (μg/ml)
0.197
16
Table:3: Result of calibration readings at 291 nm for BROM in Methanol:water (10:90) 0.3 y = 0.0141x + 0.0539 R² = 0.9993
0.2
Intercept
Table:6: Determination of Accuracy of MOX and BROM (at 275nm) Amt of sample
Amt. of drug added
Amt. recovered
MO X
BRO M
MO X
BRO M
(μg/ ml)
(μg/ ml)
(μg/ ml)
(μg/ ml)
0.1
MO X
BRO M
0
(μg/ ml)
(μg/ ml)
5.5
1
0
0
5.30
2.41
5.5
1
2.75
0.5
2.7
5.5
1
5.5
1
5.5
1
8.25
1.5
0
5 Series1
10
15 Linear (Series1)
20
% Recovery MO X%
BRO M %
0.49
98.1 8
98.0 0
5.49
1.01
99.8 1
101. 00
8.35
1.48
101. 21
98.6 6
Figure:7: Calibration curve of BROM at 291 nm Table:4: Statistical data for MOX and BROM (at 275 nm) by Q Absorption Ratio method Parameter
Linear Range (µg/ml) Slope
Desai S. et al
MOX(at 275 nm)
BROM (at 275nm)
1-16
1-16
0.0399
0.0399
576
J Pharm Sci Bioscientific Res. 2015 5(6):572-578
ISSN NO. 2271-3681
Table:7: Determination of Accuracy of MOX and BROM (at 291 nm) Amt of sample
Amt. of drug added
Amt. recovered
MO X
BRO M
MO X
BRO M
(μg/ ml)
(μg/ ml)
(μg/ ml)
(μg/ ml)
% Recovery MO X%
Table:10: Summary of validation Parameters of absorabance ratio method Parameters
MO X
BRO M
(μg/ ml)
(μg/ ml)
5.5
1
0
0
5.38
0.98 7
5.5
1
2.75
0.5
2.74
0.49
99.6 3
98.0 0
Repeatability (RSD, n=6)
5.5
1
5.5
1
5.41
1.02
98.3 6
102. 00
Precision(RSD)
5.5
1
8.25
1.5
8.27
1.48
100. 24
98.6 6
Interda y
Recovery%
(n =3)
(n =3)
(μg/m l)
7
0.18
0.89
10
0.32
13
0.28
(μg/m l)
Intrada y
Interda y
(n =3)
(n =3)
7
0.18
0.88
0.78
10
0.34
0.75
0.55
13
0.25
0.58
Conc.
Table:9: Precision data for MOX and BROM at 291nm MOX at 291nm
BROM at 291nm
Intrada y
Interda y
(n =3)
(n =3)
(μg/m l)
7
0.24
0.37
10
0.20
13
0.13
Conc. (μg/m l)
Desai S. et al
Intrada y
Interda y
(n =3)
(n =3)
7
0.80
1.94
0.29
10
0.77
1.51
0.18
13
0.55
1.75
Conc.
MOX
BROM
(275 nm)
(275 nm)
(291 nm)
(291nm)
2.517.5
1-11
2.517.5
1-11
98.18101.21
98101.00
98.36100.24
98-102
0.18
0.15
0.06
0.21
0.130.24
0.550.80
0.180.37
1.511.94
Linearity range
Intra-day (n=3)
0.180.32
Inter-day (n=3)
0.550.89
BROM at 275nm
Intrada y
Conc.
BROM
BRO M %
Table:8: Precision data for MOX and BROM at 275nm MOX at 275nm
MOX
0.180.34 0.580.88
Table:11: Assay Results of Marketed Formulation (absorbance ratio) Formul ation
Eyedro ps
Actual concentra tion
Amount obtained
%
%
µg/ml
BR OM
µg/ml
(n=3)
M OX
96. 18
99. 6
M OX
BR OM
MOX
BROM
5.5
1
5.29±0. 0174
0.996±0. 00158
CONCLUSION: The low value of relative standard deviation for repeated measurement indicates that the method is precise. The value of % recovery is approximately 100%, which indicates that these methods can be used for estimation of these two drugs in combined dosage forms without any interference due to the other components present in the formulations. Hence this study presents simple,
577
J Pharm Sci Bioscientific Res. 2015 5(6):572-578
ISSN NO. 2271-3681
accurate, precise and rapid spectroscopic analytical method for the simultaneous estimation of these two drugs in combined dosage form. 9) ACKNOWLEDGEMENT: Authors are thankful to Vital Healthcare, Vapi and Enaltec labs, Mumbai for providing free gift sample and ROFEL Shri G.M Bilakhia college of Pharmacy, Vapi for providing necessary facilities and constant encouragement.
10)
REFERENCES: 1)
2)
3)
4)
5)
6)
7)
8)
Dabhi MJ, Patwari AH, Journal of Chemistry and Pharmaceutical Research, Simultaneous determination of Moxifloxacin Hydrochloride and Dexamethasone Sodium phosphate in eye drops by HPLC and absorbance correction method., 2012;4(10):4462-67 Reddy GN, Prasad VVS, Maharana P, Indian Journal of Pharmacy and Bioscience, Development and validation of a stability indicating UPLC method for determination of Moxifloxacin HCl in pharmaceutical formulation., 2012; 2(1):145-156 Dewani AP, Barik BB, Kanungo SK, Wattyani BR ,American-European Journal of Science and Research,Development and validation of RP-HPLC method for determination of Moxifloxacin in presence of its degradation production., 2011; 6(4): 192-200 Sahu SK, Afzal Azam Md, Sahu D, Banarjee M, Pharmacology online, Spectrophotometric estimation of Moxifloxacin in bulk and its pharmaceutical formulation.,2011; 491-495 Shrivastava SK, Bhandari P., Patidar A, International Journal of Pharmaceutical Research and Development,Simultaneous estimation of Moxifloxacin HCl and Prednisolone acetate formulation by Q analysis method., 2012; 4(07):118-122 Pankaja SK, Niranjan MS, Chaluvaraju KC, Rajendra CE,International Journal of Pharmaceutical Research and Development, Method development and validation for the simultaneous estimation of Moxifloxacin HCl and Ornidazole by RP-HPLC., 2011; 4(04):129-131. Misra M, Misra AK, Zope P, Panpaliya GM, Dorle AK., Journal of Global Pharmaceutical Technology, Simple and validated UV spectroscopic method for estimation of Moxifloxacin HCl in bulk and formulation.,2009;2(6):21-27 Patel SK, Patel KP, International Research Journal of Pharmacy, Spectrophotometric estimation of
Desai S. et al
11)
12)
Loteprednol Etabonate and Moxifloxacin Hydrochloride in eyedrops by Q absorbance ratio method, 2013;4(1):186-189 Dewani AP, Bakal RL, Dr. Shiradkar MR, Dr. Chandewar AV,International Journal of Pharmaceutical Research and Development, Asorption ratio method for the estimation of Moxifloxacin Hydrochloride and Ketorolac trimethamine in their combined dosage form by UV-visible spectroscopy.,2011;3(7):21-26 Shah RS, Pradhan P., Dey S.,International Journal of Pharmaceutical Technology and Research, Quantitative estimation of Cefixime and Moxifloxacin in pharmaceutical preparation by UV spectrophtometric method., 2013;5(1):198-204 Vyas PJ, Dave JB, Patel CN; Indian Journal of Pharmaceutical science and research, Simultaneous estimation of Moxifloxacin HCl and Bromfenac sodium in eyedrops by spectroscopic methods, 2012;3(7):21372142 Dhillon V, Chaudhary A, African Journal of Pharmaceutical science and Pharmacy, A validated HPTLC method for estimation of Moxifloxacin HCl in tablet.,2012; 1(1):74-84
578