Gummadi et al., International Current Pharmaceutical Journal 2012, 1(10): 317-321 http://www.icpjonline.com/documents/Vol1Issue10/03.pdf
ORIGINAL RESEARCH ARTICLE
International Current Pharmaceutical Journal
OPEN ACCESS
Development and validation of UV spectroscopic methods for simultaneous estimation of ciprofloxacin and tinidazole in tablet formulation *Sowjanya Gummadi1, Devi Thota1, Sri Valli Varri1, Pratyusha Vaddi1, Venkata Lakshmi Narasimha Seshagiri Rao Jillella 2 1 2
GITAM Institute of Pharmacy, GITAM University, Visakhapatnam-530045, India College of Pharmaceutical Sciences, Andhra University, Visakhapatnam-530003, India
ABSTRACT Two simple, accurate, precise, reproducible and economical UV spectroscopic methods (A & B) for simultaneous estimation of Ciprofloxacin and Tinidazole in tablet dosage form have been developed. Method A employs solving of simultaneous equations based on the measurement of absorbance at two wavelengths, 271nm and 318nm which are the λmax values of Ciprofloxacin and Tinidazole respectively in phosphate buffer (pH 6.8). Method B is based on the principle of Q-Analysis where in the absorbance was measured at 292nm (iso-absorptive point) and 271nm (λmax of Ciprofloxacin)in phosphate buffer (pH 6.8). Ciprofloxacin and Tinidazole shows linearity at all the selected wavelengths and obeys Beer’s law in the concentration range of 10-35µg/mL and 10-80µg/mL respectively. Recovery studies for Ciprofloxacin and Tinidazole were performed and the percentage recovery for both the drugs was obtained in the range of 98.1-99.7% (Method A) and 98.0-100.4% (Method B) confirming the accuracy of the proposed method. Both the methods showed good reproducibility and recovery with %RSD less than 2. Statistical validation of the data shows that the proposed methods can be successfully applied for the routine analysis of drugs in commercial tablets. Key Words: Ciprofloxacin, tinidazole, simultaneous equations, Q-Analysis, iso-absorptive point, buffer, molar absorptivity.
INTRODUCTION INTRODUCTION Ciprofloxacin (CPX) is a fluorinated quinolone antibacterial which is chemically 1-cyclopropyl-6fluoro-4-oxo-7-(piperazin-1-yl)-quinoline-3-carboxylic acid (The Merck Index, 2006). Ciprofloxacin is a broad spectrum antibiotic active against both Gram-positive and Gram-negative bacteria. It functions by inhibiting DNA gyrase, a type II topoisomerase, and topoisomerase IV enzymes necessary to separate bacterial DNA, thereby inhibiting cell division (Drlica and Zhao, 1997). Tinidazole (TNZ) is chemically 1-(2-ethylsulfonylethyl)-2-methyl-5-nitro-imidazole (The Merck Index, 2006). It is active against both protozoa and obligate anaerobic bacteria. It damages DNA strands or inhibit DNA synthesis in microorganism.
Literature survey revealed that various analytical methods such as UV spectroscopy (Bombale et al., 1997; Sharma et al., 2011), HPLC (Bhatia et al., 1999), pulsepolarography (Salvi and Sathe, 2010) have been reported for the simultaneous estimation of both the drugs. This study is useful because these two drugs are commonly administered simultaneously. The UV spectrophotometric analysis is often preferred in quality control testing and ordinary laboratories due to its broader availability, suitability and ease of use (Nijhu et al., 2011). The aim of the present investigation is to develop a simple, sensitive and reproducible UV Spectrophotometric method for analysis of CPX and TNZ in a combined tablet dosage form and hence an economical method was developed and validated according to the ICH guidelines.
*Corresponding Author: Sowjanya Gummadi, Assistant Professor GITAM Institute of Pharmacy, GITAM University Rushikonda,Visakhapatnam-530045 India E-mail:
[email protected] Contact No.: +91-9989640339
© 2012 Gummadi et al.; licensee Saki Publishing Club. This is an Open Access article distributed under the terms of the Creative Commons Attribution License (http://creativecommons.org/licenses/by-nd/3.0/), which permits unrestricted use (including commercial use), distribution and reproduction of the work in any medium, provided the original work is properly cited and remain unaltered.
MATERIAL AND MATERIALS ANDMETHODS METHODS
1.0680 1.0000
Instruments Absorbance measurements were made on Shimadzu 1800 UV/Visible spectrophotometer with a pair of 10 mm matched quartz cells, Shimadzu digital balance for weighing and Cintex sonicatorwere used.
CPX
Abs.
0.5000
Chemicals and reagents All chemicals were of analytical reagent grade and solutions were prepared with double distilled water. Ciprofloxacin and Tinidazole gift samples were obtained from Dr. Reddy’s Laboratories, Hyderabad. Potassium dihydrogen ortho phosphate and Methanol were procured from E. Merck Co., Mumbai, India. Sodium hydroxide was purchased from Qualigen’s. Combined tablets of CPX and TNZ (Ciplox-Tz, Ciprolet) were procured from the local pharmacy. Procedure Preparation of phosphate buffer (pH 6.8)
Accurately weigh about 0.896 gm of NaOH, 6.804 gm of KH₂PO₄, dissolve in distilled water and make up the volume to 1Litre with distilled water. Preparation of stock solution (1000µg/mL)
Accurately weighed quantity of pure Ciprofloxacin (10mg) and pure Tinidazole (10mg) were transferred into two separate10mL volumetric flasks, dissolved in methanol and made up the volume to 10mL with the same solvent. The stock solution was sonicated for 2min. Preparation of working standard solution (100µg/mL)
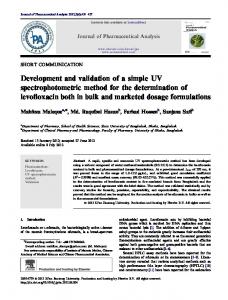
From the above stock solution 1mL each of CPX and TNZ was taken,transferred to separate 10mL volumetric flasks and the volume was made up to 10 mL with phosphate buffer. Simultaneous Equations Method (Method A) 10μg/mL solutions of CPX and TNZ were prepared separately in phosphate buffer (pH 6.8) and the solutions were scanned against blank in the entire UV range to determine the λmax values. Clear peaks were observed at 271nm for CPX and 318nm for TNZ. Hence these wavelengths were chosen as the λmax values for each drug respectively(Fig 1).Standard solutions of CPX and TNZ in the concentration range of 10-35µg/mL and 10-80µg/mL respectively were prepared in phosphate buffer and the absorbance of these solutions was measured at
T NDZ
0.0000
-0.4132 200.00
250.00
300.00
350.00
nm .
Figure 1: Overlay spectra of Ciprofloxacin and Tinidazole.
271nm and 318 nm. Calibration curves were plotted to verify the Beer’s law and the absorptivity values calculated at the respective wavelengths for both the drugs. Two simultaneous equations as below were formed using these absorptivity values, A (1%, 1cm). A1 = 924bCx + 108bCy A2 = 339bCx + 367bCy Where, CX and CY are the concentrations of CPX and TNZ measured in gm/100mLin sample solutions. A1 and A2 are the absorbances of mixture at selected wavelengths 271nm and 318nm respectively. Absorbance Ratio Method/ Q-Analysis (Method B) The absorbance ratio method is a modification of the simultaneous equation procedure. It depends on the property that for a substance, which obeys Beer’s law at all wavelength, the ratio of absorbance at any two wavelengths is constant value independent of concentration or path length. E.g. two dilutions of the same substance give the same absorbance ratio A1 / A2. In the USP, this ratio is referred to as Q value. In the quantitative assay of two components in admixture by the absorbance ratio method, absorbances are measured at two wavelengths, one being the λ max of one of the components (λ2) and the other being a wavelength of equal absorptivity of the two components (λ1), i.e., an iso-absorptive point (Beckett and Stenlake, 2005). A series of standard solutions of CPX and TNZ in the concentration range of 10-35µg/mL and 10-80µg/mL respectively were prepared in phosphate buffer and the absorbance of these solutions was measured at 292nm (iso-absorptive point) and 271 nm(λmax of CPX) (Figure 1). Calibration
318
Table 1: Absorptivity values (A 1%, 1 cm) of Ciprofloxacin (CPX) and Tinidazole (TNZ) for methods A & B. Absorptivity , A (1%, 1cm) Method A
Conc (µg/mL) 10 15 20 25 30 35 40 60 80 Mean
CPX 271nm 944.6 956.67 926.05 910.04 905.1 899.31 923.63
Method B TNZ
318nm 340.5 339.87 335.45 330.6 341.67 343.51 338.59
271nm 120 113.6 103.65 103.18 98.6 107.81
CPX 318nm 372.5 360.8 368.25 374.5 360.39 367.29
292nm 217 201 203.15 201.32 202.6 202.4 204.5783
TNZ 271nm 943.6 955.66 926.05 910.04 905.1 899.31 924.62
292nm 217 200.5 204.53 198.5 192.5 202.605
271nm 120 113.6 103.6 103.1 98.6 107.81
Table 2: Results of simultaneous estimation of marketed formulation (Ciplox-Tz) for Methods A & B. Method Method A Method B
Label claim (mg/tablet) CPX TNZ 500 600 500 600
*Amount obtained (mg/tablet) CPX TNZ 494.5 598 496 602.4
*Recovery(%) ± SD CPX TNZ 98.9±0.25 99.8±0.27 99.4±0.21 100.4±0.18
*Mean of six estimations; CPX = Ciprofloxacin; TNZ = Tinidazole
Table 3: Regression analysis of calibration curves and summary of validation parameters for Methods A & B. Sl. Parameter No. 1
Beer’s law limit (μg ml-1)
2
Molar absorptivity (l mol-1 cm-1)
3
Sandell’s sensitivity (μg/cm2/0.001)
4
Intercept(c)
5
Slope (m)
6
Correlation coefficient (r2)
Drug CPX TNZ CPX TNZ CPX TNZ CPX TNZ CPX TNZ CPX TNZ
Method A 271nm
Method B 292nm 271nm
318nm 10-35 10-80
30614 2666 0.01 0.083 0.0418 0.018 0.0895 0.09 0.9992 0.998
11223 9082 0.029 0.026 0.004 0.0071 0.034 0.0365 0.999 0.9993
6779 5010 0.046 0.05 0.004 0.018 0.020 0.019 0.999 0.999
30614 2666 0.01 0.91 0.041 0.018 0.089 0.009 0.999 0.9989
Table 4: Results for recovery studies. Level of Drug in tablet Drug added (µg) (µg) Recovery (%) CPX TNZ CPX TNZ 80 8 10 6.4 8 100 8 10 8 10 120 8 10 9.6 12
*Drugrecovered (µg) Method A Method B CPX TNZ CPX TNZ 14.1 17.8 13.96 17.7 15.7 19.8 15.6 19.5 17.3 21.6 17.2 21.5
*Recovery(%) ± SD Method A Method B CPX TNZ CPX TNZ 98.8±0.17 99±0.13 98±0.5 98.9±1.3 98.9±0.18 98.7±0.26 98.7±0.15 99.7±0.19 98.1±0.42 98.3±0.45 98.3±0.28 98.3±1.01
*Mean of three estimations; CPX = Ciprofloxacin; TNZ = Tinidazole
319
Table 5: Results for precision studies. Sl. No. 1 2 3
Conc (µg/mL) CPX 8 16 32
TNZ 10 20 40
*Assay(%) ± SD Method A CPX 98.7±0.23 98.73±0.23 98.83±0.57
TNZ 98.93±0.12 99.26±0.23 98.38±0.68
Method B CPX 98.26±0.64 99.2±0.69 98.2±0.69
TNZ 99.3±0.41 98.7±0.26 98.67±0.29
*RSD (%) Method A Method B CPX TNZ CPX TNZ 0.26 0.12 0.65 0.41 0.24 0.23 0.71 0.26 0.59 0.69 0.75 0.29
*Mean of three estimations; CPX = Ciprofloxacin; TNZ = Tinidazole
curves were plotted to verify the Beer’s law and the absorptivity values calculated at the respective wavelengths for both the drugs. The absorptivity values are reported in Table 1. The concentration of two drugs in mixture was calculated by using the following equations: C Q m −Q y A 1 X=
C
Q x −Q y
×
aX 1
Q −Q x A Y= m × 1 Q y −Q x a Y 1
Where, A1 and A2 are the absorbances of mixture at 292nm and 271nm,ax1 (107.8), ax2 (367.3) and ay1 (924.6), ay2 (348.6) are A (1%, 1 cm) of TNZ and CPX at 292nm and 271nm respectively, Q m = A2 A1 ,Q x = ax2 ax1 and Q y = ay2 ay1 Assay of tablets by Method A and B 20 commercial tablets of CPX and TNZ were triturated and powder equivalent to 10mg of TNZ and 8.0mg of CPX respectively was weighed and transferred to 10mL volumetric flask, dissolved in methanol, volume adjusted up to the mark with the same solvent and mixed well with the help of a sonicator. The solution was filtered through Whatman filter paper no 40.1mL of the above filtrate was diluted to 10mL with phosphate buffer to obtain a 100µg/mL solution with respect to TNZ. From this solution an aliquot was taken and made up the volume to 10mL with phosphate buffer expected to contain 10 and 8µg/mL of CPX and TNZ respectively. The absorbance of the sample solution was measured at 271nm and 318nm(Method A), 292nm and 271nm (Method B) and the data analyzed accordingly using the necessary equations. The analysis procedure was repeated for 6 times with tablet formulations. The result of analysis of tablet formulation is reported in Table 2. Validation (Method A&B) Linearity Appropriate dilutions of working standard solutions for CPX and TNZ were prepared in the concentration
range of 10-35µg/mL and 10-80µg/mL, respectively and analyzed as per the developed methods A & B. The results are reported in Table 3. Accuracy and Recovery studies To check the accuracy of the proposed method, recovery studies were carried out by standard addition method at three different levels according to ICH guidelines. A series of solutions of CPX and TNZ at 80%, 100%, and 120% of the standard preparation in the ratio of the formulation were prepared and checked for accuracy by determining the absorbance values at λmax of 271nm and 318nm (Method A) 292nm and 271nm (method B) respectively. To a fixed concentration of the formulation, varying concentrations of pure drug solutions were added and percentage recoveries calculated. The result of the analysis is given in Table 4. Precision Precision studies were performed at three different concentrations in the ratio of the formulation, each concentration prepared three times for CPX and TNZ together. The result of the analysis is given in Table 5.
RESULTSAND ANDDISCUSSION DISCUSSION RESULTS Ciprofloxacin and Tinidazole exhibited maximum absorption at 271nm and 318nm (Method A) ,they were also analyzed at 292nm and 271nm (Method B). CPX obeyed Beer’s law in the concentration range of 10-35μg/mL while TNZ obeyed the Beer’s law in the concentration range of 10-80μg/mL (Method A & B). The precision data shows that the reproducibility of the assay procedure was satisfactory. The recovery studies done by standard addition method has given satisfactory results with an average percentage recovery of 98.6% and 98.7% (Method A), 98.4% and 99.0% (Method B) for CPX and TNZ respectively. The regression analysis of the calibration curves and the optical characteristics
320
such as Beer’s law limits, molar absorptivities and Sandell’s sensitivities were also determined. The results shown in Table 3.
CONCLUSION CONCLUSION Two new, simple, sensitive and economical UV spectrophotometric methods were developed for the simultaneous analysis of Ciprofloxacin and Tinidazole in bulk and in pharmaceutical formulations. The developed methods were validated and from the statistical data, it was found that the methods were linear, accurate and precise and can be successfully applied for the analysis of pharmaceutical formulations without interference of excipients.
ACKNOWLEDGEMENT ACKNOWLEDGEMENT The authors are grateful to M/s Gitam Institute of Pharmacy, Gitam University, and Visakhapatnam for providing necessary facilities.
REFERENCES REFERENCES Beckett, A.H., Stenlake, J.B (2005) Practical pharmaceutical chemistry, (4th ed., part II, pp.286) CBS publishers, New Delhi. Bhatia, M.S., Kaskhedikar, S.G., Chaturvedi, S.C (1999) High performance liquid chromatographic estimation of Ciprofloxacin hydrochloride and Tinidazole from tablets.Indian Journal of Pharmaceutical Sciences,61(5), 311-312. Bombale, M.V., Kadam, S.S., Dhaneshwar, S.R (1997) Simultaneous spectrophotometric estimation of Ciprofloxacin and Tinidazole from a combined dosage form. Indian Journal of Pharmaceutical Sciences, 59(5), 265-8. Drlica, K., Zhao, X.K (1997) DNA gyrase, topoisomerase IV, and the 4-quinolones . Microbiol Mol Biol Rev, 61(3), 377392. Nijhu, R.S., Akhter, D.S., Jhanker, Y.M (2011) Development and validation of UV spectrophotometric method for quantitative estimation of Nitroglycerin in pharmaceutical dosage form. International Current Pharmaceutical Journal, 1(1), 1-5. [DOI] Salvi, V.S., Sathe, P.A., Rege,P.V (2010) Determination of Tinidazole and Ciprofloxacin Hydrochloride in Single Formulation Tablet using Differential Pulse Polarography .Journal of Analytical &Bio analyticalTechniques, 1(3). [DOI] Sharma, R., Pathodiya, G., Mishra, P.G., Sainy, J. (2011) A novel spectrophotometric method for quantitative determination of Ciprofloxacin hydrochloride and Tinidazole in tablets using hydrotropic solubilizing agent. Journal of Pharmacy Research, 4(3), 859-861. The Merck Index, (2006) 14th ed., pp.386, 1624, Merck & Co., INC., Whitehouse station, NJ.
321