APPLIED AND ENVIRONMENTAL MICROBIOLOGY, May 2008, p. 3242–3250 0099-2240/08/$08.00⫹0 doi:10.1128/AEM.02717-07 Copyright © 2008, American Society for Microbiology. All Rights Reserved.
Vol. 74, No. 10
Development of a Microbial Time/Temperature Indicator Prototype for Monitoring the Microbiological Quality of Chilled Foods䌤 Hariklia Vaikousi,1 Costas G. Biliaderis,1 and Konstantinos P. Koutsoumanis2* Laboratory of Food Chemistry & Biochemistry, Department of Food Science and Technology, School of Agriculture, Aristotle University, Thessaloniki, Greece,1 and Laboratory of Food Hygiene & Microbiology, Department of Food Science and Technology, School of Agriculture, Aristotle University, Thessaloniki, Greece2 Received 3 December 2007/Accepted 28 February 2008
A time/temperature indicator (TTI) system based on the growth and metabolic activity of a Lactobacillus sakei strain was developed for monitoring food quality throughout the chilled-food chain. In the designed system, an irreversible color change of a chemical chromatic indicator (from red to yellow) progressively occurs due to the pH decline that results from microbial growth and metabolism in a selected medium. The relation of the TTI response (color change) to the growth and metabolic activity (glucose consumption, lactic acid production, pH decrease) of L. sakei was studied. In addition, the temperature dependence of the TTI kinetics was investigated isothermally in the range of 0 to 16°C and modeled with a system of differential equations. At all temperatures tested, the pH and color changes of the TTI system followed closely the growth of L. sakei, with the endpoint (the time at which a distinct visual color change to the final yellow was observed) of the TTI coinciding with a population level of 107 to 108 CFU/ml. The endpoint decreased from 27 days at 0°C to 2.5 days at 16°C, yielding an activation energy of 97.7 kJ/mol, which was very close to the activation energy of the L. sakei growth rate in the TTI substrate (103.2 kJ/mol). Furthermore, experiments conducted on the effect of the inoculum level showed a negative linear relationship between the level of L. sakei inoculated in the system medium and the endpoint of the TTI. For example, the endpoint at 8°C ranged from 6 to 2 days for inoculum levels of 101 and 106 CFU/ml, respectively. This relationship allows the easy adjustment of the TTI endpoint at a certain temperature according to the shelf life of the food product of concern by using an appropriate inoculum level of L. sakei. The microbial TTI prototype developed in the present study could be used as an effective tool for monitoring shelf life during the distribution and storage of food products that are spoiled primarily by lactic acid bacteria or other bacteria exhibiting similar kinetic responses and spoilage potentials. Apart from the low cost, the main advantage of the proposed TTI is that its response closely matches the loss of the quality of a food product by simulating the microbial spoilage process in particular environments. visible color development, a movement toward a color change, or a mechanical change in consistency. In general, a requirement that the TTI response matches the loss in the quality of the food must be fulfilled for the successful application of TTIs to food products. It is thus necessary that the activation energy (E␣), indicating the temperature sensitivity of the TTI response, is similar to the E␣ of the food quality loss and that the TTI endpoint should coincide with the end of a product’s shelf life. In this context, the applicability of a particular TTI as a quality indicator requires a systematic kinetic study of both the food product’s deterioration and the TTI response (40, 41). This kinetic modeling approach and the methodology for applying TTI to food quality monitoring has been extensively reviewed by Taoukis (41) and has been applied to the optimization of the chill chain management of fish and meat products in many studies (15, 16, 20, 43). TTIs have also been applied in evaluations of the quality of various food products, including frozen vegetables (13, 14), dairy products (12), meat and poultry (26, 39), fresh seafood (32), and fresh mushrooms (3). A large number of commercial TTI prototypes have been developed, and their operation/function, as reviewed in the literature (17, 40, 41), is based on the principles of (i) molecular diffusion (e.g., of either a dyed ester along a porous wick—as determined with the 3M MonitorMark indicator—or
A modern quality and safety assurance system should prevent contamination through the monitoring, recording, and controlling of critical parameters during a product’s entire life cycle, which includes the postprocessing phase and extends over the time of use by the final consumer (20). Since temperature is the parameter that predominantly determines the shelf life and final quality and safety of food products after their processing according to Good Manufacturing Practices and Good Hygiene Practices, monitoring and recording the temperature conditions during distribution and storage are of crucial importance (40, 41). Time/temperature indicators or integrators (TTIs) are used as cost-effective and user-friendly devices to monitor, record, and translate the overall effect of temperature history on food quality in the chill chain down to a product unit level (15, 41, 42). Depending on the working principle, TTI systems are classified as chemical, physicochemical, or biological systems, with their integrated time-/temperature-dependent change being manifested as an irreversible
* Corresponding author. Mailing address: Aristotle University of Thessaloniki, Department of Food Science and Technology, School of Agriculture, Thessaloniki, Greece 54124. Phone and fax: 30-2310991647. Email:
[email protected]. 䌤 Published ahead of print on 7 March 2008. 3242
VOL. 74, 2008
MICROBIAL TTI FOR MONITORING QUALITY OF CHILLED FOODS
a viscoelastic material that migrates into a diffusively lightreflective porous matrix, progressively causing a visual temperature-dependent increase in the light transmission of the porous material—as determined with the Freshness Check indicator [both indicators are produced by the 3M Co., St. Paul, MN]); (ii) polymerization reactions (temperature-dependent polymerization reactions in which disubstituted diacetylene crystals polymerize into a highly colored polymer, as determined with, e.g., the Lifelines Fresh-Check and Freshness Monitor indicators [Lifelines Inc., Morris Plains, NJ]); (iii) enzymatic changes (decreases in pH via controlled enzymatic hydrolysis of a lipid substrate, leading to a color change in the indicator, e.g., the Vitsab TTI [Vitsab A.B., Malmo ¨, Sweden]); and (iv) microbial changes (the acidification of the TTI medium by selected lactic acid bacteria, which induces a color change in the indicator, e.g., the Cryolog TTIs [Cryolog S.A., Quimper, France]). Moreover, a new enzymatic-type TTI was recently developed based on the enzymatic hydrolysis of starch by an a-amylase (46). Among all TTI types, the microbial TTI edges out the others in that its TTI response is directly related to microbial food spoilage, as it reflects the bacterial growth and metabolism that occurs in the TTI system itself. To date, three types of commercial microbial TTIs, Traceo, Traceo restauration, and eO, which are based on the growth and metabolic activities of patent microbial strains, have been developed by Cryolog (Cryolog S.A., Quimper, France). However, details of the kinetic properties (e.g., the E␣ and endpoint options) of these TTIs are not available. In the present study, a microbially based TTI system was developed to monitor and record food quality during distribution and storage. In the proposed system, the irreversible color development that the TTI manifests is due to the color change of a chemical chromatic indicator which occurs upon pH decrease as a result of Lactobacillus sakei growth and metabolism in a selected substrate (growth medium). The objectives of this work were (i) to evaluate the relation between the TTI response (color change) and the growth and metabolic activity (glucose consumption, lactic acid production, pH decrease) of L. sakei in the TTI substrate, (ii) to study and model the kinetics of the TTI system as a function of temperature, and (iii) to investigate our ability to adjust the TTI endpoint by changing the inoculum level of L. sakei.
MATERIALS AND METHODS Preparation of the TTI system. A thorough preliminary study was carried out to identify/select an appropriate combination of the structural components of the developed TTI system, i.e., the proper bacterial strain, the substrate medium, and the chemical chromatic indicator. An L. sakei strain isolated from meat (kindly provided by E. Drosinos, Laboratory of Food Quality Control and Hygiene, Agricultural University of Athens) was selected as the choice microorganism among nine lactic acid bacterium strains, i.e., three L. sakei strains, two Lactobacillus curvatus strains, two Lactobacillus plantarum strains, and two Lactobacillus paracasei strains, based on its ability to substantially reduce the pHs of several growth media tested. The substrate media tested were nutrient broth (Merck, Darmstadt, Germany), saline (0.1% [wt/vol] proteose peptone and 0.85% [wt/vol] NaCl), tryptone soy broth (Merck), and MRS broth (Merck) at several levels of added glucose and yeast extract. In all of the above-mentioned liquid growth media, the pH was adjusted to 6.4 or 6.5 before sterilization. A total of seven different chemical indicators or mixtures were examined, namely, methyl red, chlorophenol red, bromocresol purple, a mixture of bromocresol green and chlorophenol red, resazurin, alizarin, and p-nitrophenol. For the
3243
selection of the chemical indicator, the basic characteristics taken into consideration were, first, whether it permitted microbial growth and, second, whether it exhibited an intense, distinct, and irreversible color change during the drop in the pH of the medium in which it was added. Nutrient broth enriched with glucose and yeast extract was identified as the most appropriate growth medium for adequate microbial growth and activity, while chlorophenol red was chosen as the chemical indicator because it leads to an irreversible color change from red to orange and finally to yellow (the endpoint), reflecting the progressive pH decline upon bacterial growth, and is not metabolized by the chosen microbial strain. Stock cultures of L. sakei were kept frozen (at ⫺30°C) in MRS broth supplemented with 20% glycerol. Regeneration of the cultures involved transferring 10 l of the stock culture into 10 ml of MRS broth (Merck, Darmstadt, Germany) and incubating it at 30°C for 24 h. The cultures regenerated in MRS broth (the estimated concentration of microbial cells ranged from 108 to 109 CFU/ml) were centrifuged (4°C, 6,000 ⫻ g, 20 min) (ALC refrigerated centrifuge model PK120R; ALC International Srl., Italy), and after the discard of the supernatant, the precipitated cells were transferred to 10 ml of quarter-strength Ringer’s solution and centrifuged again (4°C, 6,000 ⫻ g, 20 min). This washing procedure was repeated twice. The resulting final culture suspension was properly diluted (decimal dilutions in quarter-strength Ringer’s solution), and a portion of the appropriate dilution was inoculated into the final growth medium in order to achieve the desired inoculum level. For the experiments on the effect of temperature on the TTI response, the initial inoculum level in the growth medium was adjusted to 102 CFU/ml, whereas for the study of the effect of inoculum size, the inoculum level used ranged between 101 and 106 CFU/ml. As the substrate of the TTI system, nutrient broth (Merck, Darmstadt, Germany) was mixed with 0.5% (wt/vol) yeast extract (Merck, Darmstadt, Germany) and 2% (wt/vol) glucose (Merck, Darmstadt, Germany) and dissolved in distilled water. The liquid substrate was subsequently adjusted to a pH of 6.4 to 6.5 with 1 M HCl and then divided into 200-ml portions in screw-cap bottles and sterilized (121°C, 15 min). A chlorophenol red (Sigma-Aldrich Co., Gillingham, Dorset, United Kingdom) solution (0.2% [wt/vol] in 0.00944 M NaOH) was prepared, filter sterilized, and aseptically added at a concentration of 1.5% (vol/vol) into the sterilized growth medium prior to inoculation in order to examine the ability of the selected microorganism to develop the desired pH-induced chromatic change. The response of the TTI system was tested isothermally at five different storage temperatures (0, 4, 8, 12, 16°C) using high-precision (⫾0.2°C), lowtemperature incubators (models MIR 153 and MIR 253; Sanyo Electric, Oragun, Japan) at a fixed initial inoculum level of 2 log CFU/ml. The precise temperature history of the samples during storage was recorded with the aid of electronic temperature recorders (Cox Tracer; Cox Technologies, Belmont, NC); duplicate samples were stored at each temperature tested. The samples were tested at appropriate time intervals to allow for efficient kinetic analysis of microbial growth and for pH and color change. In addition, replicates of samples inoculated into the same growth medium but without the chemical chromatic indicator were prepared for the physicochemical kinetic analysis of the TTI system (determination of the residual glucose concentration and the lactic acid produced) as described below; all these tests were repeated twice. Microbiological analysis. Samples for the TTI system for each storage temperature were analyzed at different time intervals. Portions of 1 ml of the liquid medium were aseptically transferred to 9 ml of sterile quarter-strength Ringer’s solution. Decimal dilutions in the same Ringer’s solution were prepared, and triplicates (0.1-ml samples) of the appropriate dilutions were spread on MRS agar (Merck, Darmstadt, Germany) plates for the enumeration of viable counts after incubation at 30°C for 72 h. The plates were also examined visually for typical colony types and morphological characteristics associated with MRS agar growth medium. In addition, the selectivity of the medium was checked routinely by Gram staining and microscopic examination of smears prepared from randomly selected colonies obtained from the MRS agar plates to check for possible contamination. Physicochemical analysis. The pHs of 10-ml sample portions were measured using a microprocessor pH meter, pH 211 (Hanna Instruments, Romania). Inoculated samples that did not contain the chromatic chemical indicator were centrifuged (4°C, 6000 ⫻ g, 20 min) in order to obtain cell-free samples, needed for the measurements of glucose and lactic acid. The residual glucose concentration was determined spectrophotometrically (SP-8001 UV-VIS; Metertech Inc.) based on an enzymatic method using the glucose oxidase-peroxidase system coupled with a dye chromophore (4-amino-antipyrine) according to Biliaderis et al. (2). The produced lactic acid was assayed by a high-performance liquid chromatography (HPLC) system equipped with a 300-mm by 7.5-mm anionexclusion column (Alltech Associates Inc., Deerfield, IL), a Marathon IV HPLC
3244
VAIKOUSI ET AL.
APPL. ENVIRON. MICROBIOL.
pump (Rigas Labs, Thessaloniki, Greece), a manual 10-ml loop injector, a UV 6000 LP detector (SpectraSystem Finnigan MAT; Thermo Separation Products, San Jose, CA), and an insulated column oven, as described by Kristo et al. (25). Isocratic separation with a flow rate of 0.6 ml/min at 65°C and 0.0035 N H2SO4 as a mobile phase, filtered through a 0.45-mm nylon filter (Alltech Associates Inc.), was employed. Measurements were carried out via a UV–visible-light detector operated at 220 nm. A cell-free sample of 5 ml was centrifuged for 15 min at 4,000 rpm with a mixture of HPLC-grade water and acetonitrile (1:4, 15 ml; Sigma-Aldrich Ltd., Athens, Greece), and the extracts were filtered through a 0.2-mm nylon filter (Alltech Associates Inc.). Analysis was performed in duplicate batches, and the results reported are the means from two replicates. Standard solutions of lactic acid (Sigma-Aldrich Ltd.) in a mixture of water and acetonitrile (1:4, vol/vol) at several concentrations were used for column calibration. Color measurements. The kinetics of the color evolution of the model TTI system (microorganism, growth medium, and chemical indicator) was assessed using a hand-held colorimeter (chroma meter CR-410; Konica Minolta Sensing Inc., Japan) to determine the counterimmunoelectrophoresis color space coordinates L*, a*, and b*. The colorimeter was calibrated against a standard white reference tile. Samples of 10.00 ml were transferred to a clear petri dish and placed over the white reference tile, and color measurements were recorded in duplicate for each experimental trial by immersing the instrument’s head in the colored liquid medium. The color change of the TTI system was expressed as the index of total color change, ⌬E (in arbitrary units), as follows: ⌬E ⫽
冑共L* ⫺
L*0兲2 ⫹ 共a* ⫺ a*0兲2 ⫹ 共b* ⫺ b*0兲2
(1)
with L*0, a*0, and b*0 being the counterimmunoelectrophoresis color values at time zero. Modeling procedure. The microbial and physicochemical changes occurring during the storage of the TTI system under the specified isothermal conditions were described via a series of differential equations. The differential equations were integrated by using the Euler integration technique with Scientist software (MicroMath Scientific Software, Salt Lake City, UT). Initial parameter estimates were obtained by the manual iterations of changing the parameters and the visual comparison of predicted and experimental results after simulation. The initial estimates were then optimized by the least-squares method. Microbial growth was modeled using the following logistic equations. When time (t [h]) was less than or equal to the duration of the lag phase (h), dN ⫽0 dt
(2)
and when time was longer than the lag phase (h),
冉
冊
N dN N ⫽ max 1 ⫺ dt Nmax
(3)
where N is the population (CFU/ml), max is the maximum specific growth rate (h⫺1), and Nmax is the maximum population (CFU/ml) of L. sakei as estimated by the model. Glucose consumption was described by the maintenance energy model of Pirt (35): dG 1 dN ⫽ ⫺ ⫺ m GN dt YG dt
(4)
where G is the residual glucose concentration (mmol), YG is the cell yield coefficient for glucose consumption (CFU/mmol of glucose consumed), and mG is the maintenance coefficient for glucose (mmol of glucose/CFU/hour). Lactic acid production can be calculated by the consumption of glucose as described by Leroy and De Vuyst (29): dL dG ⫽ ⫺ YL dt dt
(5)
where L is lactic acid (mmol) and YL is a yield coefficient for the conversion of glucose to lactic acid (mmol of lactic acid/mmol of glucose). The pH decrease was modeled in terms of changes in proton concentration and as a function of the concentration of undissociated lactic acid, HA, on the basis of the model presented by Breidt and Fleming (5):
冉
冊
dP P HA ⫽a 1⫺ dt Pmax
(6)
where a is a coefficient, P is the concentration of protons, and Pmax is the
predicted maximum concentration of protons or, in other words, the minimum final pH of the model TTI system. In equation 6, the term HA for undissociated lactic acid can be replaced by the Henderson-Hasselbalch equation, specifically, HA ⫽
A⫺ 共1 ⫹ 10pH ⫺ pKa)
(7)
where A⫺ is the concentration of dissociated lactic acid and the pKa of lactic acid is 3.82. In addition, the change in the chromaticity value, ⌬E, was modeled by the four-parameter logistic equation using the Table Curve 2D software (version 4; SPSS Inc.), as follows: ⌬E ⫽ ⌬Emin ⫹
⌬Emax ⫺ ⌬Emin 1 ⫹ exp关⫺ ⌬E共t ⫺ ti兲兴
(8)
where ⌬Emin is the initial ⌬⌭ value (minimum value) at time zero, ⌬Emax is the maximum ⌬E value as estimated by the model, exp indicates exponential, ⌬E is the maximum rate for ⌬E evolution, t is measured in hours, and ti is the time (hours) when half of the ⌬Emax is attained. The temperature dependence of both the max of L. sakei and the reciprocal of the time at which the endpoint of the TTI (⌬E ⫽ 20) is reached was modeled using the Arrhenius model: ln Y ⫽ ln Yref ⫺
冉
E␣ 1 1 ⫺ R T Tref
冊
(9)
where Y is the max of L. sakei or the reciprocal of the amount of time to the endpoint of the TTI process, T is the absolute temperature (Kelvin), Yref is the rate at the reference temperature (h⫺1), the E␣ is in kJ/mol K, R is the universal gas constant, and Tref is the reference temperature (273 K). Adjustment of the endpoint of the TTI system. The effect of different inoculum levels on the response of the TTI system at 8°C was studied in order to relate the endpoint of the TTI process with the initial level of the inoculated microorganism. L. sakei was inoculated in the TTI substrate at various levels (1, 3, 5, and 6 log CFU/ml), and the experiments were carried out based on the procedures described above.
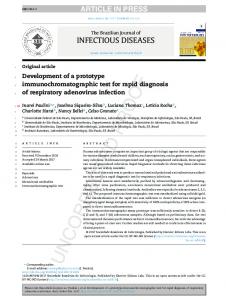
RESULTS AND DISCUSSION Description of the TTI system. We first defined the developed microbial TTI system, which consists of an L. sakei strain grown in nutrient broth enriched with glucose and yeast extract and also dyed with the chlorophenol red. Figure 1 shows the changes in the level of microbial growth, pH (decrease), glucose consumption, the production of lactic acid, and the evolution of the chromaticity value (⌬⌭) monitored throughout the storage of the TTI system at 8°C. It is worth mentioning that the presence of the chromatic indicator in the substrate medium did not affect at all the growth kinetics of L. sakei (data not shown). Thus, samples containing chlorophenol red, when the dye solution was added at the specific concentration of 1.5% (vol/vol), exhibited no inhibitory effect on the growth of the bacterial population and pH decline profiles similar to those of preparations lacking the incorporated chromatic indicator. The population of L. sakei was strongly related to glucose consumption and lactic acid production (inset in Fig. 1), leading to a pH drop and an irreversible change in the color of the system from the initial red (low ⌬⌭ values) to orange and then to the final yellow (high ⌬E values at populations close to Nmax; data points in the ⌬⌭ evolution curve were replaced with colored squares representing the respective colors of the TTI system at the indicated time points). The distinct visual color change to the final yellow was obtained when the ⌬E response reached a value of 20, and that time was adopted as the endpoint of the TTI system. The pH of the medium at the endpoint was close to 5.2. The time at which the endpoint was reached coincided with an L. sakei population of 107 to 108
VOL. 74, 2008
MICROBIAL TTI FOR MONITORING QUALITY OF CHILLED FOODS
3245
FIG. 1. Microbiological, physicochemical, and color changes occurring in the TTI system stored at 8°C; data points in the ⌬⌭ curve are replaced with colored squares representing the color of the TTI system at the indicated times.
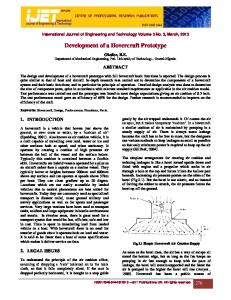
CFU/ml in the substrate. The latter microbial concentration has been either reported as the spoilage level or related to the end of the shelf lives of many food products spoiled by lactic acid bacteria or other bacterial groups (7, 9, 19, 22, 23, 30, 39, 43, 45). With respect to the variation in color of the TTI system, repeated experiments to determine ⌬⌭ values throughout the course of the culture’s growth (initial inoculum level, 102 CFU/ml) showed a mean value of 15.2% for the coefficients of variation for all sampling time intervals. The observed variation in the TTI responses is similar to the variation observed in the growth of spoilage organisms in foods (21–23). Temperature dependence of the TTI response. The experimental data describing the kinetics of the TTI system, i.e., both the microbial and the physicochemical changes, under all isothermal storage conditions tested are shown in Fig. 2, along with those predicted by the model curves according to differential equations 2 through 7, which also allowed for the estimation of all model parameters. As shown in Fig. 2, there is a good agreement between the observed data (symbols in Fig. 2) and the model predictions (lines in Fig. 2) of the microbial and physicochemical attributes. The max of the microorganism increased with the temperature, and such temperature dependence is well described by the Arrhenius equation (equation 9). The YG also increased with the storage temperature of the TTI, while the maintenance coefficient mG was not significantly affected by increasing the temperature from 4 to 16°C (Table 1). However, a higher value for mG (3.5 ⫻ 10⫺9 mmol of glucose/CFU/hour) was observed at 0°C. Increased values of the mG with increasing storage temperature conditions from 10 to 35 or even 45°C have been repeatedly reported in the literature (11, 27–29, 44), in contrast with the reported decreasing values of YG with increasing storage temperature from 20 to 45°C (11, 29, 44). The above-mentioned temperature ranges represent the optimum temperature conditions for the growth of bacterial strains, and thus, the observed deviations from this trend in this
study may be attributed to the lower storage temperatures examined in the present work. Moreover, the estimates of the YL were 1.6, 2.75, and 2.6 mmol of lactic acid per mmol of glucose at 8, 12, and 16°C, respectively (Table 1), implying a homofermentative response of L. sakei under these conditions. Theoretically, 2 mol of lactate and 2 mol of ATP are formed per mol of glucose used, while a conversion factor of 0.9 from the sugar carbon to end product is common and probably reflects the assimilation of the sugar carbon into the biomass (1). However, it is well known that nitrogen-containing organic matter is mainly responsible for the synthesis of cell material (6). The calculated YL values at 0 and 4°C were 0.55 and 1 mmol of lactic acid/mmol of glucose, respectively, indicating a potential heterofermentative route for this microorganism when it is grown at unfavorable, low temperatures. However, no additional organic acids, like acetic acid, were detected in the fermentation medium by HPLC analysis, further supporting the view that L. sakei grown under storage conditions with low temperatures has a homofermentative nature. Apparently, in such an abusive environment, L. sakei seems to use some extra glucose for building up cell material, but further research focusing on the growth of the L. sakei strain under storage conditions with low temperatures is required for supporting this notion. The following discussion focuses on the potential physiological mechanisms of the microbial responses observed under the critical low-storage-temperature conditions in an attempt to explain the estimated model parameters reported above. Decreasing values of YG indicate that energy is being progressively used for functions other than growth, and this conclusion is supported by previous reports on increased ATP requirements for additional cell maintenance functions (e.g., the maintenance of proton gradients across the cell membrane, the turnover of macromolecules such as mRNA, and the synthesis of additional proteins could all decrease ATP availability for growth) (36). These metabolic functions are reported to be
3246
VAIKOUSI ET AL.
APPL. ENVIRON. MICROBIOL.
FIG. 2. Microbiological and physicochemical changes occurring in the TTI system stored isothermally at 0, 4, 8, 12, and 16°C. Points depict observed experimental data, and solid lines are the model fittings.
strongly growth rate dependent (33). At low growth rates, biomass formation becomes energetically more expensive (e.g., higher protein content of cells), resulting in yield decreases (18); as a result, the maintenance energy expenditures constitute a significant portion of the total energy utilization (35). The Nmax of the microorganism as predicted by the model
was found to be constant and almost temperature independent, with an average value of 8.20 ⫾ 0.67 log10 CFU/ml (mean ⫾ standard deviation). However, the predicted Nmax of L. sakei at 0°C was 6.8 log10 CFU/ml, a value that is much lower than those obtained for the rest of the storage temperatures studied (8.25 to 8.35 log units). This finding is in agreement with the
VOL. 74, 2008
MICROBIAL TTI FOR MONITORING QUALITY OF CHILLED FOODS
3247
TABLE 1. Estimated parameters for equations 2 to 7a Temp (oC)
max (h⫺1)
Lag time (h)
Nmax (CFU/ml)
YG (CFU/mmol of glu) (107)
mG (mmol of glu/CFU/h) (10⫺9)
YL (mmol of LA/mmol of glu)
a (10⫺5)
Minimum pH
0 4 8 12 16
0.022 0.058 0.125 0.197 0.275
60 25 12 8.5 8.0
106.80 108.30 108.25 108.30 108.35
4.5 7 9 12 14
3.5 0.15 0.3 0.2 0.37
0.55 1.00 1.60 2.75 2.60
1.2 1.9 7 5 12
5.00 4.80 4.52 4.33 4.40
a
glu, glucose; LA, lactic acid; a, a coefficient in equation 6.
low growth rate and/or YG, resulting in limited lactic acid production, which also justifies in some way the high mG observed under such critical storage conditions (0°C). The kinetics of the color evolution of the TTI system, as expressed by the chromaticity value ⌬E, is shown in Fig. 3. The sigmoid patterns of ⌬E-time curves at all studied temperatures were well fitted by the logistic model equation (Fig. 3). The color change of the TTI system occurred when the medium pH was decreased to the point of the chromatic indicator color change, under all storage conditions. The endpoint of the TTI system (the time at which the ⌬⌭ reached the value of 20) decreased with increasing storage temperature; i.e., the endpoint of the TTI was estimated to be 640, 269, 113, 78.4, and 61.1 h at 0, 4, 8, 12, and 16°C, respectively. The Arrhenius plot for the effect of temperature on the TTI endpoint is shown in Fig. 4 (R2 ⫽ 0.946). The estimated value of the E␣ was 97.7 kJ/mol. This value is close to that of the E␣ of other available nonmicrobial TTIs, such as (i) an amylase-type TTI recently introduced by Yan et al. (46), with E␣ in the range of 102.7 to 113 kJ/mol; (ii) the TTIs by Lifelines, i.e., the Freshness Monitor indicator and the Fresh-Check type A6 indicator, with reported E␣ values of 86.0 kJ/mol and 83.6 kJ/mol, respectively (42, 43); (iii) the indicators of MonitorMark, with E␣ values ranging from 96.3 to 129.8 kJ/mol (38); and finally, (iv) the enzymatic TTIs of Vitsab types M and S, with E␣ values of 68.7 and 102.1 kJ/mol, respectively (43). The main advantage of the developed microbial TTI, com-
pared to other available nonmicrobial TTIs, is that its response (color change) is a result of a process simulating the actual quality loss process (microbial spoilage) of many foods (31). It is well known that the shelf lives of most chilled high-protein foods are linked to the growth and metabolic activities of the “specific spoilage organisms” (SSO; the fraction of the total microflora responsible for spoilage); indeed, the sensory rejection of such products is observed when the SSO reach a certain population level called the “spoilage level” (21–23). For example, the quality loss of most chilled meat products packed under vacuum or modified-atmosphere conditions is based on the growth and metabolic activities (acid production) of lactic acid bacteria, which result in an unacceptable sour/acidic/ cheesy odor when the bacterial population approaches the level of 107 to 108 CFU/g (4, 8, 9, 19, 30, 34, 37). It is also worth noting that the specific dominance of the L. sakei group in the spoilage microbial flora of these products has been demonstrated in several studies (8, 9, 37). The above-mentioned spoilage mode closely resembles the principles of the TTI developed in the present work, in which the color change is based on the growth and metabolic activity of L. sakei, while the time at which the TTI endpoint is reached coincides with an L. sakei population in the system medium of 107 to 108 CFU/ml at all temperatures tested. The parallel Arrhenius plots obtained for the TTI endpoint and the max of L. sakei (R2 ⫽ 0.946) indeed demonstrate the same temperature dependence between microbial growth and the TTI response (Fig. 4). The estimated value for the E␣ of L. sakei’s max was 103.2 kJ/mol, which is very close to the E␣ of the TTI endpoint (97.7 kJ/mol). The results from the studies of the effect of temperature on
FIG. 3. Evolution of the chromaticity response (⌬⌭) upon storage of the TTI system isothermally at 0, 4, 8, 12, and 16°C. Points depict experimental data, and solid lines are the logistic model fittings.
FIG. 4. Arrhenius plots describing the temperature dependence of the max and the time at which the endpoint of the TTI system is reached.
3248
VAIKOUSI ET AL.
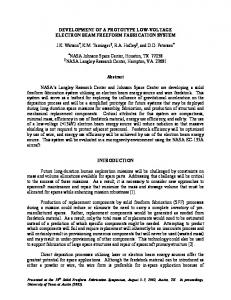
the TTI response indicate that the properties of the developed system match the kinetics of the loss of the quality of food products spoiled by lactic acid bacteria. Indeed, the E␣ values estimated for the TTI responses are similar to the E␣ values reported for the growth of lactic acid bacteria in various food products (21, 24). In addition, E␣ values differing from those of the TTI system by an amount in the range of ⫾30 kJ/mol have often been reported in the literature for the temperature dependence of the growth of other spoilage bacteria or pathogens in various chilled food products, e.g., Listeria monocytogenes in cooked frankfurters (10), pseudomonads, Shewanella putrefaciens, and Enterobacteriaceae in fish and meat (21, 22, 24, 43). Endpoint adjustment of the TTI. Additional studies were performed in order to investigate potential methods for the adjustment of the endpoint of the developed TTI system. According to Taoukis (41), there are two strict requirements that determine the successful application of a TTI: (i) the E␣ of the TTI response must equal the E␣ of the loss of the quality of the food product, and (ii) the endpoint of the TTI should correspond to the end of the product’s shelf life at a chosen reference temperature. For the first requirement, it has been shown that the E␣ of the proposed TTI system is very close to that of the loss in quality for products spoiled by lactic acid bacteria or other bacteria with the same kinetic behavior and spoilage potential. Regarding the second requirement, the TTI system, as it has been presented above, can be used for monitoring the quality of food products with a shelf life of about 1 month at 0°C (the endpoint at 0°C is 27 days). However, the shelf life of food at a certain temperature can vary significantly depending on various factors, such as the initial contamination level of SSO, pH, water activity, and the presence of antimicrobials, etc. (21–24). Thus, an effective TTI system should provide the ability to easily adjust the endpoint according to the shelf life of the product of concern. The structural components of the proposed TTI system also allow for matching the endpoint with the shelf life of a certain product by simply simulating the food environment. For example, an antimicrobial present in the food could be added at the same concentration in the TTI substrate, or the water activity of the TTI substrate can be adjusted by humectants to match that of the food. In all cases, the aim is to establish an environment in the TTI system as close as possible to that of the food matrix in order to achieve the same microbial growth in both systems. It needs to be noted that such changes in the TTI substrate will affect microbial growth and thus alter the endpoint at a certain temperature. It is also of interest to note that no significant effects on the E␣ are expected as a result of compositional changes in the growth media (21, 24). An alternative approach for the adjustment of the TTI endpoint is to change the level of the bacterial strain inoculated into the system. In this context, the effect of different initial concentrations of L. sakei (101 to 106 CFU/ml) on the response of the TTI at 8°C was examined. As expected, when the inoculum level was increased, the microorganism reached the maximum bacterial concentration at shorter times, also leading to faster pH decline profiles (Fig. 5a) and shorter endpoints (Fig. 5b). In particular, the endpoints were 6, 4.9, 3.3, and 2 days at inoculum levels of 101, 103, 105, and 106 CFU/ml, respectively. A similar effect of the initial microbial level has also been
APPL. ENVIRON. MICROBIOL.
FIG. 5. Effects of the initial inoculum level on the kinetics of microbial growth (filled symbols) and pH decline profiles (open symbols) (a), the ⌬⌭ chromaticity values (b), and the endpoints (c) of the TTI system stored at 8°C.
observed for the shelf lives of foods (22, 24); increasing the initial contamination level of the SSO results in a shorter shelf life since the time required for the SSO to reach the spoilage level decreases. A negative linear relationship between the level of L. sakei inoculated into the system substrate and the endpoint of the TTI was, in fact, noted (Fig. 5c). Such a relationship points to the ability of easily adjusting the TTI endpoint at a certain temperature according to the shelf life of the food product of concern by using an appropriate inoculum level of L. sakei in the TTI substrate. Further research is needed to transform the TTI prototype presented in this study into a commercial TTI product. A commercial TTI should be small, easily integrated as part of the food package, compatible with a high-speed packaging
VOL. 74, 2008
MICROBIAL TTI FOR MONITORING QUALITY OF CHILLED FOODS
process, resistant to normal mechanical abuse, and easily activated, and it should have a long shelf life before activation. The commercial form of the microbial TTI could be based on two separate compartments in the form of a plastic minipouch containing the microbial culture (freeze-dried, spray-dried, or microencapsulated) and another containing the growth medium with the chromatic indicator. The user would be able to activate the TTI by mechanically breaking the barrier that separates the two compartments. This design allows for an easy activation and a long shelf life of the TTI before activation, without the need for refrigeration or freezer storage. Conclusions. The microbial TTI prototype developed in the present study is based on the growth and metabolic activity of a Lactobacillus sakei strain. The activation energy of the TTI is 103.2 kJ/mol, while the endpoint at a certain temperature can be further adjusted according to the shelf life of the food product of concern by altering the TTI growth substrate or varying the inoculum level of L. sakei. The results indicated that the proposed TTI could be used as an effective tool for monitoring shelf life during the distribution and storage of food products that spoil by the growth and metabolic activity of lactic acid bacteria or other bacteria exhibiting a similar kinetic behavior and spoilage potential. In addition, based on the principles presented in this work, microbial TTIs targeting any other specific food products can be developed using the SSO of the food of interest in combination with an appropriate growth medium and an appropriate chromatic indicator. However, in any case, the applicability of the TTI as a quality indicator of a specific food commodity would require systematic kinetic studies of both food product spoilage and the respective TTI responses. ACKNOWLEDGMENTS This research was in part supported by the General Secretary for Research and Technology, Greek Ministry of Development (PENED 03151), and by the EU Framework VI program Food Quality and Safety (acronym: ProSafeBeef Food-CT-2006-36241). We acknowledge E. Drosinos and the Laboratory of Food Quality Control and Hygiene (Agricultural University of Athens) for kindly offering the Lactobacillus sakei strain used in this study. REFERENCES 1. Axelsson, L. T. 1993. Lactic acid bacteria: classification and physiology, p. 1–63. In S. Salminen and A. Von Wright (ed.), Lactic acid bacteria. Marcel Dekker, Inc., New York, NY. 2. Biliaderis, C. G., D. R. Grant, and J. R. Vose. 1981. Structural characterization of legume starches. I. Studies on amylose, amylopectin, and beta-limit dextrins. Cereal Chem. 58:496–502. 3. Bobelyn, E., M. L. A. T. M. Hertog, and B. M. Nicolaı¨. 2006. Applicability of an enzymatic time-temperature-integrator as a quality indicator for mushrooms in the distribution chain. Postharv. Biol. Technol. 42:104–114. 4. Borch, E., M. L. Kant-Muermans, and Y. Blixt. 1996. Bacterial spoilage of meat and cured meat products. Int. J. Food Microbiol. 33:103–120. 5. Breidt, F., and H. Fleming. 1998. Modeling of the competitive growth of Listeria monocytogenes and Lactococcus lactis in vegetable broth. Appl. Environ. Microbiol. 64:3159–3165. 6. Cocaign-Bousquet, M., C. Garrigues, P. Loubiere, and N. D. Lindley. 1996. Physiology of pyruvate metabolism in Lactococcus lactis. Antonie van Leeuwenhoek 70:253–267. 7. Dalgaard, P. 2003. FISH/spoilage of seafood, p. 2462–2471. In B. Caballero (ed.), Encyclopedia of food sciences and nutrition. Academic Press, Oxford, United Kingdom. 8. Devlieghere, F., J. Debevere, and J. VanImpe. 1998. Effect of dissolved carbon dioxide and temperature on the growth of Lactobacillus sake in modified atmospheres. Int. J. Food Microbiol. 41:231–238. 9. Devlieghere, F., A. H. Geeraerd, K. J. Versyck, H. Bernaert, J. F. VanImpe, and J. Debevere. 2000. Shelf life of modified atmosphere packed cooked meat products: addition of Na-lactate as a fourth shelf life determinative factor in a model and product validation. Int. J. Food Microbiol. 58:93–106.
3249
10. Diez-Gonzalez, F., D. Belina, T. P. Labuza, and A. Pal. 2007. Modeling the growth of Listeria monocytogenes based on a time to detect model in culture media and frankfurters. Int. J. Food Microbiol. 113:277–283. 11. Drosinos, E. H., M. Mataragas, and J. Metaxopoulos. 2006. Modeling of growth and bacteriocin production by Leuconostoc mesenteroides E131. Meat Sci. 74:690–696. 12. Fu, B., P. S. Taoukis, and T. P. Labuza. 1991. Predictive microbiology for monitoring spoilage of dairy products with time-temperature integrators. J. Food Sci. 56:1209–1215. 13. Giannakourou, M. C., and P. S. Taoukis. 2003. Application of a TTI-based distribution management system for quality optimization of frozen vegetables at the consumer end. J. Food Sci. 68:201–209. 14. Giannakourou, M. C., and P. S. Taoukis. 2002. Systematic application of time temperature integrators as tools for control of frozen vegetable quality. J. Food Sci. 67:2221–2228. 15. Giannakourou, M. C., K. Koutsoumanis, G. J. E. Nychas, and P. S. Taoukis. 2005. Field evaluation of the application of time temperature integrators for monitoring fish quality in the chill chain. Int. J. Food Microbiol. 102:323–336. 16. Giannakourou, M. C., K. Koutsoumanis, G. J. E. Nychas, and P. S. Taoukis. 2001. Development and assessment of an intelligent shelf life decision system for quality optimization of the food chill chain. J. Food Prot. 64:1051–1057. 17. Kerry, J. P., M. N. O’Grady, and S. A. Hogan. 2006. Past, current and potential utilization of active and intelligent packaging systems for meat and muscle-based products: a review. Meat Sci. 74:113–130. 18. Konopka, A. 2000. Microbial physiological state at low growth rate in natural and engineered ecosystems. Curr. Opin. Microbiol. 3:244–247. 19. Korkeala, H., S. Lindroth, R. Ahvenainen, and T. Alanko. 1987. Interrelationship between microbial numbers and other parameters in the spoilage of vacuum-packed cooked ring sausages. Int. J. Food Microbiol. 5:311–321. 20. Koutsoumanis, K., P. S. Taoukis, and G. J. E. Nychas. 2005. Development of a safety monitoring and assurance system for chilled food products. Int. J. Food Microbiol. 100:253–260. 21. Koutsoumanis, K., A. Stamatiou, P. Skandamis, and G. J. E. Nychas. 2006. Development of a microbial model for the combined effect of temperature and pH on spoilage of ground meat, and validation of the model under dynamic temperature conditions. Appl. Environ. Microbiol. 72:124–134. 22. Koutsoumanis, K., M. C. Giannakourou, P. S. Taoukis, and G. J. E. Nychas. 2002. Application of shelf life decision system (SLDS) to marine cultured fish quality. Int. J. Food Microbiol. 73:375–382. 23. Koutsoumanis, K., and G. J. E. Nychas. 2000. Application of a systematic experimental procedure to develop a microbial model for rapid fish shelf life predictions. Int. J. Food Microbiol. 60:171–184. 24. Koutsoumanis, K., P. Taoukis, E. Drosinos, and G. J. E. Nychas. 2000. Applicability of an Arrhenius model for the combined effect of temperature and CO2 packaging on the spoilage microflora of fish. Appl. Environ. Microbiol. 66:3528–3534. 25. Kristo, E., C. G. Biliaderis, and N. Tzanetakis. 2003. Modeling of rheological, microbiological and acidification properties of a fermented milk product containing a probiotic strain of Lactobacillus paracasei. Int. Dairy J. 13:517– 528. 26. Labuza, T. P., and B. Fu. 1995. Use of time/temperature integrators, predictive microbiology, and related technologies for assessing the extent and impact of temperature abuse on meat and poultry products. J. Food Saf. 15:201–227. 27. Lejeune, R., R. Callewaert, K. Crabbe, and L. De Vuyst. 1998. Modeling the growth and bacteriocin production by Lactobacillus amylovorus DCE 471 in batch cultivation. J. Appl. Microbiol. 84:159–168. 28. Leroy, F., and L. De Vuyst. 2002. Bacteriocin production by Enterococcus faecium RZS C5 is cell density limited and occurs in the very early growth phase. Int. J. Food Microbiol. 72:155–164. 29. Leroy, F., and L. De Vuyst. 1999. Temperature and pH conditions that prevail during fermentation of sausages are optimal for production of the antilisterial bacteriocin sakacin K. Appl. Environ. Microbiol. 65:974–981. 30. Mataragas, M., E. H. Drosinos, A. Vaidanis, and I. Metaxopoulos. 2006. Development of a predictive model for spoilage of cooked cured meat products and its validation under constant and dynamic temperature storage conditions. J. Food Sci. 71:M157–M167. 31. McMeekin, T. A., and T. Ross. 1996. Shelf life prediction: status and future possibilities. Int. J. Food Microbiol. 33:65–83. 32. Mendoza, T. F., B. A. Welt, S. Otwell, A. A. Teixeira, H. Kristonsson, and M. O. Balaban. 2004. Kinetic parameter estimation of time-temperature integrators intended for use with packaged fresh seafood. J. Food Sci. 69: 90–96. 33. Nielsen, J., K. Nikolajsen, and J. Villadsen. 1991. Structured modeling of a microbial system: II. Experimental verification of a structured lactic acid fermentation model. Biotechnol. Bioeng. 38:11–23. 34. Nychas, G. J. E., P. Skandamis, C. Tassou, and K. Koutsoumanis. 2007. Meat spoilage during distribution. Meat Sci. doi:10.1016/j.meatsci.2007.06.020. 35. Pirt, S. J. 1965. The maintenance energy of bacteria in growing cultures. Proc. R. Soc. Lond. B 163:224–231. 36. Rao, M. S., J. Pintado, W. F. Stevens, and J. P. Guyot. 2004. Kinetic growth
3250
37.
38. 39.
40.
41.
VAIKOUSI ET AL.
parameters of different amylolytic and non-amylolytic Lactobacillus strains under various salt and pH conditions. Bioresour. Technol. 94:331–337. Samelis, J., A. Kakouri, and J. Rementzis. 2000. Selective effect of the product type and the packaging conditions on the species of lactic acid bacteria dominating the spoilage microbial association of cooked meats at 4°C. Food Microbiol. 17:329–340. Shimoni, E., E. M. Anderson, and T. P. Labuza. 2001. Reliability of time temperature indicators under temperature abuse. J. Food Sci. 66:1337–1340. Smolander, M., H. Alakomi, T. Ritvanen, J. Vainionpa ¨a ¨, and R. Ahvenainen. 2004. Monitoring of the quality of modified atmosphere packaged broiler chicken cuts stored in different temperature conditions. A. Time-temperature indicators as quality-indicating tools. Food Control 15:217–229. Taoukis, P., and T. P. Labuza. 2003. Time-temperature indicators (TTIs), p. 103–126. In R. Ahvenainen (ed.), Novel food packaging techniques. Woodhead Publishing Ltd., Cambridge, United Kingdom. Taoukis, P. S. 2001. Modeling the use of time-temperature indicators in distribution and stock rotation, p. 402–432. In L. M. M. Tijkskens, M. L. A. T. M.
APPL. ENVIRON. MICROBIOL.
42. 43.
44.
45.
46.
Hertog, and B. M. Nicolaı¨ (ed.), Food process modeling. CRC Press, Washington, DC. Taoukis, P. S., and T. P. Labuza. 1989. Applicability of time-temperature indicators as shelf life monitors of food products. J. Food Sci. 54:783–788. Taoukis, P. S., K. Koutsoumanis, and G. J. E. Nychas. 1999. Use of timetemperature integrators and predictive modeling for shelf life control of chilled fish under dynamic storage conditions. Int. J. Food Microbiol. 53: 21–31. Van den Berghe, E., G. Skourtas, E. Tsakalidou, and L. De Vuyst. 2006. Streptococcus macedonicus ACA-DC 198 produces the lantibiotic, macedocin, at temperature and pH conditions that prevail during cheese manufacture. Int. J. Food Microbiol. 107:138–147. Vermeiren, L., F. Devlieghere, and J. Debevere. 2004. Evaluation of meat born lactic acid bacteria as protective cultures for the biopreservation of cooked meat products. Int. J. Food Microbiol. 96:149–164. Yan, S., C. Huawei, Z. Limin, R. Fazheng, Z. Luda, and Z. Hengtao. 2007. Development and characterization of a new amylase type time-temperature indicator. Food Control. doi:10.1016/j.foodcont.2007.04.012:27.