© by PSP Volume 17 – No 8a. 2008
Fresenius Environmental Bulletin
DEVELOPMENT OF A MODIFIED HARDY-CROSS ALGORITHM FOR TIME-DEPENDENT SIMULATIONS OF WATER DISTRIBUTION NETWORKS Selami Demir*, Kaan Yetilmezsoy and Neslihan Manav Faculty of Civil Engineering, Department of Environmental Engineering, Yildiz Technical University, 34349 Yildiz, Besiktas, Istanbul/Turkey
ABSTRACT The Hardy-Cross method that has been widely used in steady-state analyses of water distribution networks was modified in this study. The modified methodology involves the steady-state solutions of the system at various instants. The methodology suggests bringing these steady-state solutions together to form a time-dependent simulation result. A spreadsheet solution was also developed for the modified Hardy-Cross algorithm. Microsoft Excel™ macros were used to implement the newly developed algorithm. The computer program is able to perform both steady-state and time-dependent analyses. It offers the use of Darcy-Weisbach or Hazen-Williams equations for the calculation of frictional losses. Both Jain and Colebrook-White equations can be used in the analyses. The computer program can also account for minor losses through the pressure pipes. The program was tested for an example water distribution system along with EPANET calculations. The modified Hardy-Cross method was proved to be an accurate tool for time-dependent simulation of water distribution networks. This study represents the development of this accurate, modified algorithm based on steady-state Hardy-Cross Method. This newly developed methodology can easily be used for both educational and professional purposes.
KEYWORDS: Hardy-Cross, water distribution system, steady-state, time-dependent simulation.
INTRODUCTION The demand for water needed to serve agriculture, industry, sanitation, and domestic consumption increases continuously along with population and economic growth. However, with increasing development and urbanization, water flow rates and other hydraulic requirements associated with water distribution systems have been estimated to increase on both national and local scale. Lin et al. [1] have reported that expansion and construction of new water
supply areas have made the water distribution network become even more complicated and resulted in numerous problems of water allocation, water supply safety, operation and management. Therefore, managing the water distribution systems in a sustainable and integrated manner is necessary to meet the growing demand of water for drinking, industrial and other necessities. In this regard, there is an urgent need to develop well-designed and optimized solution methods to achieve better control of water distribution systems. For this purpose, several investigators have conducted studies on the calculation of complex water distribution networks using different solution approaches. However, most have limited use when working with high-dimensional hydraulic data. The present day water distribution networks are complex and require huge investments in their construction and maintenance. Therefore, in order to develop a continuous strategy for the management of water distribution systems, hydraulic parameters should be attentively controlled routinely for the duration of the testing, and network quality should also be verified under various operating conditions. However, engineers may not have enough time to monitor all hydraulic parameters under different operating conditions. Hence, a number of modification attempts to the standard solution methods for development of a powerful algorithm may help to assess both steady-state solutions and particularly time-dependent simulations of water distribution systems when the nodal demands change on a daily basis. Water distribution systems may be laid down in two ways: in loopal networks and in branching structures. From a view point of operational concerns, branching distribution systems, also called dead-end systems, may lead mainly to operational problems in the aspect of system pressure, especially places near the dead-ends. In order to overcome this problem, pipes may be laid down in a loopal manner, which is the most commonly used construction method throughout the world. This way, it is easier to sustain much higher operational pressures all over the distribution system.
1045
© by PSP Volume 17 – No 8a. 2008
Fresenius Environmental Bulletin
Above mentioned methodology of constructing water distribution systems, however, comes with difficulties in the hydraulic design. First of all, the system behaves as a gigantic complexity in which many factors affect the water flowrates in pipes and nodal pressures. Besides, any set of physical properties of a pipe may influence the whole system flowrates and pressures. In addition, it is difficult to predict how the system reacts against an unpredicted change in operational conditions. These highlighted features of looped networks makes the design challenging. In order to predict the system reaction against any conditional change, a series of simulations must be done, which is time-consuming due to complexity. Several approaches have been suggested for the solution of distribution systems including Linear Theory, Hardy-Cross and Gradient Algorithm [2]. Each methodology offers a unique solution. For example, Hardy-Cross algorithm cannot be used for systems with check-valves while Gradient Algorithm is able to handle systems with both check valves and pressure regulating valves [3]. However, all these methodologies require a detailed examination of water distribution system. Besides, these methodologies require great amounts of calculations for the solution of the system, which is time-consuming if hand calculations are employed. Therefore, computer programs are used in hydraulic simulation of looped networks. Wheeler [4] developed a computer program that hydraulically simulates water distribution systems under steady-state conditions. The program employed standard Hardy-Cross method. Khezzar et al. [5] pointed out the numerical difficulties in the solution of water distribution networks in case of pressure-reducing valve inclusion in the system and they suggested a functional approach to the Linear Theory method in their study. They also use a steadystate approach. A computer program has also been developed by US EPA called EPANET [6]. This program uses Gradient Algorithm for both steady-state and time-dependent simulations. Also, WaterCAD™ uses gradient algorithm to hydraulically simulate water distribution systems for both steady-state and time-dependent simulations. WaterCAD™ also uses a code implementing genetic design algorithm to calibrate the system against measured data. Recently, Ozdaglar et al. [7] conducted an optimization-based approach for the design of complex water distribution networks using a code implementing genetic design algorithm. They designed the potable water distribution network of an organized industry region by a computer program, SUGANET, using a code implementing genetic design algorithm. They compared the solution obtained by SUGANET with the solution by another computer program, DOHC, using a different code providing hydraulically steady-state results. The authors concluded that genetic design algorithm solution by SUGANET was found to be 5.3% less costly and showed hydraulically better results. Another optimization-based study was undertaken by Lin et al. [1] for the practical optimal design of pipe network using an enumeration algorithm. They established an opti-
mal model to confirm some design criteria, such as multiple loading and service pressures. The authors have reported that the enumeration theory with practical application is an easy way to satisfy engineering requirements. Many researchers developed computer programs for educational purposes for undergraduate students. Huddleston et al. [8] developed a computer program to aid the undergraduate students concentrate on design issues rather than time-consuming calculation procedures. Lopes [9] defined the computer implementation of Hardy-Cross method in detail. He also developed a computer program for academic purposes. However, his program is able only to make steady-state analyses. In general, several computer programs that have been developed so far, such as EPANET and WaterCADTM, are able to handle steady-state and time-dependent simulations of the water distribution systems. However, as stated earlier, these computer programs employ some complex equation systems for the solution, which imposes the students to use the programs without comprehensive understanding of algorithms inside. The aim of this study is to develop a new algorithm for time-dependent simulations of water distribution systems in order for the students to understand basic iterative approach for the solution. From this standpoint, the goal of the study is to develop a computer program, modified Hardy-Cross, that provides both steady-state and time-dependent simulations. In this study, Hardy-Cross algorithm was modified to include an outer iterational loop for the time variable. THEORETICAL BACKGROUND Hydraulics
The well-known Darcy-Weisbach formula for the calculation of frictional headloss in a full-flow pipe is given by the following expression: hL =
fL V 2 D 2g
(1)
where hL is pipe headloss in m, f is the friction factor (dimensionless), L is the pipe length in m, D is internal pipe diameter in m, g is gravitational acceleration in m/s², and V is flow velocity in m/s. The friction factor, f , depends on Reynolds number and is calculated using Jain equation explicitly [10] or Colebrook-White equation both implicitly and explicitly [11, 12]:
1046
k 2.51 = −2 Log + 3.7 D R f f e
1
k 5.74 + 0.9 f = 1.325 Ln 3.7 D Re
(2)
−2
(3)
© by PSP Volume 17 – No 8a. 2008
Fresenius Environmental Bulletin
where Re is Reynolds number and calculated by the following formula: Re =
VD
(4)
υ
Here, υ is the kinematic viscosity of water in m²/s and the others as defined previously. Another formulation that can be utilized to compute frictional headlosses is the well-known Hazen-Williams formula. (5)
V = 0.85CHW RH0.63 S 0.54
where CHW is Hazen-Williams coefficient (dimensionless), RH is hydraulic radius (m) and S is the slope of hydraulic gradient line (m/m), which equals the ratio of headloss to path length. The loss of head due to fittings and other minor loss elements can be calculated by using the following expression: V2 hL = K 2g
Compute frictional and, if any, minor headlosses through all of the pipes.
Steady-State Hardy-Cross methodology
Hardy-Cross method offers a steady-state solution of the water distribution network at any given instant and any set of given nodal demands. The method is an iterative one involving the following calculation procedure: Compose the pipe loops, give a number to each, and determine a base direction for loopal headlosses. Positive in clockwise direction and negative in counter-clockwise direction, for example. Assume an initial flowrate for each of the pipes in the network. While doing so, obey the mass balance principles around the junction points: (7)
i = 1,2,.... P
(8)
hL ,i = R1Qin1 + R2Qin2
where R1, R2 are resistance factors and n1, n2 are flowrate power coefficients for the ith pipe. The values of resistance factors and power coefficients can be calculated as shown in Table 1. In Table 1, i is pipe index, j is minor loss element index and n is number of minor loss elements in the ith pipe. Calculate loopal headlosses and loopal flowrate correction parameters. Pay attention to the signs of headlosses while doing so. The following expression describes how the loopal headlosses can be computed: PL
TOT (hL )i = ∑ hL , j
(6)
where K is the minor loss coefficient for the fitting or other element of interest.
Qi = Q0 ,i
where Qi is the flowrate in the ith pipe, Q0 ,i is the initial assumption of flowrate in the ith pipe and P is the number of pipes. Pay attention to the direction of flows with respect to the loopal base direction.
i = 1,2,....L
(9)
j =1
Here, TOT (hL )i is the loopal headloss of the ith loop and PL is the number of pipes that is included in the ith loop’s definition, hL , j is the headloss through the jth pipe associated with the ith loop and L is the number of loops in the system. The loopal flowrate correction parameters are then calculated using expression: ∆Qi = −
where
TOT (hL )i hL , j m∑ j Qj PL
(10)
i = 1,2,....L
Q j is the directional flowrate of the jth pipe
associated with the ith loop. Here, m equals 2 for use with Darcy-Weisbach friction method and 1.85 for use with Hazen-Williams friction method. Note that in case of Hazen-Williams formula being used, although minor losses are still directly proportional to the square of flow velocity, the value of m is taken as 1.85 neglecting minor losses when calculating flowrate changes.
TABLE 1 – Calculation of pipe resistance factors and power coefficients. Friction Method Darcy-Weisbach
Hazen-Williams
Manning*
R1 n 8 f i Li + ∑ K i, j 2 4 gπ Di Di j =1 (10.6331) Li
( CHW )i
1.85
4.87 i
D
10.29ni2 Li 0.083 n + ∑ Ki, j Di5.33 Di4 j =1
n1
R2
n2
2
0
0
1.85
0.083 n ∑ Ki, j Di4 j =1
2
2
0
0
*Although Manning’s equation is mostly used for surface flows, it is sometimes allowed for the use for pipe flows.
1047
© by PSP Volume 17 – No 8a. 2008
Fresenius Environmental Bulletin
READ Physical state of system Q0,i and q0,i
READ Physical state of system Q0,i,Avg and q0,i,Avg Demand curve
(a)
(b)
t = tSTART
ASSIGN
t=t+ t
New Qi = Q0,i
ASSIGN t
COMPUTE
ASSIGN
hL,i, TOT(hL,L)i and
Qi
New Qi = Qi ±
ASSIGN Qi
New Qi,t = MtQ0,i,Avg
COMPUTE DECIDE Qi < > Itr < > Max Itr
ASSIGN
hL,i, TOT(hL,L)i,t and
Qi >
Qi,t
New Qi,t = Qi,t ±
Itr > Max Itr Qi
Itr < > Max Itr
ASSIGN New Qi = Qi ±
Qi
Qi,t >
Itr > Max Itr Qi,t
tEND
t > tEND
END
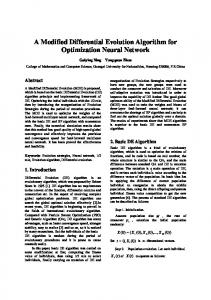
TIME-DEPENDENT SIMULATION FIGURE 1 – Flowcharts for computer program (a) steady-state analysis, (b) time-dependent simulation.
1048
Qi,t
© by PSP Volume 17 – No 8a. 2008
Fresenius Environmental Bulletin
Depending on user’s selection of criterion to stop iterations, if each of loopal headlosses is smaller than a predefined headloss sensitivity value or each of flowrate correction parameters is smaller than a predefined flowrate sensitivity value, then assign the last-found values to the flowrates of pipes and leave the iterations. Else, use the flowrate correction parameter to calculate new flowrates of the pipes and return to step 3 with the new flowrates at hand. Modified Hardy-Cross methodology
The above mentioned methodology offers a steadystate solution for a water distribution network. However, the design engineers as well as undergraduate and graduate students need to know how the system behaves when the nodal demands change in a daily basis. This requires a time-dependent simulation of the system. A time-dependent simulation is a set of results from a number of steady-state analyses each of which represents a single solution of the system at a given instant, t. The difficulty here is to obtain nodal demands and initial assumptions for pipe flowrates at time, t. This difficulty is overcome by the use of a daily water demand curve as in EPANET [6]. The demand curve is expressed as the ratio of water demand, QTOT,t, at time, t, to average daily water demand of the system, QTOT,Avg, The nodal demands throughout the distribution system tend to change in the same trend with total demand of the system. The ratio is defined mathematically as follows: Mt =
q i ,t q i , Avg
=
QTOT ,t QTOT , Avg
=
Q0 , j , t
i = 1,2,.... N
Q0 , j , Avg
j = 1,2,....P
(11)
where M t is the multiplier – nodal demand correction factor – at time, t, N is the number of nodes throughout the system, q i , t is water demand of the ith node at time, t,
analyses. Steady-state analysis involved the application of iterative Hardy-Cross Method while modified Hardy-Cross Method for time-dependent simulations were obtained by the implementation of some outer loop for time variable. Fig. 1(a) and Fig. 1(b) show the flowcharts for steady-state and time-dependent analyses, respectively. The computer program essentially is composed of two basic parts. One is the functional implementation of the standard and modified Hardy-Cross algorithms. The other part is the flow-control and the user interface. The computer program developed is able to perform both steadystate and time-dependent simulations. The computer program allows the user to decide whether steady-state analysis or time-dependent simulation is to be done. The user is allowed to select between Darcy-Weisbach and HazenWilliams equations as the friction method. Both Jain and Colebrook-White equations for the calculation of friction factor are included in the program. The program is also able to compute minor losses throughout the system. The simulations are controlled by user-defined criteria. The user can define a maximum pipe flow change for the iterations to be stopped. In this case, the iterations are stopped when all of pipe flow changes in the network are reduced to that user-defined value. The program also lets the user to define a maximum loopal headloss value as a criterion to end the iterations. The program, in this case, calculates loopal headlosses in each iteration. When all of the calculated values are less than the user-defined value in any iteration, it ends the iterations and lists the results. As a worst-case precaution, the user is encouraged to identify a maximum number of iterations. If the program cannot find any proper set of solutions, the iterations continue to that pre-defined value for the number of maximum iterations.
qi , Avg is daily average water demand of the ith node, Q0 , j ,t is the initial assumption of flowrate of the jth pipe at time, t, and Q0 , j , Avg is initial assumption of daily average flowrate of the jth pipe. Although it is not dealt with here, this approach is also applicable for water demand fluctuations on a yearly basis. In the modified algorithm, the system is hydraulically solved at the beginning. From that point, the system is repeatedly solved for each hydraulic time step within the given interval by calculating and updating nodal demands via the demand multiplier, Mt, defined by the user. Finally, the time-dependent simulation can be obtained by collecting steady-state results within the given time interval at a desired time step, together. DEVELOPMENT OF COMPUTER PROGRAM MS Excel™ macros were used to implement iterative Hardy-Cross Method for steady-state and time-dependent
RESULTS The newly developed algorithm was tested for an example distribution system of 21 pipes, 15 nodes and seven loops. The layout of the example system is shown in Fig. 2. The water temperature was assumed to be 20 °C where the density, dynamic viscosity and kinematic viscosity are 998.2 kg/m³, 1.005 * 10-³ kg/m.sec and 1.007 * 10-6 m²/sec, respectively. Daily average nodal demands for 15 nodes are summarized in Table 2. All of the pipe materials were assumed to be PVC with k = 0.12192 mm and CHW = 150. Pipe definitions and initial assumptions for daily average pipe flows are summarized in Table 3. The computer program was run for both steady-state and time-dependent analyses using both “Loopal Headloss” and “Flowrate Change” criteria separately as ∆Q = 0.0001 L/sec and ∆hL = 0.0001 m, respectively. A total of four sets of analyses were run. Darcy-Weisbach friction method was utilized in all analyses. In steady-state analysis, two sets of analyses were conducted. In the first set, minor losses were neglected
1049
© by PSP Volume 17 – No 8a. 2008
Fresenius Environmental Bulletin
14.5
13.5
15.5
8
16.5
Müh ürd
Rız
17.5 aP
ar Str
aşa
St r eet
18.5 19.5
Residental
21.5
19.5
eet
22.5
Institutional
20.5
9 Ciha
Bey S treet
Industrial
10 G
Yaver
n Str eet
7
ürb üz T
Mühürdar
15
ürk S
Primary School
11
tr.
Street
14
Gündoğd u
tr.
tree t
yS
ikir S
Str. 13
Gürb üz T ürk S tr.
Yav er B e
6 Yen iF
Commercial
23.5 24.5
5
13.5
25.5 Günd oğdu Stree t
12
26.5
Günd oğdu S
27.5
treet
1
4
14.5 15.5
16.5 17.5
3 18.5 19.5 20.5 21.5
Yeni
Fikir Str
eet
27.5
2
22.5 23.5 24.5
26.5
25.5
FIGURE 2 – Example water distribution system.
TABLE 2 – Average daily and max daily nodal demands. Node 1 2 3 4 5
Avg. Daily Demand, L/sec 3.96 5.57 6.25 5.60 5.95
Max. Daily Demand, L/sec 7.08 9.97 11.18 10.02 10.65
Node 6 7 8 9 10
Avg. Daily Demand, L/sec 7.58 9.91 10.87 12.97 6.58
Max. Daily Demand, L/sec 13.57 17.74 19.45 23.22 11.78
Node 11 12 13 14 15
Avg. Daily Demand, L/sec 2.81 5.83 5.71 6.29 2.56
Max. Daily Demand, L/sec 5.03 10.44 10.22 11.26 4.59
TABLE 3 – Pipe definitions and initial pipe flow assumptions for example system. Pipe No 1 2 3 4 5 6 7 8 9 10 11 12 13 14 15 16 17 18 19 20 21
From Node to Node 1 to 2 2 to 3 3 to 4 4 to 5 5 to 6 6 to 7 7 to 8 8 to 9 9 to 10 10 to 11 11 to 12 1 to 12 3 to 12 12 to 13 10 to 13 4 to 13 13 to 14 14 to 15 9 to 15 7 to 15 5 to 14
LOOPS Primary
Secondary
Diameter, mm
Length, m
Avg. Daily Flow, L/sec
Max. Daily Flow, L/sec
1 1 2 5 6 6 7 7 4 3 3 1 1 2 3 2 4 4 4 6 5
None None None None None None None None None None None None 2 3 4 5 5 6 7 7 6
250 250 250 200 200 200 100 100 250 250 250 400 100 250 100 100 200 100 100 100 100
65.5 71.5 50.0 51.0 62.0 69.5 78.0 105.0 62.0 58.0 41.5 69.0 61.5 62.0 59.0 54.5 47.0 30.0 45.5 93.0 47.0
38.62 33.05 32.39 32.38 11.17 3.58 5.29 -5.58 -1.79 -2.78 -5.59 -55.86 -5.59 -38.85 5.59 -5.59 21.96 30.94 16.76 -11.62 15.26
69.13 59.16 57.98 57.96 19.99 6.41 9.47 -9.99 -3.20 -4.98 -10.01 -99.99 -10.01 -69.54 10.01 -10.01 39.31 55.38 30.00 -20.80 27.32
1050
© by PSP Volume 17 – No 8a. 2008
Fresenius Environmental Bulletin
TABLE 4 – The results of steady-state analysis with and without minor loss elements. Analysis Results, L/sec With minor loss elements Without minor loss elements Modified Hardy-Cross Modified Hardy-Cross EPANET Results EPANET Results Results* Results* 56.02 56.02 54.40 54.40 46.05 46.05 44.43 44.43 40.89 40.89 39.77 39.77 36.72 36.72 35.72 35.72 33.86 33.86 33.00 33.00 20.28 20.28 19.42 19.42 9.05 9.05 8.71 8.71 -10.41 -10.41 -10.75 -10.75 -37.67 -37.67 -38.14 -38.14 -45.89 -45.89 -45.27 -45.27 -50.92 -50.92 -50.30 -50.30 -113.01 -113.01 -114.63 -114.63 -6.04 -6.04 -6.53 -6.53 -45.72 -45.72 -47.76 -47.76 3.57 3.57 4.66 4.66 -5.86 -5.86 -5.98 -5.98 26.08 26.08 26.61 26.61 7.04 7.04 7.43 7.43 -4.05 -4.05 -4.18 -4.18 -6.51 -6.51 -7.03 -7.03 -7.79 -7.79 -7.93 -7.93
Pipe From Node to Node 1 to 2 2 to 3 3 to 4 4 to 5 5 to 6 6 to 7 7 to 8 8 to 9 9 to 10 10 to 11 11 to 12 1 to 12 3 to 12 12 to 13 10 to 13 4 to 13 13 to 14 14 to 15 9 to 15 7 to 15 5 to 14
No 1 2 3 4 5 6 7 8 9 10 11 12 13 14 15 16 17 18 19 20 21
* Although Darcy-Weisbach, Hazen-Williams and Manning’s equations are included in the computer program, only Darcy-Weisbach solutions are presented.
2.0 1.8 1.6 1.4 M(t)
1.2 1.0 0.8 0.6 0.4 0.2 0.0 0
2
4
6
8
10 12 14 16 18 20 22 24 Time (hour)
FIGURE 3 Daily water demand fluctuation for example system.
14
14
13 12
(b)
12
11
11
10
10
Pipe flow (L/sec)
Pipe flow (L/sec)
13
(a)
9 8 7 6 5
9 8 7 6 5
4
4
3
3
2
2
Without minor losses
1
With minor losses
1
0
0 0
2
4
6
8
10
12
14
16
18
20
22
24
0
2
4
6
8
10
12
14
16
18
20
22
24
Time (hour)
Time (hour)
FIGURE 4 – Change of flow in pipe 18 with respect to time (a) without minor losses (b) with minor losses.
1051
© by PSP Volume 17 – No 8a. 2008
Fresenius Environmental Bulletin
throughout the system and the data assumed so far was applied to the computer program to obtain the results in Table 4. For test purposes, the system was also solved using EPANET, algorithm of which is given in detail by Rossman [6], and the analysis results from EPANET are also shown in Table 4. In the other set of analysis, the sum of minor loss coefficients for each pipe was assumed to be four. The system with minor loss elements was also solved using EPANET. Table 4 summarizes the results obtained when minor loss elements are not negligible, too. The results from the computer program utilizing modified Hardy-Cross algorithm and EPANET showed no difference at all (down to one tenthousandth). The only difference was the time required. Although EPANET converges to a solution in a much shorter period of time (approximately 10 times faster), the newly developed computer program was able to solve the system in a very short period, too.
Cross algorithm, on the other hand, employs basic iterative approach of original method, which leads the students to understand the fundamentals of iterative procedure. In contrast, EPANET takes less time to complete calculations while modified Hardy-Cross algorithm takes more time. However, this long calculation times for modified HardyCross algorithm may be neglected in the aspect of student applications. For example, EPANET solved the example water distribution system in 5 seconds (calculation times change depending on computer configuration) while modified Hardy-Cross algorithm took approximately one minute to complete calculations.
Daily water demand fluctuation pattern shown in Fig. 3 was utilized in time-dependent simulation. Two sets of analyses were conducted in time-dependent simulation, too. In the first set, minor loss elements were neglected while the sum of minor loss coefficients for each of pipe was assumed to be four in the second. To prevent data conflict, data for only one randomly selected pipe (pipe 18) from the modified Hardy-Cross algorithm and EPANET were collected on a time basis and plotted. Fig. 4(a) shows the daily variation of flowrate when no minor loss elements are included in the simulations. The results of simulations with minor loss elements are shown in Fig. 4(b). It is obvious from Fig. 4.a and 4.b that minor loss elements of 4 on total causes negligible difference in pipe flows. The flowrate of pipes does not change necessarily. Comparing Figs. 3 and 4, we can easily see that pipe flows in the distribution system changes in accordance with the water demand fluctuations.
REFERENCES [1]
Lin, B.L., Shau, H.M., Huang, W.C., Wu, R.S. and Liaw, S.L. (2004) The enumeration algorithm for the practical optimal design of pipe network systems. Environmental Informatics Archives, 2, 87–98.
[2]
Todini, E. and Pilati, S. (1988) A gradient algorithm for the analysis of pipe networks. Computer applications in water supply. Wiley: Research Studies Press, 1–20.
[3]
Salgado, R., Todini, E. and O'Connell, P.E. (1988) Extending the gradient method to include pressure regulating valves in pipe networks. Proceedings of the International Symposium on Computer Modeling of Water Distribution Systems, University of Kentucky, May 12–13, 1988.
[4]
Wheeler, W. (1977) Hardy-cross distribution analysis. Water Sewage Works, 124, 130–133.
[5]
Khezzar, L., Harous, S. and Benayoune, M. (2001) Steadystate analysis of water distribution networks including pressure-reducing valves. Computer-Aided Civil and Infrastructure Engineering, 16, 259–267.
[6]
Rossman, L.A. (2000) EPANET users manual. National Risk Management Research Laboratory, US Environmental Protection Agency, Cincinnati, Ohio, 192 p.
[7]
Ozdaglar, D., Benzeden, E. and Kahraman, A.M. (2006) Optimization of complex water distribution networks using genetic algorithm. Insaat Muhendisleri Odasi Teknik Dergi, 253, 3851–3867 (In Turkish).
[8]
Huddleston, D.H., Alarcon, V.J. and Chen, W. (2004) A spreadsheet replacement for Hardy-Cross piping System analysis in undergraduate hydraulics. Proceedings of the 2004 World Water and Environmetal Resources Congress, 3108–3115.
[9]
Lopes, A.M.G. (2004) Implementation of the Hardy-Cross method for the solution of piping networks. Computer Applications in Engineering Education, 12, 117–125.
CONCLUSIONS A modification to the standard Hardy-Cross method was carried out in this study. The newly developed algorithm is able to perform both steady-state and time-dependent simulations of water distribution systems. A computer program was also developed. Both of two solution algorithms were implemented in MS Excel Macros enabling the user to select between steady-state and time-dependent simulations. The validity of the new method was tested for an example system of 21 pipes against EPANET. The new program and EPANET showed no difference at all. EPANET uses gradient algorithm, which handles too complex equation systems to solve by hand calculations. The students need a very good mathematical background to solve those complex equation systems. Modified Hardy-
1052
[10] Bober, W. (1984) Use of the Jain Formula in the pipe network problems. Journal of Pipelines, 4, 315–317. [11] Bober, W. and Robinson, J. A. (1983) Colebrook equation utilized in the Hardy-Cross method. Journal of Pipelines, 3, 173–177.
© by PSP Volume 17 – No 8a. 2008
Fresenius Environmental Bulletin
[12] Ngiam, A.P.C. and White, A.S. (1985) Comparison of several computation methods for pipe networks. International Journal of Mechanical Engineering Education, 3, 259–271.
Received: January 28, 2008 Revised: April 07, 2008 Accepted: May 20, 2008
CORRESPONDING AUTHOR Selami Demir Faculty of Civil Engineering Department of Environmental Engineering Yildiz Technical University 34349 Yildiz, Besiktas, Istanbul TURKEY Phone: +90 212 383 30 35 Fax: +90 212 261 90 41 E-mail:
[email protected] FEB/ Vol 17/ No 8a/ 2008 – pages 1045 - 1053
1053