Application to Southern California. Ralph E. Morris. Thomas C. Myers. Sharon G. Douglas. Mark A. Yocke. Systems Applications International. 101 Lucas Valley ...
Development of a Nested-Grid Urban Airshed Model and Application to Southern California
Ralph E. Morris Thomas C. Myers Sharon G. Douglas Mark A. Yocke Systems Applications International 101 Lucas Valley Road San Rafael, California 94903 (415) 507-7100 and Vince Miabella Southern California Edison Company 2244 Walnut Grove Avenue Rosemead, California 91770
Paper presented at the 84th Annual Meeting and Exhibition of the Air and Waster Management Association Vancouver, B.C.. Canada 16-21 June 1991
The job of reducing ozone concentrations to levels below the National Ambient Air Quality Standard (h'AAQS) has proven far more difficult than was thought when the original Clean Air Act was passed and amended. Apparently, the level of ozone precursor emissions remains too high; emission reductions have been too small, have been offset by emissions growth, or have been required of the wrong sources, or some combinations of all of these. A plethora of technical explanations have been offered for the failure to attain the ozone NAAQS including: weaknesses in the attainment planning process; incomplete understanding or recognition of the factors that cause elevated tropospheric ozone concentrations; the failure to consider the effects of natural emissions; use of overly simplistic modeling approaches; and failure to reduce the amount of emissions intended, either through overestimates of the effectiveness of control technology or failure to account for certain categories of emission sources. The EPA recommends that states use the Urban Airshed Model (UAM), a photochemical grid model, for the modeling of ozone and photochemically reactive pollutants in urban areas.' An alternative approach, the Empirical Kinetics Modeling Approach (EKMA), based on a photochemical box model, has been accepted for demonstrating attainment of the ozone standard in most State Implementation Plans (SIPS).= It is generally believed that the grid modeling approach (UAM) provides better representation of the physical process that lead to elevated ozone concentrations than the trajectory modeling approach (EKMA).) The Clean Air Act Amendments of 1990 have stipulated that those areas with the most severe ozone problems must use a photochemical grid model (the UAM) to demonstrate attainment of the ozone NAAQS. To meet this need the EPA sponsored a study to demonstrate the application of the UAM to five ~ities.'~.".~.~The EPA also has released the latest version of the UAM with updated documentationloand is currently formulating guidance on using the UAM in future SIPS." The EPA UAM is similar to the version of the UAM released in the late 1970s with the exception of an update to the Carbon Bond chemical mechanismlz and use of a new advection/diffusion algorithm." The computer code for the EPA UAM is some vhat dated, designed to run on old style computing hardware with limited available memory. In addition, the EPA UAM vertical layer structure (tied to the mixing height) makes it difficult to adapt output from current state-of-the-art prognostic meteorological models for use as input into the UAM. Furthermore, the fixed-grid formulation of the EPA UAM limits its application to a mesoscale region, which introduces uncertainties due to the difficulty in defming correct boundary conditions. Thus Systems Applications International embarked on a research and development effort to update the EPA UAM including the addition of nested-grid capabilities.
APPROACH The UAM was refined and enhanced through the update of the computer code and inclusion of the new capabilities, algorithms, modules, and features. The new UAM-V has the following additional features over the EPA UAM:
1.
Stmctured modular comouter code: The UAM-V computer code has been rewritten to be more modular for ease of inclusion of new modules and to take advantage of modem computers.
2.
Vertical grid structure: The vertical layer sfrumre in the UAM-V can be arbitrarily defined by the user and is no longer defined from the diffusion break (mixing height). This allows for higher-resolution vertical layers near the surface and better matching with terrain-output from prognostic meteorological models, which usually use a terrainfollowing coordinate system.
3.
Threedimensional inou$: Several meteorological variables that were considered spatially constant in the EPA UAM (i.e., in the METSCALARS input file) now vary temporally and spatially (e.g., temperature, water vapor, pressure, and photolysis rates). Furthermore, the horizontal diffusivities and vertical turbulent exchange coefficients are now required as input, usually calculated from a prognostic meteorological model.
4.
Variable-mid resolution for chemical kinetic calculations: A chemical aggregation scheme has been implemented in the UAM-V; the chemistry calculations can be performed on a variable grid while the advectioddiffusion and emissions injections are performed on a futed grid.
5.
Two-wav nested eriq: A fine grid can be imbedded in a coarser grid for more detailed representation of advectioddiffusion, chemistry, and emissions. Several levels of nesting can be accommodated.
6.
Yodate of the CB-IV chemical mechanism: The Carbon Bond IV chemical mechanism has been updated. The X0,-RO, reaction has been added along with new temperature effects for the PAN reaction. In addition, aqueous-phase chemistry has been added as an option.
7.
New drv de~ositionaleorithm: The dry deposition algorithm formulated by Wesely" has been implemented in the UAM-V. This algor;+hm is similar to that used by the Regional Acid Deposition Model (RADM)
8.
Advanced roen nos tic meteoroloeical model: A new advanced prognostic meteorological model was developed to support the application of the UAM-V to regional or urban domains. The prognostic model incorporates the latest data assimilation, solution "nudging", and objective combination methods to obtain physically realistic three-dimensional metearological fields for input into the UAM-V.
The UAM-V was tested to insure computational stability, numerical accuracy, and mass consistency. The nested-grid capability was first tested in a simulation of a regional ozone episode with a modeling domain of 500 x 500 km. The UAM-V was then applied to an ozone episode in the South Central Coast Air Basin (SCCAB) region of California. Results from the UAM-V were compared to those from the EPA UAM.I5 The new ozone prognostic meteorological model was applied and tested for a regional ozone episode covering the entire southern California coastal region (from Santa Barbara to San Diego).
The UAM-V will be applied to southern California using data calculated by the prognostic model and nested fine grids to simulate air quality in the urban areas of Los Angeles, San Diego, and Ventura counties.
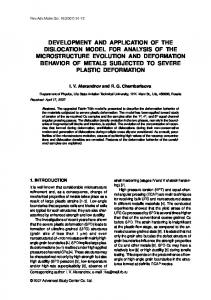
'Ibe initial testing of the two-way nested grid in the UAM-V was a 10-ten hour (0800 to 1800 on 18 January 1990) simulation of SQ emissions (considered inert) from a single stack located near the center of a modeling domain in the southwestern U.S. The modeling grid consisted of a 50 by 50 array of 10 km grid cells and 8 vertical layers whose heights remained fixed in time and varied only slightly spatially. The height of the top of the lowest layer was 60 meters AGL, while the region top (i.e., height of the top of the eighth layer) was 2,400 meters AGL. As shown in Figure 1, a single nested grid of a 60 by 60 array of 3 113 km grid cells was defmed surrounding the SO2 emission source. The instantaneous SO2 concentrations from the (10 km) the nested, UAM-V, fixed grid UAM-V simulation, and the 10 km UAM-V and 3 113 km grid results from the nested-grid UM-V simulation are given in Figure 2 (note that the maximum values displayed in these figures are always from the 10 km grid). The results are consistent with expectations of the effect of adding the fine grid to the simulation: the effect of a finer grid results in a narrower plume near the source. The peak SO2concentration in the 10 km nested grid increases to 7.5 ppb compared to 4.8 ppb in the fixed 10 km grid. On the 3 113 km nested grid the peak S Q concentration is in excess of 9 ppb. Mass consistency was verified for the 10-hour simulation: total (inert) S Q mass varied by less than one percent. Photochemical simulations were conducted with the same grid systems and emissions from both area and point sources. The results of these simulations were also consistent with our expectations; the fine-grid UAM-V simulation produced higher concentrations of the emitted ~pecies.'~
INITIAL APPLICATION TO THE SOUTH CENTRAL C O m AIR BASIN REGION O F CALIFORNIA Although the UAM-V contains many of the same basic components as the EPA UAM (e.g., CB-IV chemistry and the Smolarkiewicz advectionldiffusion algorithm) the computer code itself has undergone significant restructuring to make it more modular, and thus more flexible, to update it to current programming practices, and to make it easier to take advantage of the current generation of computers. Thus, an important test of the UAM-V is to compare its results with those obtained from the EPA UAM actually. This comparison was made using an historical UAM episode from the South Central Coast Air Basin (SCCAB).16 Inputs for the EPA UAM application to the SCCAB ozone episode of 5-7 September 1984 were used as inputs to the UAM-V. Although the UAM-V has a more flexible grid structure than the EPA UAM, it was configured with the same horizontal grid (an array of 53 by 24 four km grid cells) and vertical grid (two layers below and two above the diffusion break). Horizontal diffusivities and vertical turbulent exchange coefficients required as input for the UAM-V were generated using the algorithms from the EPA UAM. Also, in order to limit the differences between the UAM-V and
EPA UAM, the same chemistry (original CB-N) was used and dry deposition was turned off in both of the models. The resulting hourly ozone concentrations produced by the EPA UAM and UAM-V are shown in a time series in Figure 3. These results indicate that, in general, given the same inputs and grid structure the EPA UAM and UAM-V give similar results.
Effects of Grid Nesting The next test of the UAM-V was to determine the effects of nested grids on predicted concentrations. A fine grid consisting of an array of 20 by 20 2 km cells that covered most of the Ventura-Oxnard plain was included in the UAM-V grid definition as shown in Figure 4. Results from the 2 km fine grid are similar to those from the 4 km grid were higher; although concentrations of primary emitted species on the finer grid were higher. Further Testing in the SCCAB region Further tests of features of the nested-grid UAM in the SCCAB region are envisioned as follows: Drv Deoosition: The EPA UAM and UAM-V will both be run with dry deposition turned on. New Chemistry: The UAM-V will be exercised using the updated CB-IV chemistry. Vertical Laver Structure: The nested-grid will be mn with a new vertical layer structure. APPLICATION TO SOUTHERN CALIFORNIA The new California Clean Aii Act (CCAA) has identified interbasin transport of pollutants as an issue that must be addressed in future Air Quality Management Plans (AQMPs). In particular, the transport of pollutants from the Los Angeles Basin to the San Diego and Ventura regions probably needs to be addressed. The UAM-V offers a new technical tool that can address these long-range transport issues yet still retain the finer-scale predictive capability of the EPA UAM in the urban areas. However, the predictive capability of any air quality simulation model is limited to the quality of the input data utilized: the meteorological, emissions and air quality input data in particular. Thus, as part of the development of the UAM-V, a prognostic meteorological model was developed that incorporates the latest data assimilation techniques. Preparation of Meteorological Fields for Nested-Grid UAM Modeling of Southern California The UAM-V requires more extensive meteorological inputs than the EPA UAM, including threedimensional fields of temperature, water vapor concentrations, pressure, horizontal diffusivities, and vertical turbulent exchange coefficients. To meet this need for accurate, physically realistic meteorological fields, a meteorological modeling approach based on the combination of a prognostic meteorological model and observations was develoved. The vromostic model is the Svstems ~ ~ ~ l i c a t iInternational oki version of the colorado State University Mesoscale Model ~ S U M M ) . " The CSUMM was improved to include two methods of data assimilation: (1) dynamic initialization
- -
@I) to obtain physically realistic, dynamically balanced fields of meteorological variables that match the observations at the start of the prognostic model simulation; and (2) objective combination (OC), which involves the incorporation of meteorological observations into results of the prognostic model after running the model. This approach is illustrated schematically in Figure 5.
UAM-VApplication to Southern California Using meteorological fields generated by the modified CSUMM, the UAM-V will be applied to southern California for an ozone episode of 25-28 August 1987. Figure 5 illustrates a proposed grid strumre for the nested grid application of the UAM-V to southern California; grid spacing varies from 2.5 to 10 km.
LOWER LAKE MICHIGAN OZONE STUDY The UAM-V is also undergoing further development, testing, evaluation, and application to ozone episodes in the Lower Lake Michigan region of Illinois, Wisconsin, Indiana, and Michigan as part of the Lake Michigan Ozone Study (LMOS). The LMOS will conduct a massive monitoring program during the summer of 1991 to collect meteorological and air quality data to be used as inputs for UAM-V. In the mean time, the UAM-V is being applied using data from an ozone episode that occurred during July 1987. Meteorological inputs for nested-grid simulation of the 1987 and 1991 ozone episodes will be generated using the Colorado State University (CSU) Advanced Regional Atmospheric Modeling System (ARAMS). Figure 6 displays a proposed modeling grid to be used by the UAM-V for the modeling of the July 1987 ozone episode. CONCLUSIONS The new UAM-V offers a unique tool to consistently analyze linked regional and urban-scale air aualiw issues and urovides more detailed rwresentation of dense emission regions. Initial tests ibdicaie that it can-be operated in a fashion to produce results similar to thoseof the EPA UAM. Current applica,:ons to the southwestern U.S., southern California, and Lower Lake Michigan region are providing an extensive initial data base for model testing and evaluation. The modular construction of the model also makes it a perfect vehicle for the continued development of air quality simulation models. REFERENCES
1. "Guidelines on Air Quality Model (Revised)," U.S. Environmental Protection Agency, 1986 @PA-450/2-78-027R). 2. Federal Register, "State Implementation Plans; Approval of Post-1987 Ozone and Carbon ir Quality Standards; Monoxide Plan Revisions for Areas not Attainiig the National Ambient A Notice," Vol. 52, No. 226 (November 24, 1987).
3. 1. H. Seinfeld, Ozone air quality models. A critical Review, J. Air Pollut. Control A s s o ~ , 38(8):1136-1137 (1988).
4. R. Scheffe, 'Summary of the EPA Five Cities Urban Aiished Model Study", U.S. Environmental Protection Agency, 1990 (EPA-45014--A).
5. R. E. Morris. T. C. Myers, E. L. Carr, and M. C. Causley, "Urban Aiished Model of Five Cities Demonstration of the Low-Cost Application of the Model to the City of Atlanta and the Dallas-Fort Worth Metroplex Region." 1990, U.S. Environmental Protection Agency, (EPA-45014-
-
1-
-
-
6. R. E. Morris, T. C. Myers, and E. L. Cam, "Urban Aiished Model Study of Five Cities Evaluation of the Base Case Model Performance for the Cities of St. Louis and Philadelphia Using Rich and Sparse Meteorological Inputs," 1990, U.S. Environmental Protection Agency (EPA-4501490-006C). 7. R, E. Morris, T. C. Myers, M. C. Causley, L. A. Gardner, and E. L. Carr, "Urban Airshed Model Study of Five Cities Low-Cost Application of the Model to Atlanta and Evaluation of the Effects of Biogenic Emissions on Emission Control Strategies." 1990, U.S. Environmental Protection Agency (EPA-45014-90406D).
-
8. R. E. Morris, T. C. Myers, H. Hogo. L. R. C h i , L. Gardner, and R. G. Johnson, "A LowCost Application of the Urban Airshed Model to the New York Metropolitan Area and the City of St. Louis," U.S. Environmental Protection Agency, 1990 (EPA-45014-90-006E). 9. R. E. Morris, M. C. Causley, J. L. Fieber, L. Gardner, and T. C. Myers, "Urban Airshed Model Study of Five Cities Low-Cost Application of the Model to Future-Year SIP Control and Alternative Fuel Strategies for Dallas-Fort Worth, Atlanta, Philadelphia, and St. Louis," U.S. Environmental Protection Agency, 1990 (EPA-45014-90-006F).
-
10. "User's Guide for the Urban Airshed Model," 5 vols., U.S. Environmental Protection Agency, 1990 (EPA-45014-90-007).
11. "Guideline for Regulatory Application of the Urban Airshed Model", November 1990. U.S. Environmental Protection Agency, Research Triangle Park, North Carolina. 12. M. W. Gery, G. Z. Whitten, and J. P. Killus 1988. "Development and Testing of the CBM-IV for Urban and Regional Modeling," 1988, Systems Applications, Inc., San Rafael, California (SYSAPP-881002). 13. P. K. Smolarkiewicz, A simple positive definite advection scheme with small implicit diffusion. Monthlv Weather Review, 111:479-486 (1983). 14. M. L. Wesely, Parameterization of surface resistances to gaseous dry deposition in regionalscale numerical models, Atmos. Environ., 23(6):1293-1304 (1989).
15. T. C. Myers, S. G. Douglas, R. E. Morris, A. S. Rosenbaum, and M. A. Yocke, "Technical Achievements and Progress on SCE Technical Services Purchase Orders C1030011, C1030010, and C1030915," 1991. Systems Applications International, San Rafael, California.
91-66.8
16. T. C. Myer, "Modeling of the South Central Coast Air Basin with the Carbon Bond nT Version of the Urban Aiished Model," 1990. System Applications International, San Rafael, California, (SYSAPP-90/117). 17. R. C. Kessler, "User's Guide for the System Applications, Inc. Version of the Colorado State University Mesoscale Model," 1989, Systems Applications International, San Rafael, California.
Figure 1. Nested grid structure used for the initial testing of the nested-grid UAM application to the Southwestern U.S. (grid d l sites of 10 and 3 1L3 km are used). Figure 2a. Predicted S Q concentrations for the coarsegrid (10 hn) UAM simulation. Figure 2b. Prediaed S Q wncentrations in the coarse-grid (10 km) for the nested-grid UAM simulation. Figure 2c. Predicted S Q concentrations in the fine grid (3 113 km) for the nested grid UAM simulation. Figure 3. Predicted and observed hourly ozone wncentrations in the South Central Coast Aii Basin for the EPA UAM and nested-grid UAM using the same inputs and with no dry deposition. Figure 4. Nested grid structure for the South Central Coast Air Basin (grid cell sites of (2 and 4 km) are shown). Figure 5. Meteorological modeling domain and nested-grid UAM grid structure for Southern California (grid cell sizes of 10, 5, and 2.5 km are shown). Figure 6. Nested-grid structure proposed for use in the Lake Michigan Ozone Study interim modeling.
NORTH
Figure 1. Nested grid structure used for the i n i t i a l testing of the nestedgrid UAM application to the southwestern U.S. (grid c e l l sizes of 10 and 3 113 irm are used). 10
03 (PPM)*l.OE-3
MAXIMUM IN CELL (17.14)
AT LEVEL 1
= 4.56E1 (PPM)*l.OE-3
Figure 2a. Predicted SO2 concentrations from the coarse-grid (10 h) UAM simulation.
MAXIMUM IN CELL (17.14)
= 4.56E1 (PPM)*l.OE-3
Figure 2b. Predicted SO2 concentrations from the coarse-grid (10 lan) for the nested-grid UAM simulation.
03 (PPM)+l .OE-3 AT LEVEL 1
MAXIMUM IN CELL (17.14)
= 4.56El (PPM)*l .OE-3
Figure 2c. Predicted SO2 concentrations from the f i n e grid ( 3 113 lun) for the nested grid UAM simulation.
91-66.8
hnn ( b u n 1
September 5. I084
September 6. 1084
September 7. 1084
hnn (bow.)
-
Comparison of EPA VAN and the UAM-V r ~ t h o u tdepos~tion
September 5. 1084
September 6, 1084
,,
% " , , , 8 , ~ , 3 , 12 , ~ l , , , I S, , l , , ,P I, ,
-
: I ,
SO I
I
,
Se ~
~
42
September 7. 1984 4LI I
~
.
l
M: l
.
#
W . l
:
l
.
M~
:. ,) , ~, ,~ %
OJN
-
-- 20
:spKp -I .--"A"-"
Comparison of EPA UAM and the VAN-V without deposition
Figure 3. Predicted and observed hourly ozone concentrations in the South Central Coast A i r Basin f o r the EPA UAY and nested-grid UIL"! using t h e same inputs and without dry d e p o s i t i o n .
DOMAIN: (177,4460) 25x29 27KM CELLS Figure 6. Nested-grid s t r u c t u r e proposed f o r interim modeling in t h e Lake Michigan Ozone Study.
Abstract Form Paper number Author's name
91-66.8 Ralph Florri s
Type pow abstract in the box below. 91-66.8
1
Development of a NestedGrid Urban Aiished Model and Application to Southern California, Raloh E,
w,Thomas C. Myers, Sharon G. Douglas, and Mark A. Yocke, Systems ApplicationsIntemational, 101 L u w Valley Road, San Rafael, CA 94903 and Vince Miiabella, Southern California Edison
A new version of the Urban Airshed Model has been developed (UAM-V) that contains several significant updates to the version released in June 1990 @PA UAM). The computer code has been completely restructured and the capability to treat nested and variable grids has been included. Furthermore, the vertical layer definition was restructured so that output from prognostic meteorological models could easily be utilized as inputs. l%e use of nested fine grids in the UAM-V allows it to consistently and cost-effectively treat linked regional and urban-scale ozone problems. The nested-grid capability in the UAM-V was initially tested for an inert simulation for predicting S 4 in the southwestern U.S. The UAM-V was then evaluated for an ozone episode in the Santa Barbara-Ventura region. When the UAM-V grid structure was defined the same as the EPA UAM then the UAM-V produced almost identical results as the EPA UAM. In order to support the application of the UAM-V a new prognostic meteorological modeling methodology was developed incorporat;ug the latest data assimilation techniques. The prognostic meteorological model and UAM-V are then applied to all of the coastal southern California.
Excess Page Charge Form Because my paper exceeds 16 pages (including the title page, text, figures, and tables), I agree to pay an excess page fee to the Air & Waste Management Association. Signed
Date
u
Authors Biographical Information Form
-
91-66.8 Paper number Speakefs(s')name(s) Morris Thomas Myers, Sharon Douglas, &rk Yocke, Vince Mirabella Ralph Morris, ~ ~ ~ h ~name(s) f i ( ~ ' ) Development of a Nested-Grid Urban Airshed Model and Application rnla
Type a short (50 words) paragraph about the primary author andlor the presenter. Include their job title, affiliation, general area of responsibility.You may also wish to mention any noteworthy education, related expenence, professional awards, licenses, committee activities or offices held in the Association. Use extra paper if necessary. Ralph E. Morris i s Manager of t h e Advanced Modeling Group a t Systems Applications I n t e r n a t i o n a l where he i s r e s p o n s i b l e f o r t h e development and a p p l i c a t i o n of a i r q u a l i t y simulation models.
M r . Morris has been one of t h e key p a r t i c i p a n t s i n t h e
d e ~ e l o p ~ e noft t h e Carbon Bond I V v e r s i o n of t h e Urban Airshed Model (EPA UAM), t h e Reactive Plume Model (RPM), and t h e v a r i a b l e g r i d r e g i o n a l oxidant model (RTI-VAP.).
Be has been p r o j e c t manager i n s e v e r a l landmark s t u d i e s including
t h e EPA Five Cities Study and t h e c u r r e n t EPA UAN User's Guide.
Currently he i s analyzing t h e a i r q u a l i t y e f f e c t s of a l t e r n a t i v e f u e l s a s p a r t of t h e Auto/Oil Program, working on t h e development of t h e nested-grid v e r s i o n of t h e UAM, and p a r t i c i p a t i n g i n t h e Lake Kichigan Ozone study.
Request for Audiovisual Equipment Form The following items will be in the meeting room: -Remote carousel slide projector with trays -Manual pointer -Electric pointer -Overhead projector for transparencies Please indicate to the right what equipment you will need to present your paper at the annual meeting.
You m y request these items free of charge:
0Overhead projector with an acetate roll & a pen 0 Flipchart with a pad &marker You will be charged a fee for using the following items (write or phone the Association for prices): 0 Ytinch videocasette player (VCR)and monitor 0 Carousel slide projector with trays and a synchronized sound tape player 0 16mm film projector with sound 0Tape recorderlplayer 0 Blankaudio and video cassette tapes
Abstract The abstract must be shorter than UW)words and must summarize the principal finding that you present in your paper. The abstract should give your readers enough information to determine if they want to read the whole paper and also give editors and librarians enough information to index and retrieve the paper. The abstract should state who should read the paper and why, and should highlight the methods, results, and conclusions you present in the paper. The abstract must be concise and self-contained enough to appear without the rest of the paper.
Type your abstract single-spaced in the box on the back of this page. Do not include it in the bodv of vour =. Do not use small type since your abstract will be reduced by 40%. Do not exceed the limits of the box. At the top of the box, type the title of the paper in upper- and lowercase letters. Follow the title with a comma and then the name of the authors. Underline the name of the speaker. Put a comma after the author and speaker, and then type their affiiition and then their complete mailing address.
Example:
diation of Underground Storage - Facilities, John D. Bogart and James R. Leame, Mo Tec, Inc.. P O. 3&?, Mt. Juliet, TN 37122-0338 storage facilities take many forms. Any breach in the integrity of an underground system leads to biological treatment techniques to remediate sites so contaminated. if treated appropriately. Mo Tec uses enhanced landfarm techof techniques called the slurry hold drying bed process. applied to a wood treatingplant in Tennessee. The major target material to be KM)I by the EPA. The process achieved 98-99% removal efficiency. diminished as 4500 cubic yards were treated in a pilot material was measured.
-
. t
List of Key Words Paper number
97-66.8
Your five key words arr:
Make a list of five key words that categorize your paper. Type the list on the lines below. This l i t will be used to group papers and to index the proceedings.
ozone Urban A i rshed Model -
-
nested a r i d s prognostic meteorological model