Journal of Analytical Toxicology,Vol. 27, March 2003
Development of a Rapid and SensitiveMethod for the Quantitation of Amphetaminesin Human Plasmaand Oral Fluid by LC-MS-MS M. Wood 1,*, G. De Boeck2, N. Samyn 2, M. Morris 1, D.R Cooper 1, R.A.A. Maes 3, and E.A. De Bruijn3 ~Micromass U.K. Limited, Atlas Park, Simonsway, Wythenshawe, Manchester M22 5PP, United Kingdom; 2National Institute of Criminalistics and Criminology (NICC), Section Toxicology, Vilvoordsesteenweg 98, 1120 Brussels, Belgium; and 3Utrecht Institute of Pharmaceutical Sciences (UIPS), Department of Human Toxicology, University of Utrecht, Sorbonnelaan 16, 3584 CA Utrecht, The Netherlands
Abstract Target analysis of amphetamines in biological samples is of great importance for clinical and forensic toxicologists alike. At present, most laboratories analyze such samples by gas chromatography-mass spectrometry. However, this procedure is labor-intensive and time-consuming, particularly as a preliminary extraction and derivatization are usually unavoidable. Here we describe the development of an alternative method. Amphetamines were isolated from human plasma and oral fluid using a simple methanol precipitation step and subsequently analyzed using reversed-phase liquid chromatographytandem mass spectrometry. Quanlitation of lhe drugs was performed using multiple reaction monitoring. The developed method, which requires only 50 pL of biological sample, has a total analysis time of less than 20 rain (including sample preparation) and enables the simultaneous quantitation of 3,4-methylenedioxymethamphetamine, 3,4-methylenedioxyamphetamine, 3,4-methylenedioxyethylamphetamine, amphetamine, methamphetamine, and ephedrine in a single chromatographic run. Limits of detection of 2 pg/L or better were obtained. The method has been validated and subsequently applied to the analysis of plasma and oral fluid samples collected from current drug users.
Introduction + 3,4-Methylenedioxymethamphetamine (MDMA,"Ecstasy", "Adam") and 3,4-methylenedioxethylamphetamine (MDEA, "Eve") are amongst the most frequently abused recreational
9 Author to whom correspondence should be addressed, Michelle Wood, Micromass UK Limited, Arias Park, Simonsway, Wylhenshawe, Manchester M22 5PP, U.K. E-mail:
[email protected]
78
drugs in the Western world. Thus, the analysis of these and other amphetamines in biological samples is of great importance for clinical and forensic toxicologists. Plasma and urine are currently the most common matrices investigated. Although analysis of plasma can provide an estimate of actual circulating concentrations of the analyte of interest, collection of this specimen can be both invasive and inconvenient, requiring trained personnel and special facilities. On the other hand, urine, which provides an accumulative measurement of analyte since the last void of the bladder, is easier to collect. However, there are still some concerns about the invasion of the donor's privacy because urine sample collection is usually supervised in order to reduce the opportunity for sample adulteration. Since the 1970s, there has been a growing interest in the use of oral fluid as an alternative to plasma and urine for purposes of drug monitoring, and it has been increasingly used in pharmacokinetic studies (1) and therapeutic drug monitoring (2). For the detection of illicit drugs, in particular, the use of oral fluid is an attractive possibility because the collection of this non-invasive biological sample is simple, rapid, and requires no special equipment or facilities. Furthermore, the supervision of the collection of this specimen is likely to be more acceptable to the donor rather than urine collection. Several studies report the use of saliva for the detection of illicit drugs (3--6). More recently, particular interest in oral fluid has been expressed by law enforcement agencies for roadside testing of intoxicated drivers (7). Laboratories traditionally use gas chromatography-mass spectrometry (GC-MS) for the confirmation of illicit drug use. However, this is a time-consuming and labor-intensive procedure, particularly because sample preparation, that is, solidphase extraction (SPE) and derivatization, is usually unavoidable. The use of GC-MS for the analysis of oral fluid, in particular, can also lead to other difficulties as frequent users of amphetamines can suffer from a dry mouth due to the sympathomimetic effects of the drugs. In these cases, the amount
Reproduction(photocopying)of editorialcontentof thisjournalis prohibitedwithoutpublisher'spermission.
Journal of Analytical Toxicology, Vol. 27, March 2003
of oral fluid may be limited (typically < 200 pL), which may mean that GC-MSmay not be sufficientlysensitive.In addition, the high viscosityof the oral fluid can lead to problems during the SPE procedure. Recently, liquid chromatography (LC) coupled with atmospheric pressure ionization (API) mass spectrometry has become a widespreadanalytical tool in various fields because it permits the confirmation analysis of polar or non-volatile compounds without the need for derivatization. It may well be the response to the identification and quantitation problems often encountered by analytical toxicologists (8). Some LC-MS (single quadrupole) methods have been reported for the analysis of amphetamines; Bogusz and coworkers (9) described a high-performance liquid chromatography (HPLC)-atmospheric pressure chemical ionization-MS (LC-APCI-MS) method for identification and quantitation of several drugs, including amphetamine and methamphetamine and their methylenedioxyderivatives,but this method requires liquid-liquid extraction followed by derivatization with phenylisothiocyanate. Later, Bogusz et al. (10) described the analysis of underivatized amphetamines and related phenethylamines with LC-APCI-MS,but this particular method still requires a fairly lengthy SPE isolation procedure. Kataoka and co-workers (11) developedan in-tube solid-phase microextraction technique in an attempt to automate the thorough sample preparation that is usually necessaryto achievelow limits of detection when using single quadrupole methods. In comparison to single quadrupole methods, tandem MS (MS-MS) offers superior sensitivity and selectivity for the species of interest. These instruments, when operated in multiple reaction monitoring mode (MRM), enable the quantitation of low levels of compounds in biological matrices, often with much reduced sample preparation and analysis times. Nowadays,stable isotopically labelledanalogues of many of the drugs of interest are readily available. These prove to be valuable tools for the purpose of internal standardization and quantitation. Additionally, because these standards have almost identical physico-chemical properties to the unlabeiled drug, they willcompensate for any effects of reduced sample preparation or ion suppression resulting from the matrix. The method reported here enables the simultaneous quantitation of MDMA, 3,4-methylenedioxyamphetamine (MDA), MDEA, amphetamine, methamphetamine, and ephedrine in plasma or oral fluid. The procedure requires only 50 pL of biological sample in order to achieve limits of detection of 2 pg/L or better and comprises simple and rapid sample preparation (i.e., methanol cleanup) followedby LC--MS-MSanalysis.
with methanol to yield working solutions at appropriate concentrations with which to prepare spiked calibration samples in the various matrices. Deuterated internal standards MDMA-ds,MDA-ds,MDEA-ds, amphetamine-d11, methamphetamine-d14, and ephedrine-d3 were obtained from the same supplier at concentrations of 0.1 g/L in methanol. A mixed internal standard/precipitating solution was prepared by serial dilution with methanol to give a final concentration of 50 pg/L. All these solutions were stored at -20~ and proved to be stable for at least three months. Ammonium acetate was purchased from BDH (Dorset, U.K.). Solvents were HPLC grade from Fluka (Gillingham, U.K.) or Fisher Scientific (Loughborough, U.K.).
Experimental
HPLC
Reagents Individual drug standard ampoules of MDMA,MDA,MDEA, amphetamine, methamphetamine, and ephedrine (at a concentration of 1 g/L in methanol) were purchased from Promochem (Hertfordshire, U.K.).A mixedamphetamine standard solution was prepared (0.1 g/L), which was then further diluted
Samples Plasma used for the preparation of calibrators was obtained from a local blood bank and pre-screened for the absence of drugs using ELISA(Cozart Bioscience,Ltd., Oxfordshire, U.K.). Blood samples taken from living persons suspected of driving under the influence were collected in 7-mL tubes containing sodium fluoride/potassium oxalate and cooled immediately to 4~ Following centrifugation at 4000 x g for 10 rain, the resultant plasma was transferred to a clean tube and frozen at -20~ until analysis. Oral fluid samples, used for the preparation of calibrators, were obtained from healthy volunteers and collectedby spitting into a polypropylenetube. Oral fluidsamples from livingpersons suspected of driving under the influence were collected using the same procedure as described for the calibrators. After collection, the tubes were sealed and stored at -20~ prior to analysis.
Calibrators A series of calibrators (0, 0.5, 1, 5, 10, 50, 100, and 500 pg/L) were prepared by adding MDMA,MDA,MDEA,amphetamine, methamphetamine, and ephedrine to drug-free plasma and oral fluid.
Samplepreparation Plasma for LC-MS-MS analysis. Plasma samples or calibrators (50 pL) were added to 200 pL deuterated internal standard/precipitating solution and vortex mixed briefly. After centrifugation at 13,000 rpm for 5 rain, supernatants were transferred to an autosampler vial for analysis by LC-MS-MS. Oral fluid for LC-MS-MS analysis. After thorough centrifugation of the (often viscous) oral fluid samples, clarified supernatant was transferred to a clean tube using a positive displacement pipette. Aliquots (50 IJL)were then processed as detailed above for the plasma samples. LCwas performed using a Waters Alliance2690 system. Chromatography was achieved using a Hypersil BDS C18 column (2.1 x 100 turn, 3.5 pro) eluted isocratically using 10raM ammonium acetate and acetonitrile (75:25) delivered at a flow rate of 0.3 mL/min. All aspects of system operation and data acquisition were controlled using MassLynxNT 3.5 software. An injection volume of 10 pL was used in all cases. 79
Journal of Analytical Toxicology, Vol. 27, March 2003
MS
A Quattro Ultirna triple quadrupole MS (Micromass U.K., Ltd., Manchester, U.K.) fitted with a Z-Spray ion interface was used for all analyses. Ionization was achievedusing electrospray in the positive ionization mode (ES+). The following conditions were found to be optimal for the analysis of amphetamines: capillary voltage, 1.2 kV; source Table I. MRM Transitionsand Conditions for the Measurement of Several Amphetamines and their Deuterated Internal Standards Precursor Product ion (m/z) ion (m/z)
Compound
Cone
block temperature, 120~ and desolvation gas (nitrogen) heated to 350~ and delivered at a flow rate of 700 L/h. In order to establish the appropriate MRMconditions for the individual amphetamines and their respective deuterated analogues, solutions of the standards (0.1 mg/L in HPLC mobile phase) were infused into the MS and the cone voltage (CV) adjusted to maximizethe intensity of the protonated molecular B
A
100
Collision
voltage (V) energy(eV) %
MDEA 208 163 MDEA-d s 213 163 MDMA 194 163 MDMA-ds 199 165 MDA* 180 (180) 163 (105) MDA-d s 185 168 Ephedrine 166 148 Ephedrine-d3 169 151 Methamphetamine 150 91 Methamphetamine-dt4 164 98 Amphetamine 136 91 Amphetamine-dr: 147 98
50 50 60 60 30 (30) 50 30 40 50 50 60 60
12 12 12 13 8 (22) 10 12 12 15 18 17 16
* For this compound the use of an alternative transition was explored (conditions
are detailed in the parentheses).
1
163
~
163
A
2
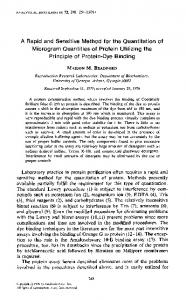
Figure 2. MRM chromatograms obtained with a single injection of oral fluid enriched with 5 pg/L MDA. Figures 2A and 2B show the responses obtained when the MRM transitions 180 > 163 and 180 > 105, respectively, were monitored for MDA. Peak intensity is shown in the top-righthand corner of each chromatogram.
t1
t ti tt91 t98
B
16
m/z
129 "t40
I1~ 1
229
O~
~r
120 ~r
m/z
im
m/z
m/z
rrdz
rrdz
11~
lsl
tl
m~
mlz
IF~ ~
2~
m/z
168
163
3
Time (rain)
1~
m/z
2
I
3
!9
D
m/z
mlz
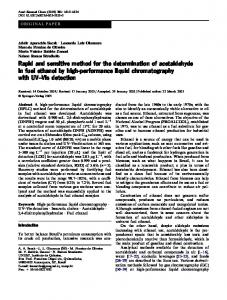
Figure 1. Product ion spectra for MDEA (A), MDMA (B), MDA (C), ephedrine (D), methamphetamine (E), and amphetamine (F). The product ion spectra for their respective deuterated analogues (right-hand figure of each panel) are also included. Pure standards (0.1 mg/L) were infused into the MS, and the cone voltage (CV) was optimized for the precursor ion (boxed m/z). Collision-induced dissociation was then performed and product ion spectra acquired under optimum conditions for the most abundant product ion.
80
Journal of Analytical Toxicology, Vol. 27, March 2003
B
A 100 2.1 e 5
100
100
IO0
4.4 e~'
1.0 e s
4.2 e*
[ I H_
100
100
2.1 9~
100
MDMA
4.4 9~
100
100
2.0 e~
loo
1.4e 5
100
[
s.a e'
1.4 9~
Amphetamine
_L
.
100
4.2 e' M])A
100
5.8 e"
%
I00
1.0 e 5
3.0 9~
%
100
MDs
100
3.0 9~
4.8 e"
.
.
100
4.8 94
L
%
100
100
.
2.7
es
100
Methamphetamine %
%
100
100
1 4 9~
Ephedrine
0 1 2 3 4
01
Time (mia)
234
2.2 e~
100
2.2
es
%
01
234
L
0
234
Time (rain)
Figure 3./vlRM chromatograms obtainedwith a single injection of' blank plasma (left-handcolumn, panel A) and plasmaenriched with 5 pg/Lof the variousamphetamines(right-hand column, panelA). Peakintensity is shown in the top right-hand cornerof each trace. The correspondingMRM chromatogramsfor blank and amphetamine-enrichedoral fluid are given in panel B. Sampleswere processedas described in the text.
81
Journal of Analytical Toxicology, Vol. 27, March 2003
species [M+H]§ Collision-induced dissociation (CID) of each protonated molecule was performed. Collision gas (argon) pressure was maintained at 2.5 x 10⁻³ mBar and the collision energy (eV) adjusted to optimize the signal for the most abundant product ions, which were subsequently used for MRManalysis. For one compound (MDA)the use of an alternative transition was explored. Table I summarizes the MRM transitions and conditions for the measurement of all of the amphetamines and their respective deuterated analogues. Quantitation was performed by integration of the area under the specific MRM chromatograms. In all cases, amphetamine concentration was calculated by reference to the integrated area of their respective deuterated analogues. Standard response curves were generated for the various amphetamines in plasma and oral fluid using a least-squares linear regression with a 1/x weighting. All aspects of data acquisition were controlled using MassLynx NT 3.5 software with automated data processing using the QuanLynxTM program (Micromass UK, Ltd.). Method validation To assess method linearity, a series of calibrators (0.5, 1, 5, 10, 50, 100, and 500 IJg/L)were prepared by adding MDMA,MDA, MDEA, amphetamine, methamphetamine, and ephedrine to drug-free plasma and oral fluid. Following isolation from the matrix using the methanol clean-up procedure (which incorporates the addition of the internal standards), the samples were analyzed in duplicate using the described LC-MS-MS method. Precision was evaluated for plasma and oral fluid by replicate (n = 10) injections from a single extract of a low, medium, and high calibrator (i.e., 2, 50, and 200 IJg/L)analyzed on the same day. Intra-assay variation was evaluated by analyzing 10 separate extractions from the same low, medium, and high calibrators in a single assay. Total reproducibility (interassay variation) was evaluated for each matrix by the preparation, extraction, and analysis of 10 standard curves over 10 separate days. The limit of detection (LOD) was estimated, from oral fluid and plasma samples with decreasing concentrations of the analytes, where the response was equal to five times the response of the blank matrix. The limit of quantitation (LOQ)was defined as the lowest concentration of analyte that could be measured reproducibly and accurately (coefficient of variation lower than 20%, accuracy higher than 80%). GC-MS For comparative purposes, some plasma samples were analyzed for the presence of amphetamines using an established GC-MS method. Briefly, amphetamines were extracted from plasma using solid-phase extraction (SPE) with mixed-mode C8-cation exchange columns (Bond Elut Certify, Varian Belgium) and ethyl acetate/ammonia (98:2, v/v) as eluent; heptafluorobutyric anhydride was used as derivatization agent. Quantitative analyses were performed using the deuterated analogues of all the analytes of interest. The GC-MS system
82
consisted of an HP6890 autosampler and GC system coupled to an HP5973 mass selective detector (AgilentTechnologies). An HP-5MS capillary column (30 m x 0.25 ram, 0.2-t~mfilm thickness) was used. Injection of the sample (1 I~L)was performed in the splitless mode at a temperature of 250~ The oven was programmed to ramp from 90~ to 300~ at a rate of 15~ The carrier gas helium was deliveredat a flow rate of I m~min. The MS ion source was maintained at 230~ and operated in selected-ion monitoring (SIM) mode. At least three ions were monitored for the analytes and two ions for the internal standards. The method is permanently evaluated through participation in external quality control programs (SFTA, France; GTFCh, Germany).
Resultsand Discussion LC-MS-MS method development In order to determine the optimum conditions for MRM analysis of the amphetamines, full scan mass spectra and product ion mass spectra were collected during direct infusion experiments. Figure 1 shows the product ion spectra that were obtained with the pure amphetamine standards. In all cases spectra were acquired under optimum conditions for the most abundant product ion. With the exception of MDA,these transitions were subsequently used for LC-MS--MSanalysesof blank plasma and oral fluid. When the m/z 180 > 163 transition was monitored for MDA,a relatively high background response was observed with both blank matrices. This resulted in a concomitant decrease in overall sensitivity (in terms of signal-tonoise ratio, S/N) for this particular compound. Consequently, the use of an alternative transition was investigated. When the LC conditions detailed previously were used, maximum sensitivity for MDAwas achieved by monitoring the m/z 180 > 105 transition (Figure 2). The applied chromatographic conditions ensured rapid elution of all of the examined drugs and produced chromatographic peaks of acceptable symmetry. Figure 3 shows the MRM chromatograms obtained with blank plasma and with plasma enriched with the various amphetamines. The corresponding MRM chromatograms for oral fluid are also included. LC-MS-MS analysis time did not exceed 6 rain. Method validation
Linearity, precision, variation, and sensitivity. Calibration curves were constructed for each compound by plotting the peak-area ratios (compound/internal standard) against the concentration. In each case a weighted (1/x) linear regression line was applied. Linear responses were obtained for all of the amphetamines over the range investigated (0.5-500 l~g/L) in both plasma and oral fluid. Linearity, LOD,and LOQ data for the various amphetamines are summarized in Table II. Limits of detection ranged from 0.2 to 2 IJg/L in plasma, which is a significant improvement over the sensitivity of the existing GC-MS method (LODs range from 5 to 10 tJg/L). It should be noted that the observed LODs for LC-MS-MS were achieved when using only 50 IJL of biological sample whereas typically
Journal of Analytical Toxicology, Vol. 27, March 2003
500-1000 IJLof specimen is used for the GC-MS procedure. LODs in oral fluid using LC-MS-MS were generally slightly better than those observed with plasma. This increase in sensitivity of analysis is likely to reflect the fact that, although saliva is a complex mixture, it is relativelyfree from interfering substances (e.g., proteins and lipids), in comparison to plasma. Precision, intra-assay, and interassay variation were found to be highly satisfactory for both biological matrices, with coefficients of variation (CVs)always < 10% (Table III). This confirms that although the developedmethod utilizes only minimal sample clean-up and rapid chromatography,it has not provedto be detriraental to the reproducibilib; reliability,or ruggedness of the technique. In the absence of rigorous sample preparation and/or better chromatographic separation, the components of any biological matrix will certainly have an effect on various stages of any analysis procedure, for example, in chromatographic separation or in the detection of the analyte (12). Thus, common practice is to use internal standardization in an attempt to compensate for such effects. Several amphetamine methods have been reported that make use of 'representative' standards rather than actual deuterated analogues of the drug in question have been reported. The former, however, should be used with caution because biologicalmatrices from different sources (i.e., different individuals) may have varying effects on the drugs within the specimen. This may be resolved by the use of the specific deuterated analogues as internal standards (13). The latter will have almost identical physicochemical properties to the unlabelled drugs and therefore, if added to the sample prior to analysis, will be present throughout the complete analytical procedure, that is, it will undergo chromatography and ionization suppression to the same extent as the parent drugs, thus compensating for differing matrix effects.
Comparison of GC-MS and LC--MS-MS. In order to validate the developed procedure, 59 plasma samples, collected from individuals suspected of driving under the influence, were analyzed for the presence of amphetamines using LC--MS-MS and GC-MS. For samples where the response exceeded the upper limit of the standard curves, dilutions of the sample (into blank plasma) were prepared and reanalyzed wherever sufficient sample allowed. Subsequent experiments, performed to assess the linearity of the LC-MS-MS method over an extended range (0.1-5000 1Jg/L), confirmed that responses were indeed linear (r2 > 0.99) for all drugs and in both plasma and oral fluid. The observed ]inearity indicates that the number of samples requiring dilution and reanalysismay be reduced in future and also could prove to be highly valuable in situations were there is only sufficient sample for a single analysis. Using LC-MS-MS, detectable levels of MDEA,MDMA,MDA, methamphetamine, amphetamine, and ephedrine were found in 4, 53, 44, 5, 35, and 0 plasma samples, respectively.In comparison, the number of positives detected by GC-MSwere 4, 53, 17, 4, 35, and 0, respectively.The apparent discrepancybetween the number of positive MDA-containingsamples is likelyto be a reflection of the relatively lower sensitivity of the GC-MS assay (i.e., LOD 10 IJg/L). Forty-nine percent of the plasma samples analyzed were found to contain MDMA,the metabolite MDA, and one or more of the other amphetamines. This result confirmed other reports of a trend for multiple, rather than single, drug use (14). Figure 4 shows the comparison between the quantitative results obtained by the two techniques. Where sufficient data points were obtained (i.e., MDMA,MDA,and amphetamine), linear regression analysiswas performed and good correlations were obtained (r2 values ranged from 0.917 to 0.977). Slope values ranged from 0.882 to 0.951. The lower values for the LC-MS-MS are possibly a result of the increased specificity with this technique.
Table II. Linearity Data for MDEA, MDMA, MOA, Ephedrine, Methamphetamine, and Amphetamine in Plasma and Oral Fluid Intercept*
R2 (rangeover 10 consecutivedays)
LOD* (pg/L)
EOQ* (pg/t)
3.74 8.92 4.13 4.62 4.92 6.87
-0.0083 -0.0288 0.0215 0.0424 -0.0051 0.0164
0.9998--0.9999 0.9997-0.9999 0.9998-0.9999 0.9994-0.9999 0.9992-0.9999 0.9993-0.9999
0.2 0.25 1.0 2.0 0.2 0.5
0.5 05 1,0 2.0 0.5 0.5
0.2791 0.2375
6.45 4.19
-0.0118 -0.0315
0.9993-0.9999 0.9992-0.9999
0.15 0.20
0.5 0.5
0,0711 0.0821 0.0623 0.I 483
5.10 4.68 7.80 9.90
0.0058 0.0097 -0,0076 -0.0183
0.9990-0,9999 0,9995-0.9999 0.9995-0,9999 0.9996-0.9999
0.5 0.5 0.2 0.5
1.0 1,0 0.5 0.5
Matrix
Compound
Slope*
Plasma
MDEA MDMA MDA Ephedrine Methamphetamine Amphetamine
0.2649 0,2299 0.0669 0.0784 0.0627 0.1405
Oral fluid
MDEA MDMA
MC)A Ephedrine Methamphetamine Amphetamine
CV of slope (% over 10 consecutivedays)
9Meanvalue over 10 consecutive days. ~"LOD defined as signal-to-noiseratio of > 5:1. $ LOQ defined asthe lowest concentration that could be quantitated wilh an imprecision of < 20%,
83
Journal of Analytical Toxicology,Vol. 27, March 2003
Oral fluid sample analysis. The validated LC-MSMS method was applied to the analysis of oral fluid samples collected from persons (n = 18) who were suspected of driving under the influence of drugs. Typically, the volume of oral fluid collected was 200 pL or less. The results from these individuals are summarized in Table IV. For several of the samples, it was not possible to
determine the oral fluid amphetamines using the GCMS procedure, whereas some amphetamines were successfully quantitated when the LC-MS-MS procedure was used. This is likely to be due to insufficient sensitivity of the former assay because only a limited amount of sample (< 100 pL) was collected in these particular circumstances.
Table III. Precision and Variation (Intra-assay and Interassay) Data for the LC-MS-MS Analysis of MDEA, MDMA, MDA, Ephedrine, Methamphetamine, and Amphetamine in Human Plasma and Oral Fluid Plasma
Oral fluid
Precision Intra.assay CV (%)
Conc.
Interassay CV
Conc.
(pglk)
CV (%)
(pglt)
(%)
(pglL)
2
2.6
4.5
0.5
5.1
1
2.6
1
3.9
5 10 50 100 500
4.6 2,0 2.1 3.0 0.6
5 10 50 100 500
4.3 2.1 2.4 3.8 1.1
0.5 1 5 10 50 I00 500
4.8 6.5 5.5 3.2 3.4 3.2 0.8
0.5 1 5 10 5O I00 500
6.3 4.3 3,7 2.2 3.3 3.9 I .I
0.5 5 I0 50 100 500
5.2 9.2 4.8 2.6 3.3 4.4 1.3
0.5 1 5 10 50 I00 500
7.4 8.6 5.0 3.3 4.0 3.2 1.0
0.5
7.0 7.7 4.7 2.2 3.5 3.9 1.1
Conc. Compound MDEA
MDMA
MDA
Ephedrine
Methamphetamine
Amphetamine
84
50
0,8
5.1
200
0.8
3.6
2
2.8
4,8
50
0.6
4.9
200
0.7
3.2
2
6.8
5.4
50
2.1
5.9
200
0.6
3.7
2
4.6
3.8
50
1.4
4.0
200
3.1
4.1
2
2.9
5.1
50
0.9
4.5
200
1.1
4.1
2
5.0
6.6
50
1.5
4.7
200
1.1
3.6
0.S
7.1
I
8.3
5 10 50 i O0 500
9.1 4.3 3.3 3.1 0.6
0.5 1 5 10 50 I00 500
6.9 8.0 5.8 5,8 3.7 4.3 1.0
0.5
3.1
1
6.5
5 10 50 I00 500
5.7 3.3 2.1 3.1 0.7
0.5
9.8
1
8.5
5 I0 50 I00 500
4.3 3.1 3.1 3.9 0.9
Precision Intra-assay
2
Interassay
CV (%)
CV (%)
Conc. (pglt)
CV (%)
2.1
3.5
0.5
4.8
50
0.7
5.9
200
0.5
2.1
2
4.0
3.3
50
0.7
63
200
1.0
2.3
2
7.4
8.4
1 50
1.7
6.2
200
1,0
3.0
2
4.0
7.0
50
1,8
5,6
200
1.0
3.1
2
2.3
4.5
1 50
0.9
5.7
200
0.7
3.0
2
3.6
6.4
5 10 5O I00 500 0.5
1 50
1.3
5.4
200
0.9
3.3
5 10 50 I00 500
4.4 9.5 5.5 2.5 3.4 4.3 1,0
Journal of Analytical Toxicology, Vol. 27, March 2003
with the amphetamines. Neither PEA or PPA produced a significant response in any channel. However,followingan injection of PMA, a small response was observed in the ephedrine channel (166 > 148). This was not unexpected because PMAhas a protonated molecule of the same mass-to-charge ratio as ephedrine and subsequent examination of this compound revealed that, followingCID,one of the product ions is indeed m/z
Interference. The potential interference from phenylethylamine (PEA), p-methoxyamphetamine (PMA), phenylpropanolamine (PPA),and pseudoephedrinewas investigatedby monitoring the responses in the amphetamine MRM channels following the injection of a total of i ng of standard material. These particular compounds were selected as those most likely to cross-react because of the high degree of structural similarity
500
./
400
m
1
./
300
/-
200
..'".." 0
/
i
1200
~
800
/"
~= >'
~
./
/
/ '
100
400 t
/ .,,6)'
,.~
o
~y~.
o ,o"
o 100
200
300
400
500
600
,
0
400
....."!..!...
~.~ 6o
o ..'" ...'"
| 40
~ 24 ~
20
~
16
.a~,
..
"
12
/
30
=~ 20