Proceedings of the 2013 IEEE Second International Conference on Image Information Processing (ICIIP-2013)
Development of Improved SSIM Quality Index for Compressed Medical Images 1
Basant Kumar , Shishu Bind Kumar2, and Chandrahas Kumar
3
1, 2, 3
Motilal Nehru National Institute of Technology, Allahabad, India
[email protected],
[email protected],
[email protected]
1
measures are attractive because of low computational complexity as well as their independence of viewing conditions and individual observers. Another set of objective quality evaluation uses human visual system (HVS) characteristics incorporating perceptual quality measures [1]-[2] of the reconstructed image. For example, Structural Similarity index (SSIM) is measure of structural similarity quality using contrast sensitive function approach of HVS to determine the quality of compressed image [3]. This evaluation method provides good estimate to perceptual image distortion because HVS is highly adaptive in extracting changes in structural information from the viewing field. However, even HVS based complex metrics does not provide any clear advantage over MSE and PSNR under different noise prone environments [4]. In spite of numerous studies on improving the computation methods for objective quality assessment (QA) of reconstructed images, the objective quality evaluation schemes do not correlate well with MOS quality index which provides realistic quality assessment based on visual image perception [5]. Although MOS quality assessment is more suitable under practical situation but it has inherent limitations due to dependence of perceptual decision on the individual observers. Novel models of observer independent MOS prediction for quality assessment of reconstructed CT scan, MRI and ultrasound images considering JPEG, JPEG2000, and SPIHT compressions at varying rates were presented in reference [6]-[7]. Based on correlation coefficient (CC) between PSNR/SSIM and experimental MOS it is reported that the PSNR has better matching with experimental MOS values [7] for compressed medical images. HVS based SSIM index may not provide superiority over computation based quality assessment model because of its limitations. In Wang et.al. [3] paper, the SSIM measure used the following setting: K1 = 0.01 and K 2 = 0.03. However, performance of this quality index may improve by choosing more suitable of constant parameters K1 and K 2 used for computing SSIM index. This paper proposes improved SSIM index for quality assessment of SPIHT compressed CT scan, MRI and ultrasound images by experimentally finding optimal values of the constants used for SSIM index formula. Rest of the paper is presented as follows: Structural similarity index measurement technique along with some other quality assessment parameters is explained in section 2. Section 3 presents the performance of SSIM quality index along with PSNR, MSE and MOS for compressed medical images. Experiment is repeated by
Abstract - This paper presents the development of improved structural similarity index (SSIM) quality assessment parameter for compressed medical images. The SSIM has been proved to be better objective quality assessment metric which exploits the structural similarity in the viewing field. In this paper, the SSIM quality index has been modified by achieving optimal value of arbitrary constant K used in SSIM index expression. The analysis has been done for three different types of medical image; MRI scan, CT scan and ultrasound image. SSIM index along with PSNR, MSE and mean-opinion- score (MOS) are computed for SPIHT compressed medical images at varying compression rates by setting values of K in the range 0.02 to 2.0. The value of K giving maximum correlation coefficient (CC) between SSIM index and MOS is selected as optimal value. It is found that optimal values of K equal to 0.5, 0.05 and 0.1 for MRI, CT scan and ultrasound images respectively. Keywords - Quality Assessment, SSIM, MOS, PSNR, MSE, MRI, CT scan, Ultrasound, Compression Ratio (CR).
Q
I.
INTRODUCTION
assessment of image is very crucial for quantifying the effect of various image processing operations. Development of accurate image quality assessment parameters is still an open research problem. Image compression is one of the major areas where the use of an accurate quality metric can help in determining the upper threshold of compression rate so that the reconstructed image after decompression is imperceptible. Tele-radiology involves transmission of medical images in compressed form in order to achieve reduced channel bandwidth requirement and transmission time. Since lossless compression schemes provide little amount of compression, lossy compression schemes are being used for medical image compression. However, a judicious trade-off between the level of lossy compression and the fidelity of reconstructed medical image at the receiving end is required. This is because the reconstructed image fidelity crucially affects accuracy of the clinical diagnosis as the presence of any visual artifacts may hinder diagnosis conclusions and lead to serious lapses. Therefore, ensuring acceptable quality of reconstructed medical image become prime focus. Further, the fidelity evaluation of the reconstructed image to ascertain the performance of a lossy compression algorithm requires defining quantitative or qualitative parameters. The objective image quality measures (distortion assessment approaches) like mean squared error (MSE) and peak signal- to-noise ratio (PSNR) are frequently used for fidelity evaluation of reconstructed images. These mathematically defined objective quality UALITY
978-1-4673-6101-9/13/$31.00 ©2013 IEEE
251
Proceedings of the 2013 IEEE Second International Conference on Image Information Processing (ICIIP-2013)
changing the value of K used in SSIM index formula in the range of 0.02 to 2.0. Optimal value of K is obtained corresponding to each type of medical image by finding the maximum correlation coefficient between SSIM index and experimental MOS. Conclusion of overall work is provided in section 4.
l ( x, y ) =
Where μx & μy are mean values of signal x and y. The contrast comparison is defined as: 2σ xσ y + c1 c ( x, y ) = 2 σ x + σ y2 + c2
STRUCTURAL SIMILARITY INDEX MEASUREMENT [3]
I.
and C3 = C2 2 which results in a specific form of SSIM given as: ⎛⎜ 2μ μ + c ⎞⎟⎛⎜ 2σ σ + c ⎞⎟ x y 1 ⎠⎝ x y 2⎠ SSIM = ⎝ (5) ⎛⎜ μ 2 + μ 2 + c ⎞⎟⎛⎜ σ 2 + σ 2 + c ⎞⎟ y 1 ⎠⎝ x y 2⎠ ⎝ x Some other quality assessment parameters used in this paper are as follows: Mean Square Error (MSE): Mean Square Error is used to calculate the difference between estimated values and the true values of the quantity being estimated are the square of the difference of pixels. The error is the amount by which the value implied by the estimator differs from the quantity to be estimated. Peak Signal to Noise Ratio: Peak Signal to Noise Ratio (in decibels) is defined as the ratio of the maximum possible power of a signal and the power of corrupting noise that affects the signal fidelity. Mean Opinion Score (MOS): It is a subjective quality evaluation by viewers with normal or corrected to normal eye sight by giving opinion score to each image. MOS is the benchmark for evaluating the quality of image or video signals. The perceived image quality has been defined by CCIR (International Radio Consultative committee ) using 1-5 scale as bad, poor, fair, good and excellent [9]. Finally, an average score is computed to obtain the mean opinion score (MOS) for a specific image using equation (6). 1 n MOS ( j ) = (6) ∑ S (i, j ) n i =1 Where n denotes the number of observers and S (i, j) is the score given by the ith observer to image j. In case of medical images, a radiologist can judge the quality of the medical image by inspecting the loss of diagnostic information in the image. We have considered five observers to compute MOS of MRI, CT scan and ultrasound images under the present study.
Luminance Measurement Luminance Comparison
÷
Contrast Comparison
Combination
Luminance Measurement +
Signal y
Structure Comparison
Contrast Measurement
(2)
0, 0& 0 are parameters used for Where adjusting relative importance of the three components. In order to simplify the expression, take 1
Signal x
Contrast Measurement
(1)
The structure comparison is defined as: σ xy + c3 s ( x, y ) = (3) σ x + σ y + c3 Finally the three equations are combined to get the similarity measure (SSIM) index between signals x and y and expressed as. (4) SSIM = [l ( x, y )]a .[c ( x, y ) ]b .[s ( x, y )]c
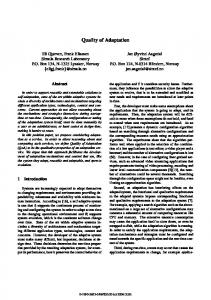
Structural Similarity (SSIM) Index is an objective quality assessment parameter applied to measure similarity between two images. SSIM index is HVS model based quality metric designed to provide improvement over conventional techniques such as peak signal-to-noise ratio (PSNR) and mean squared error (MSE), which do not match well with human eye perception [1]. Image quality measurement may be done efficiently through determination of variation in SSIM, which can be achieved by comparing local patterns of pixel intensities normalized for luminance and contrast. Structural information is very prominent in natural images as their proximate pixels show strong dependencies and these dependencies can provide significant information about the structure of the object in the visual scene.
+
2μ x μ y + c1 μ x2 + μ 2y + c2
Similarity Measure
÷
Fig.1. Structural Similarity Measurement system
The Fig. 1 shows the method for the SSIM calculation [3], [8]. The similarity measurement task is based on three comparisons: luminance, contrast and structure. The luminance of each signal is compared first, which is determined in terms of mean intensity (μ). The luminance comparison function l(x, y) is a function mean of the two signal x and y. Secondly, the standard deviation is used as an estimate of the signal contrast. Comparison of standard (σ) deviation of signal x and y is represented as contrast comparison c(x, y) function. Thirdly, the signal is divided by its own standard deviation so that the two signals under comparison have unit standard deviation. The structure comparison s(x, y) is conducted on these (y - μ y ) . normalized signals (x - μ x ) σy σ x , and Luminance comparison is defined as:
252
Proceedings of the 2013 IEEE Second International Conference on Image Information Processing (ICIIP-2013)
II.
DEVELOPMENT OF IMPROVED SSIM INDEX
image. Table 5 provides the correlation coefficient values between PSNR/improved SSIM and MOS for considered medical images. It can be observed from the table that improved SSIM index has slightly better matching with experimental MOS.
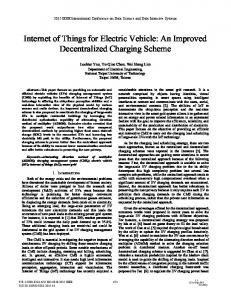
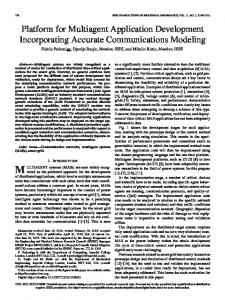
Experiments were performed considering an MRI, a CT scan and an ultrasound image of size 256 x 256 each with 8-bit grey scale levels available in reference [10]. The images were compressed using SPIHT compression algorithm by varying bit rates (bits per pixel) in the range of 0.05 to 2.0 [11]. Figures 2, 3 and 4 show MRI, CT scan and ultrasound images respectively in their original and compressed form. SSIM index along with PSNR, MSE and mean-opinion- score (MOS) are computed for SPIHT compressed medical images at varying compression rates. This paper attempts to improve the SSIM index expression for SPIHT compressed MRI, CT scan and ultrasound images. In our approach we aim at varying the values of K1 and K 2 in the range from 0.02 to 2.0. K 2 is the constant same as used in equation (2). The coefficients C1 = ( K1L)2 and C2 = ( K 2 L)2 are used in the SSIM calculation. It is observed that the performance of SSIM index is fairly insensitive to variation in K1 . Therefore, SSIM index is computed for SPIHT compressed medical images at varying compression rates by setting values of K 2 in the range 0.02 to 2.0. Experiment is repeated by changing the value of K 2 . Mean opinion score (MOS) is calculated with the help of observations made by five observers with normal or corrected to normal vision for each compressed image. For example tables 1, 2 and 3 show the performance of quality assessment parameters (SSIM, MSE, PSNR and MOS) for SPIHT compressed MRI, CT scan and ultrasound images respectively at following parameter settings: K1 = 0.01, K 2 = 0.05. At each setting of K 2 , a correlation coefficient (CC) is computed between SSIM index and MOS. The performance of SSIM index formula is improved by setting the value of K 2 which provides maximum correlation coefficient between SSIM index and MOS. Table 4 provides the correlation coefficient values for considered medical images at different values of K 2 . The values of K 2 corresponding to maximum correlation coefficients are obtained as 0.5 for MRI scan, 0.05 for CT scan and 0.1 for ultrasound image respectively. It is also observed from the table that the maximum value of the correlation coefficient comes out to be 0.9883 for MRI image, 0.9785 for CT scan image and 0.9789 for ultrasound image. Further, fig. 5 shows the variation of correlation coefficient values between SSIM Index and experimental MOS with respect to change in value of K 2 . It is observed from the fig. that different values of K 2 are required to be set in SSIM Index expression in order to fine tune the performance of this quality assessment parameter for medical images from different modalities. To validate the improved SSIM Index, a performance comparison is made between PSNR and SSIM index by computing the correlation coefficient between PSNR / Improved SSIM and experimental MOS after setting the obtained optimal values of K 2 corresponding to each type of medical
(a)
(b)
(c) Fig.2 Original and compressed MRI images (a) original image and compressed images with compression ratio (b) 0.5 (c) 1.5
253
Proceedings of the 2013 IEEE Second International Conference on Image Information Processing (ICIIP-2013)
(b)
(a)
(c) Fig.4 Original and compressed Ultrasound images (a) original image and compressed images with compression ratio (b) 0.05 (c) 1.2
(b)
Table 1. Quality assessment performance for compressed MRI image for K 2 =0.05
SSIM
MSE
PSNR (dB)
0.05
0.195
12733.3
7.08
1
0.1
0.2684
7319.1
9.49
1.6
0.2
0.3075
5028.7
11.12
2.1
0.5
0.3254
4327.8
COMPRESSION RATE (CR)
11.77
2.8
1
0.5262 763.0926
19.31
3.8
1.2
0.5603 532.3871
20.87
4
1.5
0.7032 272.8785
23.72
4.2
0.724
223.3661
24.64
4.3
0.8234 131.6008
26.94
4.5
1.7
(c) Fig.3 Original and compressed CT Scan images (a) original image and compressed images with compression ratio (b) 0.05 (c) 1.2
MOS
2
Table 2. Quality assessment performance for compressed CT scan image at K 2 =0.05
(a)
254
COMPRESSION RATE (CR)
SSIM
MSE
PSNR (dB)
MOS
0.05
0.1839
12219
7.26
1
0.1
0.2224
9263.1
8.46
1.2
0.2
0.2702
5809
10.49
1.56
0.5
0.2955
4501.7
11.6
2.2
1
0.458
720.56
19.55
2.52
Proceedings of the 2013 IEEE Second International Conference on Image Information Processing (ICIIP-2013)
COMPRESSION RATE (CR)
SSIM
1.2
0.4795
627.05
20.16
3
1.5
0.5685
318.936
23.09
3.28
1.7
0.7099
247.13
24.2
3.96
2
0.4192
137.24
26.76
4.24
PSNR (dB)
MSE
Table 5. Correlation Coefficient between PSNR/Improved SSIM and Experimental MOS
MOS
SSIM
MSE
PSNR (dB)
0.2883 4501.7
11.6
1
0.1
0.3196 3275.5
12.98
1.3
0.2
0.3279 3086.9
13.24
1.62
0.5
0.3641 2686.4
13.8
2.22
1
0.5241 413.45
21.97
2.76
1.2
0.5298 397.72
22.13
3.2
1.5
0.6394 223.75
24.63
3.6
1.7
0.6494 200.97
25.1
4
2
0.7575 125.68
27.14
4.2
0.9449
0.9779
0.05
0.951
0.9785
0.9778
0.1
0.9625
0.9742
0.9789
0.5
0.9883
0.9355
0.9599
0.7
0.9872
0.9261
0.956
1
0.9841
0.9168
0.9537
1.2
0.9819
0.9125
0.9529
1.5
0.981
0.906
0.9524
1.7
0.9789
0.9002
0.9521
2
0.9755
0.8958
0.9519
0.9731 0.9704
CONCLUSION
REFERENCES [1]. M. P. Eckert and A. P. Bradley, 1998, Perceptual quality metrics applied to still image compression. Signal Processing, 70, 177–200. [2]. G. Ginesu, F. Massidda, D.D. Giusto, 2006, A multifactor approach for image quality assessment based on a human visual system model. Signal Processing: Image Communication, 21, 316-333. [3]. Z. Wang, A. C. Bovik, H. R. Sheikh, and E. P. Simoncelli, 2004, Image quality assessment: From error measurement to structural similarity. IEEE Transactions on Image Processing, 13, 600–612. [4]. A. M. Eskicioglu and P. S. Fisher, 1995, Image quality measures and their performance. IEEE Transactions on Communications, 43, 2959–2965 [5]. Z. Wang, A. C. Bovik, and L. Lu, 2002, Why is image quality assessment so difficult. Proceedings of IEEE International Conference of Acoustics, Speech and Signal Processing, 4, Orlando, 3313–3316. [6]. B. Kumar. S.P. Singh, A. Mohan and A. Anand, "Novel MOS prediction models for compressed medical image quality", Journal of Medical engineering & technology, vol 35, pp. 161-171, 31/ 2011. [7]. Wan Z.. flosik, A C, Sheikh, H.R. and Simoncelli, E.P., 2004, "Image quality assessment: From error measurement to structural similarity," IEEE Transactions on Image Processing, 13.600-612. [8]. Zhou Wang, E. P. Simoncelli, A. C. Bovik: Multiscale structural similarity for image quality assessment, Int. Conf. IEEE Asilomar Conf. Signals Syst. Compute. 2003, 1398-1402. [9]. Methodology for the subjective assessment of the quality of television pictures. ITU-R Recommendation 500-6, 1994 TM [10]. MedPix Medical Image Database available at http://rad.usuhs.mil/medpix/medpix.html [11]. Said and W. A. Pearlman, ‘A new fast and efficient image, codec based on set partitioning in hierarchical trees." IEEE Trans. Circuits Systems, Vol. 6, no.3, pp. 243-250, 1996.
MRI Image CT Image Ultrasound Image
0.02
0.9785 0.9789
This paper proposed improved SSIM index for quality assessment of SPIHT compressed CT scan, MRI and ultrasound images by experimentally finding optimal values of the constants used for SSIM index formula. The optimal values of k were obtained as 0.5 for MRI scan, 0.05 for CT scan and 0.1 for ultrasound image. It was also found that the improved SSIM index had slightly better matching with experimental MOS as compared to PSNR for considered medical images.
Table 4. Correlation coefficient between SSIM index and MOS at varying value of K 2 K2
CT Scan Ultrasound
IV.
MOS
0.05
Correlation Coefficent (PSNR and MOS) 0.9714
MRI
Table 3. Quality assessment performance for compressed Ultrasound image at K 2 =0.05 COMPRESSION RATE (CR)
Correlation Coefficent (SSIM and MOS) 0.9883
Image Type
0.9766
Fig.5 Variation of Correlation Coefficient of different types of medical images with K 2
255