Available online at www.sciencedirect.com Available online at www.sciencedirect.com
Procedia Engineering
Procedia Engineering 00 (2011) 000–000 Procedia Engineering 15 (2011) 4841 – 4846 www.elsevier.com/locate/procedia
Advanced in Control Engineering and Information Science
Development of In-process Surface Roughness Evaluation System for Cast Nylon 6 Turning Operation Bandit Suksawata,* Department of Teacher Training in Mechanical Engineering, Faculty of Technical Education, King Mongkut’s University of Technology North Bangkok, 1518 Pibulsongkram Road, Bangsue,Bangkok, 10800,Thailand
Abstract This paper aims to develop in-process surface roughness evaluation system for cast nylon 6 turning operation. Construction of the developed system composes of data acquisition system and fuzzy logic system. The data acquisition system includes a miniature load cell inserted in a tool holder, signal conditions and a signal interface card in order to detect cutting force signal and transmit signal to the data analysis module constructed by LabVIEW program. The mamdani-type fuzzy inference system was utilized and twenty fuzzy rules were determined based on relationship of cutting speed, feed rate and cutting force for prediction both of surface roughness value (Rz) and symbolic representation. The results indicated that prediction by the developed system had 87% of accuracy with an average absolute error of 4.8 µm. The method validation results exhibited that precision and surface roughness value obtained from conventional measuring method and the developed prediction system was not significant different.
© 2011 Published by Elsevier Ltd. Selection and/or peer-review under responsibility of [CEIS 2011] Open access under CC BY-NC-ND license.
Keywords: Surface roughness, Fuzzy logic system, Method validation, Cast Nylon mateiral, In-process prediction system
1. Introduction An index of machined part quality is evaluated by surface roughness which is determined in a shop floor drawing. In practical, the surface roughness is evaluated during operation process by decision of an experience-skilled worker and inspection of the finished surface by surface roughness tester in quality control process. A large number of errors from operators’ surface roughness decision making were frequency obtained in machining operation resulting in increase of production time and operation costs. In
* Corresponding author. Tel.: +662-913-2500 Ext.3291; fax: +662-587-8261. E-mail address:
[email protected].
1877-7058 © 2011 Published by Elsevier Ltd. Open access under CC BY-NC-ND license. doi:10.1016/j.proeng.2011.08.903
4842
Bandit Suksawat / Procedia Engineering 15 (2011) 4841 – 4846 B. Suksawat / Procedia Engineering 00 (2011) 000–000
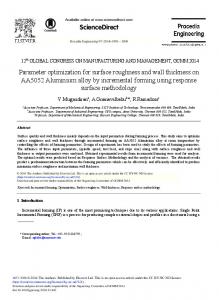
recent year, several researchers have been proposed the surface roughness prediction methods using cutting parameters for example a linear regression in statistical method and artificial intelligent methods as reviewed by P.G. Benardos and G.-C. Vosniakos (2003) [1]. The statistical method using linear regression reported by Hun-Keun Chang et al.,(2007) [2] has been used for in-process surface roughness prediction with a mean accuracy of 95%. Artificial intelligent techniques, such as artificial neural networks and fuzzy logic were successfully applied to surface roughness prediction through recent year. For example, Wen-Tung Chien and Chung-Yi Chou (2001) [3] introduced artificial neural network (ANN) for surface roughness prediction model creation with an error of the prediction at 4.4%. Sivarao (2009) [4] and Sivarao et al.,(2009) [5] studied surface roughness prediction by fuzzy logic including mamdani-type and sugeno-type fuzzy inference system. The comparative predicted surface roughness and observed values clearly indicated that these two outputs were acceptable. F. Dweiri et al.,(2003) [6] designed a knowledge- based system for surface roughness modeling in milling process by adaptive neuro fuzzy inference system (ANFIS). N.R. Abburi and U.S. Dixit (2006) [7] developed a knowledge-based system using neural network and fuzzy logic for prediction of surface roughness in turning process. The developed knowledge-based system was also used for making prediction of the process conditions. R.A. Mahdavinejad and H. Sharifi Bidgoli (2009) [8] applied fuzzy-neural network model for prediction of surface roughness in dry turning process with an average prediction error of 20.188%, the minimum and the maximum error was 0.3% and 63.7%, respectively. However, all developed systems and prediction models focused on ferrous materials such as carbon steel, stainless steel and cast iron steel. But the surface roughness prediction system for polymer material has not been reported yet. The cast nylon 6 is a special polymer material thus its properties is different from steel materials especially in dimensional properties including available shapes, sizes and surface texture. The surface texture, color and refractive index of cast nylon 6 affects on difficulty of machined surface roughness evaluation by workers’ decision during the process. The suitable surface roughness prediction model and in-process surface roughness prediction system in polymer material turning operation have not been proposed. Therefore, a real-time surface roughness evaluation system for cast nylon 6 during turning operation is required for productivity improvement and operation costs reduction. This paper focus on the development of in-process surface roughness evaluation of cast nylon 6 turning operation using fuzzy logic system in order to simplify and correctly indicate machined finishing surface. The method validation [9] is also applied to analyze precision of the developed surface roughness evaluation method and conventional surface roughness measuring method. 2. Development of In-process Surface Roughness Evaluation System 2.1. System Construction The system structure consists of data acquisition system and fuzzy logic system. The data acquisition system comprises of hardware module, signal conditioning module and data analysis module. A miniature load cell Kyowa type LM Class N is selected as a hardware module and it is installed on a cutting tool holder in order to detect cutting force signal. The signal condition module consists of amplifier circuit and NI DAQ 6008 interface card where the detected signal is transmitted and transformed to analogue signal into digital signal. The digital signals from signal condition module are sent to a computer as the data analysis module created by LabVIEW programming. A block diagram of data analysis program is shown in Fig.1. A linear calibration equation of load cell and a change of revolution to cutting speed equation are included in this module for computing cutting force and cutting speed, respectively. Cutting force, cutting speed and feed rate were determined as input variables of fuzzy logic system. The fuzzy logic system was structured by using PID and Fuzzy Tool-kit in LabVIEW program. An output from the fuzzy system is a
Bandit – 4846 B.Suksawat Suksawat//Procedia ProcediaEngineering Engineering15 00(2011) (2011)4841 000–000
surface roughness value Rz and the formula node was created in order to change the numerical surface roughness value into a symbolic representation following the JIS B-0601 standard.
Fig. 1. Graphical block digram of data analysis program
2.2. Fuzzy Logic Model The designed fuzzy logic model consists of three input variables as a cutting force (N), a cutting speed (m/min) and a feed rate (mm/rev) and output variable is a surface roughness value Rz (µm). The mamdani-type fuzzy inference system was used in this study. The input-output data sets are fuzzified as presented in Fig.2 - Fig.5. Each variable comprises of three interval membership functions consisting of small or Nagative, N; medium or Zero, Z; and large or Positive, P. The data of previous study in cutting conditions influence on surface roughness in cast nylon [10] were also analyzed and considered for construction of fuzzy rules in this study. Twenty linguistic rules and values of linguistic variable in the premises were interpreted as shown in Fig.6. The centroid or center of area method was used for defuzzification of output membership functions.
Fig.2. Membership functions of Cutting Force
Fig.3. Membership functions of Cutting Speed
4843
4844
Bandit Suksawat / Procedia Engineering 15 (2011) 4841 – 4846 B. Suksawat / Procedia Engineering 00 (2011) 000–000
Fig.4. Membership functions of feed rate
Fig.5. Membership functions of fuzzy out (Rz)
1. IF (Cutting Force = N) AND (Cutting Speed = N) AND (Feed Rate = N) THEN (Fuzzy Out = Z) 2. IF (Cutting Force = N) AND (Cutting Speed = N) AND (Feed Rate = P) THEN (Fuzzy Out = Z) 3. IF (Cutting Force = N) AND (Cutting Speed = Z) AND (Feed Rate = Z) THEN (Fuzzy Out = N) 4. IF (Cutting Force = N) AND (Cutting Speed = P) AND (Feed Rate = P) THEN (Fuzzy Out = N) 5. IF (Cutting Force = Z) AND (Cutting Speed = N) AND (Feed Rate = N) THEN (Fuzzy Out = Z) 6. IF (Cutting Force = Z) AND (Cutting Speed = N) AND (Feed Rate = Z) THEN (Fuzzy Out = Z) 7. IF (Cutting Force = Z) AND (Cutting Speed = N) AND (Feed Rate = P) THEN (Fuzzy Out = P) 8. IF (Cutting Force = Z) AND (Cutting Speed = Z) AND (Feed Rate = N) THEN (Fuzzy Out = Z) 9. IF (Cutting Force = Z) AND (Cutting Speed = Z) AND (Feed Rate = P) THEN (Fuzzy Out = Z) 10. IF (Cutting Force = Z) AND (Cutting Speed = P) AND (Feed Rate = N) THEN (Fuzzy Out = N) 11. IF (Cutting Force = Z) AND (Cutting Speed = P) AND (Feed Rate = Z) THEN (Fuzzy Out = N) 12. IF (Cutting Force = Z) AND (Cutting Speed = P) AND (Feed Rate = P) THEN (Fuzzy Out = P) 13. IF (Cutting Force = P) AND (Cutting Speed = N) AND (Feed Rate = N) THEN (Fuzzy Out =N) 14. IF (Cutting Force = P) AND (Cutting Speed = N) AND (Feed Rate = P) THEN (Fuzzy Out = P) 15. IF (Cutting Force = P) AND (Cutting Speed = Z) AND (Feed Rate = N) THEN (Fuzzy Out =N) 16. IF (Cutting Force = P) AND (Cutting Speed = P) AND (Feed Rate = Z) THEN (Fuzzy Out = N) 17. IF (Cutting Force = P) AND (Cutting Speed = P) AND (Feed Rate = N) THEN (Fuzzy Out = N) 18. IF (Cutting Force = Z) AND (Cutting Speed = Z) AND (Feed Rate = Z) THEN (Fuzzy Out = Z) 19. IF (Cutting Force = N) AND (Cutting Speed = Z) AND (Feed Rate = N) THEN (Fuzzy Out =Z) 20. IF (Cutting Force = P) AND (Cutting Speed = Z) AND (Feed Rate = P )THEN (Fuzzy Out = P) Fig.6. A set of fuzzy rules
3. Materials and Methods All experiments have been carried out in dry machining on TUG-40 Nr-1275 lathe. Fifteen workpieces used in this study were made from cast nylon 6 with 25.4 mm in diameter and 120 mm in length. The square 9.5 mm single-point high-speed steel cutting tool (Molybdenum type model Super Extra 1900 SWENDE) was used in turning operation. The cutting tool geometry was 66° for wedge angle and 12° for side angle, rake angle and clearance angle. The cutting conditions are cutting speed, feed rate and depth of cut. Each operation was performed by a certain combination of the parameters including cutting speed which is randomly operated by various diameters of workpieces by fixing turning revolution (rpm), feed rate (mm/rev) and depth of cut (mm). In this study, turning revolutions at 1,060 and 1,500 rpm were used, feed rate were randomly operated in range of 0.04 - 0.2 mm/rev and cutting depth were 1.25 - 4.5 mm. The cutting force during machining was measured by a miniature load cell Kyowa type LM Class N with sensitivity of ± 1% which was inserted inside a specific tool holder. The detected signal was transmitted to the fuzzy logic module via the signal conditioning and the interface card. The system predicted the surface roughness value as Rz (µm) and symbolized the Rz value. In order to compare an accuracy of the
4845
Bandit – 4846 B.Suksawat Suksawat//Procedia ProcediaEngineering Engineering15 00(2011) (2011)4841 000–000
developed system, the surface roughness of machined workpieces were measured by AltiSurf500 surface roughness and profile meter with ± 3µm of accuracy. The percentage error of each experiment was computed to determine effectiveness of the developed system. In this study, the method validation was applied for analysis of the measured and predicted data set using a two-tailed paired t-test. Furthermore, both data sets were evaluated by F-test for method precision [9]. 4. Experimental Results The cutting conditions consisting of cutting speed in rage of 57.28-109.33 m/min, feed rate at 0.05- 0.20 mm/rev and cutting depth at 1.25-4.25 mm were randomly operated in the experiments. The cutting force and surface roughness obtained from the experiment was 6.60-55.45 N and 22.7-59.60 µm, respectively (Table 1). The average absolute errors between the measured and predicted values were 4.87 µm with standard deviation at 5.15µm and percentage errors was 13.00% with standard deviation of 18.35% as presented in Table 1. The missing of symbolic representation of surface roughness was 13.33 %. The method validation results, the analysis of measured and predicted data set exhibits that statistical t-value of - 0.4778 was below the critical t-value of 2.145 and p-value 0.640 > 0.05 as shown in Table 2. Therefore, the null hypothesis that the developed surface roughness prediction method does not significantly differ from the conventional measuring method with 95% confidence. The analyzed precision of prediction system exceeds that statistical F-value of 0.070 < critical F-value of 4.196; therefore, null hypothesis is accepted as presented in Table 3. Thus it can be concluded with 95% confidence that there is no significant difference in precision between the prediction surface roughness method and convectional surface roughness measuring method. Table 1. Experimental and error evaluation results Cutting Speed (m/min)
Cutting Force (N)
Feed Rate (mm/rev)
Cutting Depth (mm)
Measured Rz Value (µm)
Predicted Rz Value (µm)
Absolute Error (µm)
Percent Error (%)
Measured Symbol
Predicted Symbol
Verified Result
57.277
11.042
0.045
4.25
22.70
39.43
16.73
73.70
∇∇#3
∇#2
Incorrect
92.834
11.867
0.045
3.00
38.00
39.43
01.43
03.76
∇#2
∇#2
Correct
65.602
10.732
0.068
3.00
41.90
39.43
02.47
05.89
∇#2
∇#2
Correct
97.546
24.860
0.120
2.50
40.50
39.43
01.07
02.64
∇#2
∇#2
Correct
102.258
14.742
0.068
2.00
39.30
39.44
00.14
00.36
∇#2
∇#2
Correct
65.602
17.368
0.075
3.00
44.40
39.44
04.96
11.17
∇#2
∇#2
Correct
75.593
06.600
0.082
1.50
43.10
39.44
03.66
08.49
∇#2
∇#2
Correct
57.277
26.791
0.105
4.25
36.40
39.44
03.04
08.35
∇#2
∇#2
Correct
97.546
17.187
0.075
2.50
42.80
39.45
03.35
07.83
∇#2
∇#2
Correct
109.327
23.560
0.150
1.25
36.10
39.45
03.35
09.28
∇#2
∇#2
Correct
75.593
07.721
0.090
1.50
37.60
39.49
01.89
05.03
∇#2
∇#2
Correct
85.765
20.964
0.090
3.75
53.30
39.49
13.81
25.91
∇#3
∇#2
Incorrect
81.053
55.454
0.195
4.25
59.60
59.00
00.60
01.01
∇#3
∇#3
58.942
54.972
0.195
4.00
55.90
59.91
04.01
07.17
∇#3
∇#3
Correct Correct
68.932
22.141
0.165
2.50
51.40
63.96
12.56
24.44
∇#3
∇#3
Correct
Average SD
04.87 05.15
13.00 18.35
Missing
13.33%
4846
Bandit Suksawat / Procedia Engineering 15 (2011) 4841 – 4846 B. Suksawat / Procedia Engineering 00 (2011) 000–000 Table 2. The paired T-test results for investigation of different data set of measured and predicted surface roughness value Detail
Measured Rz Value
Predicted Rz Value
t Stat
Mean Variance Observations Pearson Correlation
42.867 85.638 15 0.692
43.749 80.313 15
- 0.4778
t Critical two-tail 2.145
P(T