Remote Sens. 2014, 6, 6347-6364; doi:10.3390/rs6076347 OPEN ACCESS
remote sensing ISSN 2072-4292 www.mdpi.com/journal/remotesensing Article
Development of Methods for Detection and Monitoring of Fire Disturbance in the Alaskan Tundra Using a Two-Decade Long Record of Synthetic Aperture Radar Satellite Images Liza K. Jenkins 1,2*, Laura L. Bourgeau-Chavez 1, Nancy H. F. French 1, Tatiana V. Loboda 3 and Brian J. Thelen 1 1
2 3
Michigan Tech Research Institute, Michigan Technological University, Ann Arbor, MI 48105, USA; E-Mails:
[email protected] (L.L.B.-C.);
[email protected] (N.H.F.F.);
[email protected] (B.J.T.) School of Natural Resources & Environment, University of Michigan, Ann Arbor, MI 48109, USA Department of Geography, University of Maryland, College Park, MD 20742 USA; E-Mail:
[email protected]
* Author to whom correspondence should be addressed; E-Mail:
[email protected]. Received: 19 March 2014; in revised form: 24 June 2014 / Accepted: 25 June 2014 / Published: 8 July 2014
Abstract: Using the extensive archive of historical ERS-1 and -2 synthetic aperture radar (SAR) images, this analysis demonstrates that fire disturbance can be effectively detected and monitored in high northern latitudes using radar technology. A total of 392 SAR images from May to August spanning 1992–2010 were analyzed from three study fires in the Alaskan tundra. The investigated fires included the 2007 Anaktuvuk River Fire and the 1993 DCKN178 Fire on the North Slope of Alaska and the 1999 Uvgoon Creek Fire in the Noatak National Preserve. A 3 dB difference was found between burned and unburned tundra, with the best time for burned area detection being as late in the growing season as possible before frozen ground conditions develop. This corresponds to mid-August for the study fires. In contrast to electro-optical studies from the same region, measures of landscape recovery as detected by the SAR were on the order of four to five years instead of one. Keywords: synthetic aperture radar; wildland fire; tundra; Alaska; Arctic
Remote Sens. 2014, 6
6348
1. Introduction The Arctic is changing at unprecedented rates. The changes in the seasonal timing and decreased duration of frozen conditions combined with increased air temperatures has already manifested itself in visible changes in the Arctic landscape including increased plant productivity [1], thermokarst, and drying of lakes [2]. Changes in wildfire frequency and severity are suspected but undocumented in the tundra. In boreal ecosystems wildfire has already been documented as increasing in frequency and severity over the last 50 years [3]. However, the baseline fire regime in the tundra is not well quantified due primarily to the relatively low level of human habitation in Arctic regions, and thus limited fire management and suppression efforts. Historically, resources spent mapping fires have been directly correlated to human presence in the region. In turn, tundra fire records are not maintained to the level they have been in boreal regions [4]. Also contributing to the lack of tundra fire data records is that the optical satellite data record over the Arctic has limitations due to persistent cloud cover, lack of algorithms suitable to detection of burns in tundra, and quick green up of tundra vegetation within one year of fire [5]. Additionally, the physical and ecological effects of fire disturbance on the tundra are poorly understood due to the logistical challenges of obtaining field measurements, and especially repeat measurements, in remote locations. An exception to our limited understanding of fire in the tundra is observations of the 2007 Anaktuvuk River Fire on the North Slope of Alaska. This is the largest fire on record (1039 km2 burned) for the tundra biome and it doubled the cumulative area burned north of 68°N in that region since 1950 [6]. This fire has been well-studied [6–9], but appears to be a novel expression in the tundra fire record as a fire that started mid-summer (July) and persisted late into the growing season (October) and exhibited greater burn severity than typical tundra fire events [8]. Alternatively, it has been suggested that with climate change the Anaktuvuk River Fire may represent the new normal [6]. The Anaktuvuk fire scar is less than a decade old, thus many questions on recovery of a large, high-burn-severity tundra fire and long-term landscape change remain unanswered. It is generally known that the factors affecting fire occurrence and the effects of fire on the landscape differ between the tundra and the more extensively-studied boreal regions. In the tundra, as the boreal region, most fires start as a result of lightning strikes. However, while fire events in the boreal zone are of relatively high frequency (159 year fire return interval for 1860–1919 and 105 years for 1920–2009 [10]) and can be of very large size (average 203 km2 for high fire years and 78 km2 for low fire years for the period 1950–1999 [11]), in the tundra fire events are generally rare and small in size [12]). Historically, tundra fire events have occurred in June and July [13], with average size of 30–55 km2 [14] with an estimate of cumulative decadal burning of 744 km2 on the North Slope of Alaska [15]. Several ecoregion [16–19] and vegetation maps [20,21] exist for Alaska and the pan-Arctic that can be used to delineate the geographic extent of tundra. While differences exist in these map products, approximately six ecoregions are covered within tundra vegetation extents in Alaska. These geographic areas include, from north to south: North Slope Coastal Plain, Brooks Range Foothills, Brooks Range, Kotzebue Lowlands, Seward Peninsula, and Southwest Alaska. Differences in the fire regime between these geographic areas exist [6,15,22], but despite differences in fire frequency and size, the persistent patterns of vegetation across the different regions may have similar post fire recovery.
Remote Sens. 2014, 6
6349
There is evidence that climate change has led to an increase in fire occurrence in tundra regions. Hu et al. [6] show through paleoecological evidence that recent tundra burning is unprecedented in the central Alaska Arctic within the last 5000 years. Fuel loads (plant biomass) are expected to increase over time in high northern latitudes as shrub dominated land cover increases [23,24]. These enhanced fuel reserves are likely to result in increased burned area and fire severity which would be detrimental to ecosystem services such as wildlife habitat. The Alaskan tundra falls within the zone of continuous permafrost. Fire events are known to locally disturb permafrost by increasing the active layer—the depth of seasonal soil thaw. Permafrost recovery is largely a function of vegetation recovery and thus pre-fire vegetation, slope characteristics, and fire characteristics [25]. Thermokarst occurs through large-scale permafrost degradation, and can significantly alter the local hydrology though the draining and creation of thermokarst lakes [26,27]. The extent to which fire increases active layer, thermokarst, and alters surface hydrology in the tundra has not been widely investigated. Electro-optical and thermal satellite sensors may be used to detect initial changes in temperature and surface composition resulting from a fire event [28]. Synthetic Aperture Radar (SAR) sensors are sensitive to changes in surface roughness and soil moisture, making SAR useful for characterizing longer-term patterns and trends that occur post-fire [29–31]. In the persistently cloudy and hazy Arctic environments, SAR systems have the added benefit of more useable image observations as compared to electro-optical systems due to all-weather imaging capabilities. SAR data has also proven useful for monitoring other ecological parameters in high northern latitudes [32]. Recent research [5] in the North American tundra using Landsat imagery shows that the electro-optical spectral signature of burned areas deteriorate rapidly, resulting in fire-disturbed sites being poorly distinguishable from unburned tundra by the end of the first post-fire season. In contrast, the remote sensing signature in SAR imagery is likely to be much more long-lived due to the geophysical changes detected with SAR backscatter imagery. Research in the boreal region using SAR data has shown that fire scars are detectable for five to seven years post-fire [31,33]. In boreal regions fire scars are typically three to six dB brighter than adjacent unburned forests in the spring (May) after snowmelt due to changes in surface roughness, moisture, and removal of tree canopies [34]. The decreased evapotranspiration, thawing of frozen ground and deepening of active layers makes the burned regions wetter than adjacent unburned forests and this is detected by the SAR sensors as enhanced backscatter. The study presented addresses the hypothesis that the SAR signature from fire-disturbed sites in tundra will persist for several years post-fire, as has been documented in boreal sites. This paper presents a previously undocumented temporal assessment of radiometric response (i.e., SAR backscatter) captured by the SAR instruments on board the Earth Resources Satellite/European Remote-Sensing Satellite (ERS) at three fire scars in the Alaskan tundra. SAR data are shown to be useful for detection, monitoring, and quantifying temporal changes in fire disturbed landscapes. The goal of this analysis is to assess the landscape response to fire and to quantify the longevity of these effects as observed through radar images.
Remote Sens. 2014, 6
6350
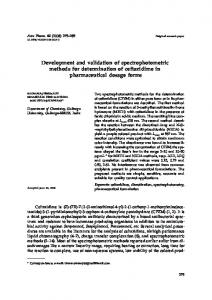
2. Materials and Methods 2.1. Study Area The 2007 Anaktuvuk River Fire, the 1999 Uvgoon Creek Fire, and the 1993 DCKN178 Fire are the focus of this analysis (Figure 1, Table 1). These tundra fires were selected to cover a range of large, medium, and small fire sizes. These fires were also selected based upon the year of burn with respect to the two-decade long radar satellite record to include fire events early, mid, and late in the data record. Inclusion of these fires also provided examples from both the Noatak National Preserve and the North Slope of Alaska. Figure 1. The Anaktuvuk River, Uvgoon Creek, and DCKN178 Fires are all located in the Foothills Ecoregion as defined by the EcoMap data layer [18], the Anaktuvuk River and DCKN178 Fires are located north of the Brooks Range and the Uvgoon Creek fire is located south of the Brooks Range.
Table 1. The Anaktuvuk River Fire, DCKN178 Fire, and Uvgoon Creek Fire are the focus of this analysis. These fires provide examples of small, medium, and large fire sizes for the tundra biome. These fires also burned at different times within the two-decade Earth Resources Satellite/European Remote-Sensing Satellite (ERS) satellite data record providing different pre-burn and post-burn lengths of observations. Fire Anaktuvuk River Uvgoon Creek DCKN178
Year of Burn
Fire Duration
Fire Size
Area Burned (km2)
2007
16 July–9 October
Large
1039
1999
26 June–3 August
Medium
359
1993
9 July–17 August
Small
68
Location North Slope Foothills Noatak National Preserve North Slope Foothills
Years of ERS SAR Data Available 15 pre-burn/3 post-burn 7 pre-burn/11 post-burn 1 pre-burn/16 post-burn
Remote Sens. 2014, 6
6351
All three fires are located in the same Foothills Ecoregion as defined by the EcoMap data layer [18], but the Anaktuvuk River and the DCKN178 Fires are located north of the Brooks Range on the North Slope and the Uvgoon Creek Fire is located south of the Brooks Range in the Noatak National Preserve. All of the fires burned for a long time (more than one month, see Table 1) and the Uvgoon Fire burned the earliest within the growing season based on the date of completed burning. The Anaktuvuk River Fire burned the latest into the growing season but also burned the longest, and portions of this fire could be representative of different burning conditions. All three fires occurred on relatively flat terrain with the burned area constrained primarily by river and stream features. The general vegetation types found in the three study areas are similar, with a dominate cover type of tussock tundra or tussock-shrub tundra [35] with the difference being the percentage of shrub, typically greater than or less than 25%. The land cover data layers for this region aren’t suitable for a detailed comparison among the study sites, but vegetation is relatively homogeneous in this region and should affect post-fire dynamics similarly. 2.2. Ancillary and Remote Sensing Data Fire scar polygons were initially obtained from the Alaska Large Fire Database [36] available through the Alaska Interagency Coordination Center (AICC; http://fire.ak.blm.gov/). Using post-fire Landsat and SAR scenes the accuracy of the AICC polygons were evaluated. The accuracy of the scars perimeters varied strongly: the Uvgoon Creek Fire perimeter was mapped very accurately whereas DCKN178 perimeter required extensive updates and corrections. Updated and more accurate perimeters were hand-digitized from Landsat imagery for the Uvgoon Creek (path 81, row 12, 8 August 1999) and Anaktuvuk River (path 75, row 11, 15 June 2008) Fires. ERS data (E1_15352_STD_F275, 22 June 1994) were used to update the DCKN178 fire as cloud-free, one-year-post-fire Landsat image scene was not available. Homogeneous paired polygon sample areas within the burn and in adjacent unburned areas were delineated to use for analysis to investigate temporal trends within each polygon and spatial homogeneity or heterogeneity of backscatter response across the landscape. Polygon samples of 6 km2 minimum size were placed to represent the geographic extents of the fire scars and to provide averaging areas to account for speckle. Three polygon pairs were selected for the Anaktuvuk and Uvgoon Fires due to their large and medium fire size, respectively. Two polygon pairs were selected for the smaller DCKN178 Fire. Pre-burn and post-burn satellite images, land cover and vegetation maps, and hydrology and elevation data layers were used to select the location of the polygon pairs. The goal of the image analysis was to remove any difference between the burn and unburned areas within each pair other than the burn status. Unburned areas in the images were selected to best match pre-burn conditions within each pair with respect to land cover classification maps, texture, tone, and landscape context (i.e., elevation and hydrology). Given the complexity of the landscape in respect to hydrologic features in all fires, fire history and topographical constraints for the Uvgoon fire, and the location of the SAR image edge in respect to the fire scar, there were limited options available for polygon placement. The size and shapes of the polygons were dedicated by the spatial complexity of the landscape and the size and shape of the fire scars. Narrow polygons were used for Uvgoon to avoid the many small kettle lakes
Remote Sens. 2014, 6
6352
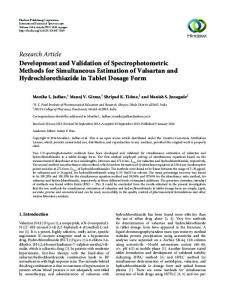
ringed by trees within the fire scar that were not prevalent outside the fire scar. Less spatial variation existed between burned and unburned polygon pairs in the Anaktuvuk and DCKN178 fires so wider rectangles were used. Any small-scale variation within the polygons was accounted for in the large size of the polygons and spatial averaging of many pixels. A map of the digitized polygons and the fire scars overlaid on an August SAR image one year post fire is shown in Figure 2. Figure 2. Post-burn ERS SAR images show higher backscatter vales (brighter) of the burned areas versus the surrounding landscape. The regions used in the ANOVA effects model and defined by the homogeneous burned and unburned polygon pairs for Anaktuvuk River Fire (a); DCKN178 Fire (b); and Uvgoon Creek Fire (c) are shown on ERS images one year post fire. The updated fire scar polygons are also shown in black.
(a)
(b)
(c)
Remote Sens. 2014, 6
6353
SAR data from the ERS-1 and -2 (C-band, VV-polarization) were used to quantify the radiometric response at the three study locations. The ERS-1 satellite was in operation from 17 July 1991 to 10 March 2000. The ERS-2 satellite was operational 21 April 1995 to 5 September 2011. All images from May to August of each year spanning the available data record from 1992–2010 were obtained to generate a nineteen year dataset. A total of 392 images were analyzed (194 from Anaktuvuk, 101 from DCKN178, and 97 from Uvgoon). Out of the 392 scenes, 279 images were acquired between June and August (the months used for statistical analysis) and the availability by fire for each year is outlined in Table 2.
1993
1994
1995
1996
1997
1998
1999
2000
2001
2002
2003
2004
2005
2006
2007
2008
2009
2010
Anaktuvuk River DCKN178 Uvgoon Creek
1992
Table 2. A total of 279 ERS-1 and -2 image scenes from June through August from 1992–2010 were used to conduct the statistical analysis. Image availability by fire and year is documented in this table.
6
5
5
10
1
3
2
6
8
6
6
7
10
10
11
12
9
7
8
5
4
4
5
0
4
4
7
4
1
3
2
2
4
4
4
4
4
6
5
5
2
4
2
0
3
7
5
5
6
4
3
4
4
3
5
6
3
2.3. Image Processing and Analysis All images were obtained from the Alaska Satellite Facility and processed using their MapReady Software (version 3.2.1). Data processing included conversion of level 1 detected data to radar cross-section (σ°) with gain correction applied to the ERS-2 data. Terrain correction and geocoding to UTM, WGS84 using a bilinear resampling method were applied using the MapReady software and images were exported as GeoTIFFs. The radiometric accuracy for ERS-1 is −0.49 dB and −1.64 dB for ERS-2 [37]. Average radiometric response within each polygon for a given image scene was calculated with the Zonal Analysis tool in ArcGIS. GIS and statistical analysis was performed on the data. Data were then converted to dB for visualization and reporting using the following equation:
Approximately four to five image scenes were available for each year from May to August (Table 2). No image scenes were available in 1996 for DCKN178 and 1997 for Uvgoon. Initial data exploration showed variable radiometric response in May among the different fires and years (see Results section), therefore we limited the statistical analysis to include only data values from June to August. Data for each polygon from each image scene within a given year were averaged to obtain one value per polygon per year. Analysis of variance (ANOVA) was used to conduct a longitudinal analysis of landscape recovery post-fire. A three-way additive effects ANOVA was implemented for each fire that estimates as a
Remote Sens. 2014, 6
6354
function of the year in which burn occurred (the year effect), the polygon regions (the region effect), and burn status (the burn effect). The model developed for the data is: (1) (2) (3) where:
Given the data model, the three-way ANOVA model is of the form:
where = 0 if unburned and = 1 corresponds to burned, and
To explore the effect of the different regions on the effect of burn, Tukey Honest Significant Differences (HSD) tests were performed for each fire. 3. Results Recent tundra fire scars appear brighter (higher backscatter values) in the SAR images than the surrounding landscape (Figure 2). Typically, fire scars are brightest one year post fire with the brightness gradually decreasing each subsequent year post-fire. The fires evaluated are approximately 3.0 to 3.3 dB brighter than adjacent unburned areas during the end of the growing season one year post fire. For the Anaktuvuk and Uvgoon datasets the difference between burned and unburned is smaller (0.1 to 0.6 dB) in early May, with the difference increasing over the growing season, and reaching a maximum in early to mid-August (Figure 3). This trend cannot be evaluated in the DCKN178 plot (Figure 2), because May and August data were not available one year after the fire event. Generally, the May data for all three fires showed variable response year-to-year but May images consistently showed less differentiation between burned and unburned signatures. Plots of the radiometric response over the entire ERS data record (Figure 4) clearly show the fire event (dashed line in Figure 4 plots) and the lasting impact on the record. Visual inspection of the plots shows the divergence in the burned versus unburned series that persists for approximately four to five years post fire for all three scenarios. The Uvgoon fire generally has higher and more stable
Remote Sens. 2014, 6
6355
backscatter values than the Anaktuvuk and DCKN178 fires. The Uvgoon data record shows dB values in the range on −6 to −11 with the approximately 3 dB separation in the burned versus unburned polygons. The North Slope fires, Anaktuvuk and DCKN178, have backscatter values in the range of −6 to −17 dB with a decreasing trend over time. The fire event is again clearly visible in these temporal plots. Figure 3. Plots of May through August backscatter one year post fire for Anaktuvuk River (a), DCKN178 (b), and Uvgoon Creek (c) within the entire burn perimeter (grey square) and polygon pairs (red corresponds to burn and blue to unburned) show the intra-annual variation in the radiometric response. Maximum differentiation between burned and unburned areas occurs late July to mid-August.
(a)
(b)
(c) The ANOVA results show approximately four to five years are needed for landscape recovery, as defined by a return to the pre-fire signature, of burned areas in the SAR imagery. Plots of the burn years versus the effect of burn for each fire (Figure 5) show a return to zero effect, within the 95%
Remote Sens. 2014, 6
6356
confidence envelope, at 2004 (five years post fire) for Uvgoon Creek and at 1998 (four years post fire) for DCKN178. The Anaktuvuk River Fire does not return to zero effect of burn given the available data, but 2008, 2009, and 2010 (three years post fire) are all above the zero effect line. Figure 4. Plots of the backscatter response over time for the entire ERS-1 and -2 data record for Anaktuvuk River (a), DCKN178 (b), and Uvgoon Creek (c). The dashed line shows the fire event within the data record. Burned polygons are represented with red markers and unburned polygons with blue. Points represent averaged data from June, July, and August. Note the long-term, downward trend in the Anaktuvuk (a) and DCKN178 (b) plots that is occurring irrespective of the fire event. This trend is not evident in the Uvgoon (c) plot. This may indicate an overall regional trend, such as drying, for the North Slope of Alaska that is not occurring elsewhere.
(a)
(b)
(c) The Tukey HSD tests were implemented to investigate if differences existed in the means of the different regions within each burn. The results were variable and did show some regional effects for the Anaktuvuk and Uvgoon Creek Fires (Table 3). No significant difference between Regions 1 and 2 (p = 0.097) were found for the DCKN178 Fire. For the Anaktuvuk River Fire no difference was found between Regions 1 and 2 (p = 0.428) but statistically significant differences were found between Region 3 and Regions 1 and 2 (p < 0.001 for both). For the Uvgoon Creek Fire no significant difference was detected between Region 2 and 3 (p = 0.956) but a significant difference between Region 1 and Regions 2 and 3 (p = 0.001 and p = 0.004, respectively) was observed.
Remote Sens. 2014, 6
6357
Figure 5. Plots of the effect of burn derived from the ANOVA model for Anaktuvuk River (a), DCKN178 (b), and Uvgoon Creek (c) show landscape recovery (a return to zero burn effect) four years post-fire for DCKN178 (b) and five years post-fire for Uvgoon (c). Not enough data are available to document the return for the Anaktuvuk River Fire (a), but three years post fire is above the zero-effects line. The 95% confidence intervals are represented by the dashed blue lines and the fire year is shown by the dashed black lines.
(a)
(b)
(c) Table 3. The p-values from the Tukey HSD test show Region 3 from Anaktuvuk and Region 1 from Uvgoon (Figure 2) are statistically difference from the other regions within these fires. DCKN178 Region 1 Region 1 Region 2 Anaktuvuk River Region 1 Region 2 Region 3
Region 2
0.097
Region 1
Region 2
0.428